calculations (e.g. the 3C method of Maulbetsch and Briggs (1993a, b, 1994); the 2SC .... E2/E1 = 8 TDCS at E = 9 eV, measured with a photon source of high circular .... An important requirement of the Wannier threshold model is the correct ...... case there is clear evidence of the ungerade amplitude, as the node at θ12 = Ï.
J. Phys. B: At. Mol. Opt. Phys. 33 (2000) 4691–4709. Printed in the UK
PII: S0953-4075(00)51117-1
(γ , 2e) in He—a practical parametrization of the triple differential cross section S Cvejanovi´c and T J Reddish Physics Department, University of Newcastle, Newcastle NE1 7RU, UK Received 20 June 2000, in final form 12 September 2000 Abstract. Several model functions capable of representing the symmetrized transition amplitudes within the parametrization formalism of Huetz et al for the photodouble ionization of helium are proposed. The model is based on the well documented features of the gerade transition amplitude in the cases of symmetric energy sharing and/or small excess energies. Those are extended towards the higher excess energies and for an arbitrary energy sharing, where both the gerade and the ungerade components of the transition matrix contribute, with a minimum of modifications. Excellent agreement between a sample of experimental and theoretical triple differential cross sections (TDCS) extending up to 40 eV on one side and the parametric form on the other is obtained by using just three adjustable parameters which could be reliably extracted from most experiments. This creates the possibility for a complete dynamical parametrization of the TDCS in the low to intermediate excess energy range.
1. Introduction One of the remaining challenges in atomic and molecular physics is a definite representation of electron correlation in many-particle decay processes. This is arguably best studied by considering the triple differential cross section (TDCS) for the photodouble ionization (PDI) of helium, as all three receding particles are structure-free and the symmetry of the system is fully determined by the angular momentum of the photon. The relative simplicity of this most fundamental system provides the clearest opportunity to disentangle the effects of the quantum and classical forces and gain insight into the dynamics of the three-body escape process. Fast convergence between early experiments (Schwarzkopf et al 1993, 1994, Huetz et al 1994, Dawber et al 1995) and the results of the quantum mechanical and semiclassical calculations (e.g. the 3C method of Maulbetsch and Briggs (1993a, b, 1994); the 2SC method of Pont and Shakeshaft (1995); or the wavepacket propagation method of Kazansky and Ostrovsky (1994, 1995a)) has established beyond any doubt that inclusion of electron correlation is essential in achieving realistic angular distributions. However, within those approaches this could be achieved only approximately, leading to quantitative disagreements between the various calculations and some of the experiments (Pont et al (1996) and references therein). This situation has triggered renewed efforts on the theoretical front. On the one side, computationally more intensive but physically less transparent approaches to the ionization problem appeared, such as the converged close coupling (CCC) method (Kheifets and Bray 1998a), the time-dependent close coupling calculations (Pindzola and Robicheaux 2000) and a radically new theoretical approach of Rescigno et al (1999), which avoids the use of asymptotic wavefunctions but requires exceptionally large computing power. On the other side, further attempts have been made to understand the helium PDI distributions by investigating particle 0953-4075/00/214691+19$30.00
© 2000 IOP Publishing Ltd
4691
4692
S Cvejanovi´c and T J Reddish
dynamics (the R-matrix method in combination with the semiclassical calculation of Malegat et al 1999) or the correlation-imposed symmetries (group-theoretical approach of Qiu and Burgd¨orfer (1999)). Subsequent experimental investigations (e.g. Cvejanovi´c et al (2000) and references therein) have been directed towards the identification of experimental conditions which would provide sensitive tests for emerging theories. They require measuring TDCS over a range of energies and for unequal distribution of the excess energy (E) between the two ionized electrons, and a synchrotron light source of well defined polarization state with either a dominant circular component or a strong linear polarization nearly collinear with the direction of the ‘reference’ electron (θ1 ∼ 0, π ). (We prefer this term to the term ‘fixed’, frequently used to denote one of the two coincident electrons whose detector is stationary during TDCS measurement. The other electron’s angle (θ2 ) in principle covers the whole range, although experimental restrictions may apply.) It appears that the agreement of any theory with experiment in the more demanding circumstances mentioned above is inconsistent, requiring comprehensive tests with reliable and statistically accurate experiments before the relative merits of a particular theory can be established. The measured TDCS are usually presented for a varied choice of experimental variables enumerated above, which make them difficult to relate to other published experimental and theoretical results. This identifies the need, particularly in the experimental community, for such a representation of the general helium TDCS, which would allow a small number of adjustable parameters to be reliably extracted from the measured data. For a very comprehensible recent review on that subject see Briggs and Schmidt (2000). 2. The Gaussian ansatz and its alternatives A TDCS expression containing just two free parameters (one if relative measurements are concerned) was proposed by Huetz et al (1991, 1994) for a rather limited subset of dynamical conditions prevailing close to the PDI threshold (E ∼ 0): � � −4 ln 2(θ12 − π )2 σ (E, θ1 , θ2 ) = a(E)(cos θ1 + cos θ2 )2 exp . (1)
2 (E) This assumes completely linearly polarized radiation, but the inclusion of unpolarized light is straightforward (Schaphorst et al 1995). In (1) the effects of experimental geometry (kinematics), defined in terms of the angles θi between the electron detectors and the polarization direction, are separated from those of the particle dynamics, which are represented by a Gaussian function of the mutual angle θ12 . The distribution peaks for θ12 = π and has an excess energy-dependent half-width ∼ E 1/4 . The use of the Gaussian form for describing the final state distribution over θ12 was first proposed by Rau (1976) in a quantum mechanical calculation based on the classical Wannier theory (Wannier (1953): for a review, see Read (1985)) and is directly associated with the electrostatic repulsion between the receding electrons which persists to a very large distance. Subsequent experimental and independent theoretical investigations failed to confirm the predicted scaling law, possibly indicating its extremely small validity range. If that requirement is dropped and the width of the Gaussian distribution treated as an energy-dependent empirical parameter, one arrives at the so-called ‘Gaussian ansatz’. With that restriction the parametrization (1) is consistent with the shapes of measured PDI TDCS for energies of a few eV or less (Lablanquie et al 1995, Dawber et al 1995, Huetz and Mazeau 2000), which were found to be largely insensitive to the electron energy sharing. Unfortunately these difficult experiments (see also D¨orner et al 1998) contain rather large experimental errors which prevent a more critical evaluation of the precise shape of the dynamical factor. This remains an interesting problem as other theoretical work (see
(γ , 2e) in He
4693
Kazansky and Ostrovsky (1993) and references therein) showed that the Gaussian ansatz is not a general solution. Ironically, perhaps the most stringent tests of the Gaussian ansatz came from fitting the equal energy-sharing TDCS at a much higher energy of ∼20 eV, well outside the threshold region, where much higher measuring accuracy was achieved (Schwarzkopf and Schmidt 1995, Malegat et al 1997b, Wightman et al 1998). One is tempted to conclude that the equal sharing case is linked with the threshold case not only formally (see the next section) but also more intimately by sharing the same part of the configuration space in the inner regions of the Coulomb zone. The other remarkable feature of the equal energy sharing TDCS over the excess energy range investigated up to now is an unexpectedly small dependence on energy. These and other related aspects of this correlation-dominated process have been investigated with considerable success by the extended Wannier ridge model (EWRM) of Kazansky and Ostrovsky (1993, 1995b). A significant breakthrough on the parametrization front was made by Malegat et al (1997a, b), who laid down a framework for an exact parametrization of an arbitrary cross section via an expansion of the gerade and ungerade amplitudes (defined in section 3) over the standard functions of θ12 . Malegat et al (1997b) tested it on the measured equal energysharing distributions in He (for E = 4 and 18.6 eV) and Ne (E = 12.6, 24 and 43 eV) and demonstrated its flexibility to incorporate the specifics of those two systems (arising from the initial-state differences) while restricting the expansion to the individual electron’s angular momentum quantum numbers li � 4 (l = 3 in He at higher energy). The resulting geradeamplitude shapes in He were, however, indistinguishable from a Gaussian. In the only attempt at parametrizing the unequal energy-sharing TDCS so far, Soejima et al (1999) analysed their E2 /E1 = 8 TDCS at E = 9 eV, measured with a photon source of high circular polarization. Their amplitude model was a hybrid one; the gerade amplitude was fitted with a Gaussian sitting on a small constant ‘platform’, but the much smaller ungerade amplitude was treated with a full expansion of Malegat et al (1997a) and found to be nearly flat. Although this result indicated that the strictly Gaussian parametrization may be inappropriate for the cases of large energy asymmetry, in line with the 3C results of Maulbetsch and Briggs (1994) for the similar energysharing ratio but much larger excess energy of 53 eV, one should regard their conclusions with caution. A closer examination of the fitting procedure of Soejima et al (1999) shows that their result suffers from the non-uniqueness of the fit due to the large number of fitting parameters (eight in this case) and a relatively simple cross section shape. This especially concerns the apparent near-constant (and small) ungerade amplitude, as its effects would be most noticeable at small mutual angles where the experimental data are understandably scarce. The general problem of uniqueness of the fit using the partial wave expansion method has already been discussed by the authors (Malegat et al 1997b). Further discussion of the parametrization of Soejima et al (1999) will be given in section 6. In this paper a more practical yet sufficiently accurate parametrization of the relative TDCS is developed for arbitrary energy sharing and covering a wide range of excess energies E stretching from threshold to well beyond the energy of the peak of the total PDI maximum. It is based on: (i) the proven success of the Gaussian amplitude function to represent the mutual-angle dependences at small excess energies; and (ii) the assumption that the angular correlations within the participating amplitudes at higher excess energies are only weakly affected by the wavefunction symmetry or the increased electron energy asymmetry. 3. The parametrization formula We will expand here on the outline already presented in Cvejanovi´c et al (2000) (hereafter referred to as I). For the overall 1 Po state symmetry (which applies to He) and disregarding the
4694
S Cvejanovi´c and T J Reddish
spins of the detected electrons, the basic expression for the TDCS for light which is linearly polarized along the x-axis was given by Maulbetsch and Briggs (1994) in the form σx = |g(E1 , E2 , θ12 ) cos θ1 + g(E2 , E1 , θ12 ) cos θ2 |2
(2)
and by Huetz et al (1994) as σx = |ag (cos θ1 + cos θ2 ) + au (cos θ1 − cos θ2 )|2
(3)
resulting in the following relations between the amplitudes: 2ag = g(1) + g(2);
2au = g(1) − g(2).
(4)
The symmetrized form (3) has the simple kinematic factors from (2) replaced by the combinations which are either symmetric (gerade) or antisymmetric (ungerade) upon the exchange of the two electrons. Due to the indistinguishability of the two electrons, the dynamic amplitudes must share the symmetry with the associated kinematic factors, i.e. ag (1/R) = ag (R);
au (1/R) = −au (R)
(5)
where we define the energy-sharing parameter R by R = E2 /E1 . A special dynamic case is the equal energy-sharing TDCS, for when E1 = E2 we see from (4) and (5) that the ungerade amplitude (au ) must be zero. Then |ag |2 (= |g(E/2)|2 ) factorizes out of (3). Essentially the same situation arises in the threshold region (1) as, when E → 0, so does the ratio au /ag (Green and Rau 1983). In the general case of unequal energies the contributions of the ungerade term cannot be separated from the gerade and a factorization of the TDCS via the kinematic and dynamic factors is no longer possible. The decomposition of the general TDCS via the sum over the polarization components of the photon flux (see Schaphorst et al 1995, Soejima et al 1999) leads to σ = PI + S1 LD − S3 CD
(6)
where S1 and S3 are the Stokes parameters which fully determine the polarization state in the tilted coordinate frame in which the electron angles are measured with respect to the direction of the major axis of the polarization ellipse (x-axis). With this choice of frame the Stokes S2 parameter is zero. We restrict electron trajectories to the plane perpendicular to the photon beam, travelling along the z-axis towards the observer. To specify the circular polarization component, we use the ‘optical’ definition of S3 (Schmidt 1997) for which the right- (negative helicity) and left- (positive helicity) state of the circular polarization correspond to a positive and negative sign of S3 , respectively. The PI, LD and CD in (6) have the following meaning: • PI—the polarization insensitive part, defined as the sum of the TDCS for two orthogonal orientations of the polarization vector in the linear polarization case, or of two opposite helicities in the circular polarization case. • LD—the linear dichroism part, defined as the difference between the TDCS patterns for the linear polarization vector lying along x and orthogonal to it. • CD—the circular dichroism part, defined as the difference between the TDCS patterns when the helicity of the photons is changed from positive (left) to negative (right). Observe that the same symbol is sometimes used for the CD/PI ratio (Berakdar 1999). The following explicit expressions for the constituents of (6) have been derived from the pure polarization state cross sections of Malegat et al (1997a) after substituting ag , au for their Mg , −Mu , denoting the phase difference between a complex au and a real ag by φ, and assuming a coplanar geometry with the measuring plane normal to the photon beam, in which
(γ , 2e) in He
4695
θ12 = θ2 − θ1 : PI = (1 + cos θ12 )(ag )2 + (1 − cos θ12 )|au |2 ,
(7)
LD = (ag ) (cos θ1 − sin θ2 + cos(θ1 + θ2 )) + |au | (cos θ1 − sin θ2 − cos(θ1 + θ2 )) +2ag |au |(sin2 θ2 − sin2 θ1 ) cos φ
(8)
CD = −2ag |au | sin θ12 sin φ.
(9)
2
2
2
2
2
2
Thus the problem of parametrization of an arbitrary TDCS reduces to finding suitable expressions for the symmetrized amplitudes au and ag . The more general three-dimensional forms can be developed along the same lines (see, in particular, Briggs and Schmidt (2000)).
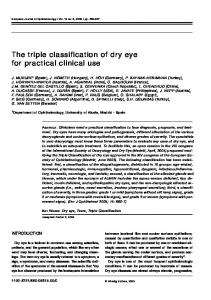
4. The amplitudes What do we know about the amplitudes in the case of unequal energy sharing? Setting aside for the moment the actual mechanism for electron correlations, we can think of the twoelectron operators g(i) in (2) as describing the distribution of the photon energy and angular momentum between the two ejected electrons whose detection angles are θi . This interpretation is consistent with the analytic form of the TDCS derived by Maulbetsch and Briggs (1993a) for the uncorrelated case, in which |g(i)|2 are directly related to E(i), and with the observed concentration of the excess energy and angular momentum of the absorbed photon into just one of the two ejected electrons in the case of high excess energy (see Briggs and Schmidt 2000). To uncover the most basic relations between the ratios and the phase angles of the amplitudes in the two representations, let us assume that, to a first approximation, the mutualangle dependence within each member of the amplitude pairs is the same. This allows the angular correlation part of the total transition amplitude to be factorized out, enabling a purely geometrical representation of the relations between the magnitudes and the phase relations as in figure 1. It is important to remember that, when we discuss the amplitudes with reference to figure 1, this does not mean that the electron correlations have been ignored. In the present model the mutual relation between the vectors representing the amplitudes is basically the same for all mutual angles, i.e. the angular correlations are only weakly affected by the differences due to amplitude symmetry. This simplifying assumption is a crucial premise in our approach, as the separation of the mutual angle distribution from the remaining attributes of the correlation amplitudes does not only result in a remarkably compact description of the cross section but also makes its features more transparent to the effects of the electron dynamics. The schematic diagrams in figure 1 show some significant differences between the amplitudes g(1), g(2), au and ag (their intensities and the phase angles) close to the dynamic limits. These limits are taken to be the equal (a) and extremely unequal (b) energy sharing. The relative magnitudes of the g(i) amplitudes in figure 1 bear a resemblance to the energy asymmetry, while their relative orientation has been chosen arbitrarily to make the phase difference φ between au and ag positive. The initial ambiguity in the sign of φ has no consequence on the cross section, as long as the source is not circularly polarized. From the above interpretation of the g(i) amplitudes and their relations (4) to the ungerade–gerade amplitudes, we conclude that the ratio between the ungerade and gerade amplitudes η = |au |/ag spans the range from 0 to 1. The lower value corresponds to au = 0 and applies to the equal energy-sharing case, while the upper limit is realized in the case of maximum unequal energy sharing. Further discussion of the ‘geometrical’ aspect of the transition amplitudes will be given later.
4696
S Cvejanovi´c and T J Reddish
(a) E1 ~ E2
(b) E1 >> E2
φ
φ
g(1)
au
ag g(2)
au
g(1) ag
g(2)
Figure 1. A geometrical (schematic) representation of the transition amplitudes from (2) and (3) for radically different electron dynamics close to the symmetric (a) and asymmetric (b) energy-sharing limits.
The above sketchy information about the amplitudes obtained from the wavefunction symmetry will now be complemented and expanded by a semiclassical analysis of electron trajectories during their passage through what is commonly referred to as the Coulomb zone (for the definition of its boundaries see Read (1985)). This in particular provides a model for the angular correlations close to threshold and their evolution with excess energy or energy sharing. Our discussion will be highly selective and phenomenological, based on the Wannier model and its implications which we deemed relevant. For more recent work on the expansions of the Wannier model see Feagin (1995), and in particular Kazansky and Ostrovsky (1993, 1995b). An important requirement of the Wannier threshold model is the correct treatment of electron dynamics at all stages of their escape where the semiclassical method is appropriate. Consequently, the relevant measure of the symmetry/asymmetry of the electron’s trajectories is not just R, defined after all the interactions have ceased, but the relative asymmetry in the trajectories of the escaping electrons throughout the Coulomb zone, where the unspent portion of their initial kinetic energies is appreciable and much larger than their asymptotic energies. One can make a rough estimate of the starting electron’s energy by adding the energy of the absorbed photon (Et + E) to their orbital energy, which is approximately Et (according to the virial theorem), and then sharing those between the two electrons almost equally. This large energy offset introduces the threshold energy (Et = 79 eV in He) as an appropriate yardstick when comparing the ranges of validity of threshold phenomena (or any other dynamic variable) between the otherwise similar systems. The other important point is that the kinetic energies of the escaping electrons are well balanced when they are in the vicinity of the ion core. This is a result of the destabilizing action of nuclear attraction on the radial correlation between the escaping electrons, the so-called ‘dynamic screening’ effect (Rau 1971). By propagating the ionization trajectories backwards in time one focuses onto the initially more symmetric radial configurations. In the cases of near-threshold PDI or equal energy sharing, the prevailing initial configuration is located on the Wannier ridge, r1 = r2 . As it happens that in both these cases the ungerade amplitude vanishes, an intuitive connection between the amplitude ratio η and the departure of the initial configuration space from the Wannier ridge is suggested. The association of η with the particle dynamics at relatively small distances from the nucleus, where the symmetric configuration prevails, favours the gerade over the ungerade amplitude at all finite excess energies. This analysis is in qualitative agreement with the more general threshold
(γ , 2e) in He
4697
scaling laws mentioned earlier (Green and Rau (1983); for a recent in-depth discussion see the review of Briggs and Schmidt (2000)) but cannot be replaced by them, as their derivation lacks the detailed account of the asymmetry in the energy sharing. The insight into the dynamics of the two-electron break-up process discussed above allows many of the seemingly intriguing features of near-threshold PDI to be readily appreciated. For example, the ‘freezing-out’ of the measured and calculated angular patterns for the complementary energy-sharing choices (R = 3, 1/3) at E = 0.6 eV, discussed in Briggs and Schmidt (2000), is hardly surprising. According to our assessment of the energy asymmetries this case corresponds to the upper limit of the asymmetry in the radial distances of the two electrons in the early stages of their departure (where the Coulomb interaction is strongest) of ∼0.2%, but the real value must be much smaller when the dynamic screening effect is taken into account. This places the whole family of E = 0.6 eV trajectories, comprised of the electron pairs with arbitrary energy sharing, firmly onto the Wannier ridge for most of their interactions, leading to the same correlation pattern. Within the TDCS parametrization (3) this requires formally that au /ag → 0 and that ag is not a function of R. The Coulomb repulsion drives the mutual angle between ejected electrons towards θ12 = π ; hence its action is stabilizing the angular correlations. The energy dependence of the correlation width for the equal energy sharing is rather obvious—faster electrons need a longer interaction time for the same relative change of their direction, while the actual time spent travelling through the Coulomb zone gets shorter. Consequently R=1 increases (angular correlation weakens) when the excess energy E increases. For the electron energies associated with the Wannier ridge the angular correlation is largely de-coupled from the radial correlation, but as the electron energy asymmetry grows an interesting question arises: should the angular correlation depend on R—and in what way? Perhaps the most convincing line of argument is again the one in terms of the interaction time. In the later stages of electron escape, near the border region between the Coulomb zone and the free zone, the final electron energies are already largely established while their directions are still affected by their repulsion. If one deals with the two equal energy electrons travelling √ in roughly opposite directions, each departs from the other with the relative velocity of 2E/m. If,√however, one electron is much slower than the other, their relative velocity approaches only E/m, and the remaining time for which the electrostatic field influences their direction is proportionally longer. The cumulative effects over the whole trajectory are, of course, much smaller, but this numerical example indicates that the correlation width decreases (angular correlation increases) for those electron pairs whose energy is shared more unequally. Let us now look into the role of the phase angle φ. By examining the TDCS components (7)–(9) we see that, if all the other parameters are set constant, sin φ controls the amplitude and sign of the CD term, while cos φ has the same effect on the last term in the LD expression. These two terms contain the product of the two amplitudes and can be interpreted as showing their interference. Consider the symmetry feature (5). The required change of sign of au upon the exchange of electron energies (R ↔ 1/R), which could be parametrized by φ(R) = φ(1/R) + π, results in changing the character of the interference (constructive ↔ destructive). From (8) we see that cos φ controls the mutual difference between the angular patterns for the slow and the fast electron, providing a measure of the asymmetry in the distribution of the photon’s angular momentum between the two ejected electrons. There is, however, an intrinsic link between φ and η in the interference term, which could lead to further simplifications in a complete parametrization model. Let us discuss the situation in the dynamic limits with reference to figure 1. For the highly asymmetric energy sharing the ag and au vectors must become nearly collinear, leading to φ → 0 in the case R → 0, figure 1(b), or φ → π for the complementary case R → ∞. As a direct consequence
4698
S Cvejanovi´c and T J Reddish
the circular dichroism (9) should vanish. In the intermediate cases of electron dynamics the phase difference might grow, but the actual value of the angle φ cannot be determined without knowing the exact link between the intensity and angle asymmetries of the g(i) amplitudes. The situation depicted in figure 1(a) assumes that, when η → 0, the convergence between the g(i) intensities is faster than between their angles, leading to φ → π/2. If the opposite was true, φ would converge to zero. This ambiguity is removed with reference to the analysis of the experimental data in section 5. It is interesting to note that, irrespective of the value of φ, the CD again vanishes, though for a different reason—due to |au | → 0. 4.1. The amplitude models Our aim is to represent the general dynamical amplitudes ag,u (E 1 , E2 , θ12 ) by functions of θ12 with the smallest possible number of energy-dependent parameters. A hierarchy of forms with increasing number of parameters is introduced below to cope with the expected gradual departure between the amplitude forms at higher energies E from that at threshold. An obvious starting point is to adopt the Gaussian form for the mutual angle dependence in the threshold archetype. We further assume that the angular correlation function is insensitive to the symmetry (gerade ↔ ungerade) or the electron energy asymmetry, restricting those to appear only in φ and η. This basic parametrization model (3P) has just three parameters—the correlation width (E), the ratio between the peaks of the symmetrized amplitudes, η(E, R), and the phase angle between them, φ(E, R): � � −2 ln 2(θ12 − π )2 ag3P (E, R, θ12 ) = ag (E, 1, θ12 ) = exp , (10)
2 (E) � � −2 ln 2(θ12 − π )2 3P iφ(E,R) au (E, R, θ12 ) = η(E, R)e exp . (11)
2 (E) The assumption about the insensitivity of the correlation width to R is likely to hold better for smaller excess energies, in line with our discussion of the threshold model. In that case only two new parameters mark the transition from equal to unequal energy sharing at the same total energy: η and φ. For relatively high E it is possible to envisage that reduces slightly when R increases, as argued above, prompting the replacement of (E) with a more general form (E, R) in (10) and (11). A slightly more complicated form (4P) allows for the differences in the correlation widths between the gerade and ungerade amplitudes, replacing with g and u in (10) and (11), respectively. Within the semiclassical model, the conjecture about the association of the ungerade amplitude with the trajectory differences at the very early stages in the escape (boundary condition) offers the formal justification for this step, but a prediction of how the two amplitudes would be affected cannot be made. As a last step in the increasingly complex amplitude descriptions (although still compatible with our basic ‘Gaussian’ model) we will allow the amplitudes to contain additive constants. The suggested normalization of the angular distribution functions preserves the amplitude ratios between the 3P, the 4P and the 6P models in the vicinity of θ12 = π : � � 2 12 −π ) exp 2 ln 2(θ + Cg (E, R) 2 (E,R) g ag6P (E, R, θ12 ) = (12) 1 + Cg (E, R) � � 2 12 −π ) + Cu (E, R) exp −2 ln 22(θ u (E,R) au6P (E, R, θ12 ) = η(E, R)eiφ(E,R) . (13) 1 + Cu (E, R)
(γ , 2e) in He
4699
By adding a constant term to the Gaussian in the amplitude function, the 6P model becomes capable of closely fitting the shapes calculated by Maulbetsch and Briggs (1994) using the 3C theory for E = 53 eV and R = 9. Observe the ‘C’ function in their figure 9(c), which shows a finite yield for θ12 = 0 (‘forward yield’). This is actually |g(1)|2 and corresponds to |au + ag |2 in our notation. The forward yield is allowed in the semiclassical description as the two asymmetric energy electrons are separated in time. All amplitude models introduced above fully comply with the exact parametrization of Malegat et al (1997a), in the sense that the assumed amplitude shapes and the phase difference angle can be accurately reproduced by a suitable choice of the expansion coefficients in their theory. The general partial wave decomposition of Malegat et al (1997a) is, of course, less restrictive than our model functions, on account of having a larger number of parameters (10 for the realistic choice of lmax = 3, compared with 3, 4 or 6 for the forms 3P, 4P or 6P, respectively). 5. The fitting of the 40 eV TDCS The measurements in I are particularly suitable for testing the theory because of their relatively high energy (E = 40 eV) and the extensive coverage of the variable’s phase space (θ1 , θ2 , R). The relative TDCS were measured for linearly polarized photons (S1 = 0.8, S2 = S3 = 0) and compared with the 3C and CCC calculations. Excellent agreement in the R = 1 case was found throughout, including the fit of the measurements with (1) shown in figure 2. The fitting function agrees exactly with the CCC calculation. The extracted correlation width in that case is (E = 40, R = 1) = 103 ± 2◦ . For unequal energy sharing the agreement was good when the angle between the reference electron (θ1 ) and the polarization axis was 90◦ , but when θ1 approached the polarization direction all spectra started to diverge. We have applied the present parametrization (up to the 4P level) to the same spectra and some of the results are shown in figures 2–4. Figure 3 shows a sample of the He 40 eV, R = 3 cross sections reported in I, consisting of the θ1 = 90◦ and 180◦ spectra. The fitted curve which closely agrees with both spectra leads to the following parameter values: g = u = 101(2)◦ , η = 0.16(1), φ = ±260(5)◦ . The values within the parentheses indicate the estimated errors and the alternative signs of φ serve as a reminder that for a linearly polarized source the sign of φ remains undetermined (see equation (8)). Evidently the 3P parametrization is adequate in this case. Note, though, that the extracted value for the correlation width at R = 3 is marginally smaller than the value for R = 1, but the difference is relatively insignificant, even for this relatively large difference in energies of the detected electrons. The phase relation between the ungerade and the gerade amplitudes is very interesting—the two vectors are nearly orthogonal, as in the dynamic limit assumed in a model represented graphically in figure 1(a). Apparently that is in agreement with the above conclusion that the present dynamic case belongs to the small-asymmetry class. In addition, it confirms the assumption of a closer correlation between the intensities of the transition moments g(i) than between their angles in the limit of symmetric dynamics. Figure 4 shows the TDCS for a more asymmetric energy sharing, with E1 = 5 eV (R = 7). For the sake of clarity the six measured spectra are compared only with the parametrized curve. The level of agreement both in shape and intensity variation across the full range of θ1 is clearly excellent, much better than for the ab initio calculations which were compared with the experiment in I. The best overall fit parameters again favour the 3P model: g = 98(3)◦ ,
u = 98(4)◦ , η = 0.25(1), φ = ±246(4)◦ . The trend in the variation of the fit parameters from R = 1 to 7 is as expected—for the more asymmetric energy sharing the ratio between the ungerade and the gerade amplitude (η) increases, while the phase angle between them (φ)
4700
S Cvejanovi´c and T J Reddish θ1 = 950
θ1 = 1050
θ1 = 1150
θ1 = 1250
θ1 = 1350
Figure 2. Equal electron energy-sharing TDCS at E = 40 eV and for linear polarization (S1 = 0.8). The internally normalized data from Cvejanovi´c et al (2000), (I), are fitted by the Gaussian ansatz (1) with = 103◦ .
(a)
θ1 = 90 0
(b)
θ1 = 180 0
x2
Figure 3. TDCS in helium at E = 40 eV and R = 3. The angle of the reference electron (E1 = 10 eV) with respect to the polarization axis is indicated. The data and the ab initio calculations (chain curve, CCC; short dashes, 3C length gauge; long dashes, 3C velocity gauge) are from I. All TDCS are normalized at θ1 = 90◦ . The full line is the 3P parametrization (see the text).
progressively departs from ±π/2. The half-widths of the amplitudes remain mutually identical for all practical purposes, but the small decrease of the correlation width with increasing R seems confirmed. It was already noticed in I that theory and experiment converged extremely well if the reference electron was detected at 90◦ with respect to the polarization direction, as in figure 3(a). This is because for that θ1 angle the strong symmetry rule (Maulbetsch and Briggs 1995) forbids
(γ , 2e) in He
4701
θ1 = 1300
θ1 = 1400
θ1 = 1500
θ1 = 1600
θ1 = 1700
θ1 = 1800
Figure 4. TDCS in helium at E = 40 eV and E1 = 5 eV (R = 7). The experimental data (from I) are normalized to the 3P parametrization for the θ1 = 180◦ TDCS.
the parallel/antiparallel emission for every R, thus suppressing the contribution of the ungerade amplitude and the forward yield. However, we see from (2) and (3) that the 90◦ TDCS is yet another case in which the kinematics is separable from the dynamics: � π� = |g(2)|2 cos2 θ2 = |ag − au |2 cos2 θ2 (14) σx θ1 = 2 allowing direct access to the calculated dynamical factor. As a representative example we have re-analysed the velocity-gauge 3C TDCS from I by first removing their S1 dependence (using a combination of the θ1 = 90◦ and 180◦ TDCS) and then dividing them by cos2 θ2 . As the calculated shapes of the dynamic factor from (14) are so close to a Gaussian that the differences would be unresolvable, we plotted their square roots in figure 5 for each energy-sharing ratio available. The R = 1 graph shows the calculated |ag | function for the E1 = E2 = 20 eV case, which is very close to a Gaussian except for a somewhat faster reduction at small mutual angles. In the two other cases, corresponding to a growing energy asymmetry between the ejected electrons, the plotted factors show remarkable similarity with the equal-energy-sharing case. This strongly endorses our main proposals (i) and (ii). However, small but systematic changes with R do appear—a growing forward yield, most noticeable for R = 7, and a gradual narrowing of the half-width. The best fitted Gaussian curves for the R = 1, 3 and 7 cases have
= 104, 102 and 100, respectively, in very good agreement with the empirical values for au and ag amplitudes reported above. The platform under the peak of the calculated |g(2)| in (c) is much too small to be observable in the measured spectra, but this trend within the 3C theory continues (see the C(=|g(1)|2 ) function of Maulbetsch and Briggs (1994) for the E1 = 5 eV and E2 = 48 eV case). The close agreement between the fitted angular distributions and those calculated by the 3C theory still does not prevent the observed disagreements in the TDCS at θ1 = 180◦ , shifting the emphasis to the role of the relative flux factor (η) and the phase angle (φ). The effects which those parameters have on the TDCS are elucidated in the examples in figure 6.
4702
S Cvejanovi´c and T J Reddish R=1
(a)
R=3
(b) 1
1
0.5
0.5
0.5
0
180
360
0
180
R=7
(c)
1
360
0
180
360
mutual angle [deg.] Figure 5. The amplitude shapes extracted from the 90◦ 3C (velocity gauge) TDCS calculated in I (see the text). The dots represent the modulo of the function g(2), equal to |ag − au |. The continuous curves in (a)–(c) are for reference only and represent a Gaussian whose square has a half-width of 104◦ .
(a)
(b)
(c)
Figure 6. The 3P parametrization for the reference electron collinear with the polarization direction (S1 = 1). The correlation width = 103◦ . (a) φ = 225◦ ; η = 0.15 (full curve), 0.2 (chain curve) and 0.25 (broken curve). (b) η = 0.25; φ = 180◦ (full curve), 240◦ 0 (chain curve), 270◦ (broken curve). (c) η = 0.25 φ = 0 (full curve), 60◦ (chain curve), 90◦ (broken curve).
In figure 6, (a) and (b) represent the cases where the reference electron (θ1 = 180◦ ) is the slow one, i.e. R > 1 and hence π < φ < 3π/2. Within a particular group the calculated TDCS are normalized to each other, but the normalization between the groups is arbitrary. In (a) the phase angle is fixed, and the ratio between the ungerade and the gerade amplitudes increases from η = 0.15 to 0.25 in steps of 0.05. This has a dramatic effect on the central lobe, where the ungerade amplitude has its maximum. In (b) the amplitude ratio is fixed at η = 0.15 while the phase angle between the amplitudes (φ) is varied between its extreme values of π (full curve) and 3π/2 (broken curve). This changes the amount of interference between the amplitudes, resulting in two more nodes in the corresponding TDCS in the limit φ → π . The calculated distributions in (c) correspond to the same dynamic cases as in (b), but the energies of the detected electrons are interchanged. The (c) patterns correspond to the distributions of slower electrons, which show a profound change of the interference pattern. The pairs of dynamically linked TDCS from (b) and (c) share the same trace types. Their features are consistent with the conclusion made earlier that φ = 0 (π ) is the asymptotic limit in the highly asymmetric case of electron dynamics, as the location of the entire excess energy of the photon onto a single electron must also be associated with the largest asymmetry in the angular momentum transfer.
(γ , 2e) in He
4703
Armed with this new vocabulary provided by the present parametrization and the insight it gives into the particle dynamics, let us return to the comparison between the 40 eV data and the ab initio calculations. In figure 3(b) (see also figures 5 and 7 in I) it can be seen that the theory overestimates the ratio between the central and the side lobes, as well as the depths of the minima separating them. These features have already been discussed in I. Having established the link between the TDCS parameters and the classical motion of the charged particles in the three-body potential, it is tempting to conclude that the 3C, and (to a lesser extent) the CCC, calculations appear to place a stronger emphasis on the electron correlations in the external region of the interaction space where the energies of the two electrons appear more dissimilar. A similar conclusion has been reached by Lucey et al (1998), who argue that the theoretical approaches based on the features of the asymptotic solution cannot describe the full dynamics of the many-particle decay processes. While the CCC theory is not an asymptotic theory, practical limitations in the number of included states and their partial wave content could perhaps have a similar effect.
6. Discussion As mentioned earlier, there is only one other complete parametrization of the unequal energysharing TDCS, that by Soejima et al (1999) for E = 9 eV and R = 8, and for a highly circularly polarized source (|S3 | = 0.95, |S1 | = 0.2). Their parametrization formula differs from ours in two important aspects. Firstly, it is restricted to a particular geometry of their experiment (θ1 = ±π/4), which is, of course, included in our more general expression. Secondly, they use the amplitudes Mu,g of Malegat et al (1997a), which imposes the following relation between their phase angle parameter � and ours: φ = � ± π . In the process of testing our expression with their amplitude functions, which our 6P form parametrizes very well, we have recreated in figure 7(a) their TDCS fit (full curve) and its partial decomposition into the LD and CD parts (their figures 2(a) and 3(b), respectively). We confirmed their phase angle of � = 199◦ , corresponding to φ = ±19◦ which is incompatible with the range (π/2 < φ < 3π/2) which we have allocated to φ in the case of R > 1. Suspecting a non-uniqueness of the parameter determination in this particular case we have searched for (and found) another solution shown in figure 7(b), which requires φ = 144◦ (� = −36◦ ). While the cross section (full curve) in (a) and (b) seems almost unchanged, its decomposition according to (6) is very different, as can be seen on the circular- and linear-dichroism terms. If our solution was used to subtract the LD term from the measured spectra of Soejima et al (1999), the results in their figure 4 would change significantly. The spectrum (c) is obtained using our 3P parametrization model with = 85◦ , η = 0.175 and φ = 138◦ . Despite the radically different shape of the Gaussian form used for au in (c) from the almost flat distribution used in Soejima et al (their figure 3(a)), the resulting TDCS in figures 7(b) and (c) (full curve) appear rather similar. Furthermore, of the two common fitting parameters (η, φ) only φ has changed slightly. Note, though, that the common correlation width parameter used for the spectrum of figure 7(c) is the same as for the R = 1 case, while the g used in figures 7(a) and (b) has the smaller value of 76◦ . This example illustrates a small sensitivity of the measured cross section to the amplitude features in the ‘forward’ direction. In the work of Becker et al (1999) an approximate procedure leading to the extraction of ungerade and gerade transition amplitudes from the unequal energy-sharing measurements at E = 20 eV is reported. However, those amplitudes could not be directly compared with this paper as they contain unresolved contributions from the kinematic factors (see (3)) which dominate the angular distributions.
4704
S Cvejanovi´c and T J Reddish
0.6
0.6
0.6
(a)
(b)
(c)
0.4
0.4
0.4
0.2
0.2
0.2
0
0
0
0.2
0
90
180
270
360
0.2
0
90
180
270
360
0.2
0
90
180
270
360
mutual angle [deg.]
Figure 7. Fitting curves and their components for the cross section measured by Soejima et al (1999). TDCS—full curve; CD term—broken curve; LD term—dotted curve. (a) The amplitudes of Soejima et al as parametrized by our 6P model (see the text). (b) Alternative solution for � = −36 (φ = 144). (c) Our 3P parametrization with = 85◦ , φ = 138. The same ungerade/gerade amplitude ratio η = 0.175 was used throughout.
On the theoretical front, the pioneering work of Maulbetsch and Briggs (1993a, b, 1994) contains a systematic investigation of the electron dynamics in the helium TDCS. Despite its shortcomings, perhaps best revealed by a large gauge sensitivity, it still provides a major reference source, which has greatly inspired the present parametrization model. However, publications containing the dynamic amplitudes are very scarce. In the previously mentioned case of E = 53 eV and R ∼ 9, Maulbetsch and Briggs (1994) have given full details of the amplitudes g(1) and z = g(2)/g(1) in graphical form, from which all other amplitude representations can be derived. Schmidt (1998) has extracted the resulting gerade amplitude and found it to differ very little from the Gaussian form, mainly by showing a small additional forward (θ12 ∼ 0) yield. In more recent work using the CCC method, Kheifets and Bray (2000) present the first study of the square of the equal-sharing amplitude over the large energy range (3 < E < 80 eV). They reported that the fit with the Gaussian form ‘was found to be appropriate over the entire range, somewhat unexpected for the higher energies’. Most interestingly the calculated evolution of the correlation width parameter as a function of E shows a remarkable change at ∼20 eV, where the PDI cross section has its maximum. These ab initio methods have been supplemented by further developments of the Wannier theory, in particular the works of Kazansky and Ostrovsky. In Kazansky and Ostrovsky (1995b) a semiclassical wavepacket propagation method is used without restricting the initial conditions to the Wannier ridge. Their test function shows an evolution with E which is stronger than the one observed, but a much weaker dependence on energy sharing, which is more in line with the experiment. Note, though, that the calculated contribution coming from the ungerade component of the wavefunction is greatly underestimated. A refined version of the wavepacket propagation method has recently been developed by Malegat et al (1999). In it the semiclassical analysis in the outer region of the interaction space is combined with the R-matrix calculation in the inner. They have fitted the equal-energysharing TDCS with the Gaussian ansatz to extract the correlation factor over the investigated energy range (E � 20 eV), but the quality of the fit was found to deteriorate above E = 1 eV. Their scaling law for the correlation width has a reduced exponent with respect to Wannier’s value, which gives improved (though still not completely satisfactory) agreement with the experiments. The comparison of the calculated TDCS with selected experiments shows that
(γ , 2e) in He
4705
the calculated correlation width is too large, except for the lowest energy of E = 1 eV. However, the integration of their TDCSs over θ1 leads to an excellent energy dependence of the angular asymmetry parameter β. Apart from the work of Maulbetsch and Briggs (1994), the only other direct calculation of the correlation amplitude is published by Feagin (1995) within his extension of the Wannier theory to fourth order in the expansion over the internal coordinates. He has calculated amplitudes for equal energy sharing at 2 and 20 eV which resemble a Gaussian, but curiously do not show any dependence on excess energy. One should note though that the related mutual energy distributions calculated in this paper are unrealistically confined to a limited range of R around the equal energy sharing, in stark contrast to the experiment and other calculations. From the above examples one can conclude that the classical and semiclassical model calculations, while allowing a physical insight into the mechanisms by which the dynamics of the escaping electrons affects the TDCS, do not (as yet) provide their complete and quantitative description. Although most of the measured and calculated cross sections for the PDI of He conform with the present parametrization model, there are a few exceptions which deserve our closer attention. Several measurements have brought to light some peculiar (or even controversial) features which have aroused a lot of attention, especially in the theoretical community. Let us first mention the apparent inconsistency between the two sets of measurements at E = 20 eV using the COLTRIMS technique. In the measurement using circularly polarized light, the angular distributions of the slow electron for various energy-sharing ratios in Mergel et al (1998) are apparently inconsistent with the linear polarization data of Br¨auning et al (1998) for R ∼ 1/6 and 6, as well as with the CCC calculations (see Kheifets and Bray 1998b). This has also been convincingly exposed by Berakdar (1999), who used the cross section symmetry features on which our relation (6) is based. Soejima et al (1999) suggested the ignored linear polarization component of the light source as a possible cause, but other instrumental effects which could have affected one or both measurements cannot be excluded (the inconsistencies between the TDCS for the complementary choices of detected electron energies are discussed in Briggs and Schmidt (2000)). The present parametrization should provide a powerful tool for testing the experimental data for internal inconsistencies, alerting the experimentalists to unforeseen systematic errors which are more likely to occur with the increased use of sophisticated experimental methods. Another interesting feature at the excess energy of 14.5 eV and for a circularly polarized source has been reported by Viefhaus et al (1996). They have measured normalized circular dichroism (=CD/PI) for a sample of TDCS at fixed mutual angles and for the whole range of energy sharing, using the coincidence time-of-flight method. Irrespective of R the sign of CD changed between the adjacent detector positions corresponding to θ12 = 80 and 125◦ , in agreement with their 3C-type calculation. The change of the CD sign as a function of θ12 , R and E has already been observed in the 3C calculations by Berakdar et al (1993). Berakdar (1998) argues that the change of the CD sign is a signature of the important role of electron correlation, as the calculations which do not include the inter-electron interactions do not show the effect. While the change of the CD sign at intermediate θ12 angles seems to be confirmed by the CCC calculations of Kheifets and Bray (1998b) at the slightly larger energy of 20 eV, the corresponding 3C calculations of Mergel et al show it only in the length gauge, which is normally considered less accurate at these energies (see Maulbetsch and Briggs 1994). Let us see how these observations relate to the parametrization formula. We can see from (9) that the change of the CD sign requires the excursion of the phase angle across the φ = 0 − π line. Although there is no formal reason why this cannot happen as a function of θ12 , it seems unlikely that such changes could be related to electron correlation forces, as the
4706
S Cvejanovi´c and T J Reddish (a)
(b)
0.5
0.5
0
0
0.5
0.5 0
90
180
270
360
0
90
180
270
360
mutual angle [deg.] Figure 8. Circular dichroism term (full curve), normalized CD term (large dotted curve) and the polarization-insensitive term (broken curve). (a) Corresponds to the case of figure 7(b). (b) From the 3P model used in 7(c).
(a)
(b)
(c)
Figure 9. (a) Separate 3P parametrizations closely approximating the results of Qiu and Burgd¨orfer for E = 0.2 eV and R ∼ 0 (dotted curve); R ∼ ∞ (full curve). (b) The 3P TDCS for R ∼ ∞ complementary to the R ∼ 0 result in (a). (c) The same as in (b) but for the following parameters:
= 25◦ , η = 0.008 and φ = π . For the parameters used in (a), (b) see the text.
0 − π line is associated with one of the dynamic limits (see figure 1 and related discussion). Our amplitude model, whose basic feature is the separation of the angular correlation between the electrons (the θ12 dependence) from the phases of the symmetrized amplitudes, has no allowance for this effect. The same applies to the model of Soejima et al (1999). This is illustrated in figure 8 where the curves corresponding to the models described in figures 7(b) and (c) are compared. Observe, though, the astonishing difference between the normalized CD terms in those two cases, while the related simulated TDCS in figure 7 appear rather similar. This shows that the presentation of circular dichroism in terms of the normalized CD is extremely sensitive to the small signal variations in the region of small mutual angles, where unfortunately the accuracy of the extracted data is usually poor. Indeed the reported error bars in Viefhaus et al (1996) for the θ12 = 80◦ measurement are high enough to leave room for a different interpretation. Similar levels of uncertainties characterize the related measurements of Soejima et al (1999) and Mergel et al (1998) at the θ12 angles smaller than 90◦ . We must consequently await further and more accurate experimental and theoretical work before this extremely interesting observation of the CD sign change is confirmed. Lastly, let us turn our attention to the near-threshold calculations of Qiu and Burgd¨orfer (1999), who derive the helium angular distributions by exploiting the approximate dynamic symmetry of the ionization process. This method is closely related to the work of Herrick (1975) for the doubly excited resonant states. Their calculations for θ1 = 0 and full linear
(γ , 2e) in He
4707
polarization at the excess energy of 4 eV and R = 1, ∼5 and ∼1/5 are in very good agreement with the measurements of Lablanquie et al (1995), by showing almost no dependence on R and a node at θ12 = π , which is consistent with a disappearance of the ungerade amplitude. The lobe position angles for the equal energy-sharing case quoted in Qiu and Burgd¨orfer can easily be associated with the correlation widths by using (1), leading to = 72◦ , which is in excellent agreement with the independent measurements of Malegat et al (1997b). Qiu and Burgd¨orfer also calculated the TDCS at 0.2 eV, but the equal sharing TDCS leads to = 31◦ , which is much smaller than the recent measurement ( = 60 ± 4◦ ) of Huetz and Mazeau (2000) and the calculated value (∼52◦ ) of Malegat et al (1999). Even more interesting are their pioneering results for the extremely asymmetric energy-sharing case at E = 0.2 eV, obtained by choosing either E2 or E1 to be 10−6 eV, corresponding to R ∼ 0 or ∞, respectively. In the R ∼ 0 case there is clear evidence of the ungerade amplitude, as the node at θ12 = π disappears. Even more surprisingly the complementary TDCS for the fast electron (R ∼ ∞) shows a single narrow peak at this angle. Those features of the unequal energy-sharing TDCS at E = 0.2 eV are clearly in disagreement with the Wannier model predictions and the use of Gaussian ansatz which derives from them. Furthermore they appear to be in contradiction with the basic symmetry of the double ionization process, as we will demonstrate by using the 3P parametrization. In figure 9(a) we have reproduced closely the TDCS of Qiu and Burgd¨orfer with two separate model curves. The R ∼ 0 TDCS (dotted curve) is represented by = 24◦ , η = 0.0065 and φ = ±70◦ . Observe the reduction of the correlation width from the R = 1 case. For R ∼ ∞ (full curve), φ changes to ±250◦ . However, in order to remove the side lobes we had to increase η by a factor of at least 4. This is clearly in breach of relation (5) which requires η to be unchanged for the complementary choices of detected electrons. In figure 9(b) we have shown how the distribution of the fast electron should have looked if the complementary distribution for the slow one had been calculated (and parametrized) accurately, by using the same η as for R ∼ 0. The precise relation between the central lobe and the side lobes is a sensitive function of fitting parameters, as shown by the extreme example in figure 9(c), but in no circumstances can both shapes shown in (a) be reproduced by a consistent choice of parameters. This indicates that either the method of Qiu and Burgd¨orfer (1999) is unsuitable for very small energies or the present results for the unequal energy sharing at E = 0.2 eV are in error. 7. Summary In this paper a parametrization formula for the TDCS in He is developed which contains analytic forms for the symmetrized transition amplitudes of Huetz et al (1991, 1994) and a small number of free parameters. The extensive tests on the results of measurements at 40 eV (reference I) and on other experimental and theoretical examples at smaller energies have shown that the simplest form (3P) with just three free parameters for each E and R is sufficient to summarize the data for an arbitrary choice of other experimental variables. The increase of the number of fitting parameters to six can find its use when comparing different calculations or in treating the data at higher excess energies or electron energy asymmetries, providing the measuring accuracy at small mutual angles is adequate. For all other cases the 3P parametrization should be tested first and the 4P, which allows for the differences in the angular dependences between the amplitudes of different symmetry, applied next. This approach minimizes the risk of non-uniqueness of the extracted parameter set. Our interpretation in terms of a close connection between the amplitude parameters and the classical interactions between the escaping particles implicitly contains the requirement that the parameters interpolate smoothly between the dynamical limits discussed with reference
4708
S Cvejanovi´c and T J Reddish
to figure 1. Almost all analysed examples confirm this, the CD sign change (though only at small θ12 angles) being an exception. The identification of a small number of parameters, some of which bear clear signature of the electron dynamics in the escape process, opens up a possibility that the energies of the escaping electrons (just two numbers) can in turn be used to express some or all of the remaining parameters now describing the transition amplitudes, i.e. to identify their dynamic content. It is by no means certain that this can be done within the framework of the model developed in this paper, but we would like the researchers in the field to accept that challenge, as a potential reward is in our view not only pragmatic—the arrival at the compact parametrization of the TDCS for any conditions of electron dynamics, kinematics and the polarization state of the absorbed photons—but also a cognitive one. Testing dynamical models in this fundamental process might extend further our physical understanding of the subtle interplay between the quantum and classical calculation procedures, building on the work of Wannier and its many followers in the field of threshold break-up processes. This could be achieved if a large and versatile collection of experiments is analysed in a consistent way, or some accurate model predictions made. At present, only the data on (E) approach the fulfilment of that requirement. Acknowledgments We acknowledge the continuing support of the EPSRC for this work. SC would like to thank the Leverhulme Trust for a generous Fellowship. Many stimulating discussions with Alain Huetz, Akira Yagishita and Fritz Maulbetsch (who also provided the 3C cross section data in numerical form) are gratefully acknowledged. References Becker U, Pr¨umper G, Langer B, Viefhaus J, Wiedenh¨oft M, Levin J C and Sellin I A 1999 Aust. J. Phys. 52 351–61 Berakdar J 1998 J. Phys. B: At. Mol. Opt. Phys. 31 3167–80 ——1999 J. Phys. B: At. Mol. Opt. Phys. 32 L27–33 Berakdar J, Klar H, Huetz A and Selles P 1993 J. Phys. B: At. Mol. Opt. Phys. 32 1463–78 Br¨auning H et al 1998 J. Phys. B: At. Mol. Opt. Phys. 31 5149–60 Briggs J S and Schmidt V 2000 J. Phys. B: At. Mol. Opt. Phys. 33 R1–48 Cvejanovi´c S, Wightman J P, Reddish T J, Maulbetsch F, MacDonald M A, Kheifets A S and Bray I 2000 J. Phys. B: At. Mol. Opt. Phys. 33 265–83 Dawber G, Avaldi L, McConkey A G, Rojas H, MacDonald M A and King G C 1995 J. Phys. B: At. Mol. Opt. Phys. 28 L271–7 D¨orner R et al 1998 Phys. Rev. A 57 1074–90 Feagin J M 1995 J. Phys. B: At. Mol. Opt. Phys. 28 1491–516 Greene C H and Rau A R P 1983 J. Phys. B: At. Mol. Phys. 16 99–106 Herrick D R 1975 Phys. Rev. A 12 413 Huetz A and Mazeau J 2000 Phys. Rev. Lett. 85 530–3 Huetz A, Lablanquie P, Andric L, Selles P and Mazeau J 1994 J. Phys. B: At. Mol. Opt. Phys. 27 L13–8 Huetz A, Selles P, Waymel D and Mazeau J 1991 J. Phys. B: At. Mol. Opt. Phys. 24 191–33 Kazansky A K and Ostrovsky V N 1993 J. Phys. B: At. Mol. Opt. Phys. 26 2231–44 ——1994 J. Phys. B: At. Mol. Opt. Phys. 27 447–64 ——1995a J. Phys. B: At. Mol. Opt. Phys. 28 1453–62 ——1995b Phys. Rev. A 51 3698–702 Kheifets A S and Bray I 1998a J. Phys. B: At. Mol. Opt. Phys. 31 L447–53 ——1998b Phys. Rev. Lett. 81 4588–91 ——2000 Phys. Rev. A 62 Lablanquie P, Mazeau J, Andric L, Selles P and Huetz A 1995 Phys. Rev. Lett. 74 2192–5 Lucey S P, Rasch J, Whelan C T and Walters H R J 1998 J. Phys. B: At. Mol. Opt. Phys. 31 1237–58 Malegat L, Selles P and Huetz A 1997a J. Phys. B: At. Mol. Opt. Phys. 30 251–61
(γ , 2e) in He
4709
Malegat L, Selles P and Kazansky 1999 Phys. Rev. A 60 3667–75 Malegat L, Selles P, Lablanquie P, Mazeau J and Huetz A 1997b J. Phys. B: At. Mol. Opt. Phys. 30 263–76 Maulbetsch F and Briggs J S 1993a J. Phys. B: At. Mol. Opt. Phys. 26 1679–96 ——1993b J. Phys. B: At. Mol. Opt. Phys. 26 L647–52 ——1994 J. Phys. B: At. Mol. Opt. Phys. 27 4095–104 ——1995 J. Phys. B: At. Mol. Opt. Phys. 28 551–64 Mergel V et al 1998 Phys. Rev. Lett. 70 5301–4 Pindzola M S and Robicheaux F J 2000 Phys. Rev. A 61 052707 Pont M and Shakeshaft R 1995 Phys. Rev. A 51 R2676–9 Pont M, Shakeshaft R, Maulbetsch F and Briggs J S 1996 Phys. Rev. A 53 3671–4 Qiu Y and Burgd¨orfer J 1999 Phys. Rev. A 59 2738–43 Rau A R P 1971 Phys. Rev. A 4 207–20 ——1976 J. Phys. B: At. Mol. Phys. 9 L283–8 Read F H 1985 Electron Impact Ionization ed T D M¨ark and G H Dunn (New York: Springer) p 42 Rescigno T M, Baertschy M, Isaacs W A and McCurdy C W 1999 Science 286 (5449) 2474–9 Schaphorst S J, Kr¨assig B, Schwarzkopf O, Sherer N, Schmidt V, Lablanquie P, Andric L, Mazeau J and Huetz A 1995 J. Electron Spectrosc. 76 229–35 Schmidt V 1997 Electron Spectrometry of Atoms using Synchrotron Radiation (Cambridge: Cambridge University Press) ——1998 Photonic, Electronic and Atomic Collisions ed F Aumayr and H Winter (Singapore: World Scientific) pp 85–96 Schwarzkopf O, Kr¨assig B, Elmiger J and Schmidt V 1993 Phys. Rev. Lett. 70 3008–11 Schwarzkopf O, Kr¨assig B, Schmidt V, Maulbetsch F and Briggs J S 1994 J. Phys. B: At. Mol. Opt. Phys. 27 L347–50 Schwarzkopf O and Schmidt V 1995 J. Phys. B: At. Mol. Opt. Phys. 28 2847–62 Soejima K, Danjo A, Okuno K and Yagishita A 1999 Phys. Rev. Lett. 83 1546–9 Viefhaus J et al 1996b Phys. Rev. Lett. 77 3975 Wannier G H 1953 Phys. Rev. 90 817–25 Wightman J P, Cvejanovi´c S and Reddish T J 1998 J. Phys. B: At. Mol. Opt. Phys. 31 1753–64