movements was: (i) standing for 30 s, (ii) sitting on a lounge chair for 30 s, (iii) standing for 10 s, then walking at a comfortable pace along a flat straight 40 m long ...
DETERMINING ACTIVITY USING A TRIAXIAL ACCELEROMETER M. J. Mathie1, N. H. Lovell2, A. C. F. Coster1, B.G. Celler1 1
School of Electrical Engineering and Telecommunications, University of New South Wales, Australia 2 Graduate School of Biomedical Engineering, University of New South Wales, Australia
Keywords - triaxial accelerometer, energy, activity identification, ambulation
I.
INTRODUCTION In order to use a triaxial accelerometer (TA) for unsupervised home monitoring it is necessary to be able to identify key activities and events from the TA signal. There are four primary steps involved in this, namely (i) separation of activity and resting states, (ii) identification and classification of the activity, (iii) extraction of relevant parameters, and (iv) taking any appropriate action. A number of researchers have described the classification of certain activities and rest periods using accelerometry [1,2] Our instrumentation consisted of a single waist-mounted unit that was specifically designed for convenient, unsupervised use by the housebound elderly. In this study we investigated the first of the above steps, distinguishing between rest and activity using this device. II.
METHODOLOGY
A. The Triaxial Accelerometer (TA) Device The TA consisted of two orthogonally mounted bi-axial piezo-resistive ADXL210 devices enclosed in a small pager casing which was designed to be worn on a waist belt. These measure acceleration due to gravity and acceleration due to body movement. Telemetry was used to transmit the data from the TA device to a receiver unit that was connected to a personal computer where the data was stored. Data was collected at 45 Hz [3, 4]. B. Experimental Procedure A laboratory experiment was conducted in which 26 normal, healthy volunteers (7 female, 19 male; age 30.5+6.3 years) performed a sequence of routine movements in a controlled laboratory setting while wearing the TA. The testing procedure was the same for all subjects. The subject was told to attach the TA at the waist, above the right superior anterior iliac spine. Each subject carried out 11 discrete dynamic activities, being sit-to-stand, stand-to-sit and walking and 12 distinct rest periods, standing and sitting. The sequence of movements was: (i) standing for 30 s, (ii) sitting on a lounge chair for 30 s, (iii) standing for 10 s, then walking at a comfortable pace along a flat straight 40 m long corridor and then returning and standing again for 10 s, (iv) sitting on an office chair for 30 s, (v) standing for 10 s, then walking up, then down a flight of stairs, and then standing again for 10 s, (vi) sitting on the office chair for 30 s then standing again for 10 s, (vii) steps (iii) and (ii) were repeated.
The subject was directed through the procedure by an investigator who timed each activity segment using a stopwatch. Every data sample was time stamped so that each activity could be identified on the resultant signal trace. C. Data Analysis Several different approaches can be taken to identifying periods of movement. The simplest is to look at the magnitude of the signal but this is insensitive to slow movements and susceptible to noise spikes. Another approach is to use an indicator of metabolic energy expenditure. The energy expenditure is related to the acceleration signal, with 89% correlation, by (1) Energy Expenditur e = αIA = α x 2 + y 2 + z 2
(∫
∫
∫
)
where α is a constant of proportionality, and IA is referred to as the integral area [5]. Each of the three signals from the TA was passed through a median filter to remove noise spikes. Each signal was then passed through a high pass filter (finite impulse response filter with cutoff frequency at 0.25 Hz) to remove the static (gravitational) component from the signal. A non-overlapping moving window was applied to the signal, and IA calculated for each window. The energy contained in each window was then compared to a threshold value. If IA was greater than the threshold, the window was determined to contain dynamic activity. Thirteen of the subjects were randomly selected (control group). These TA signals were used to investigate the effectiveness of this method for different parameter selections. Three parameters were investigated: (i) the length of the median filter, f, (ii) the width of the window, w, and (iii) the IA threshold value, th. Each of these parameters was expected to have an effect on the system. th was a normalised value corresponding to the IA contained in one sample period. The threshold comparison used was thus IA > (th . w). The sensitivity and specificity of the identification were measured using each combination of these parameters using Receiver Operating Characteristic (ROC) curves. The optimal parameters were determined. The system, using the optimal parameters, was tested on the remaining 13 subjects (test group), and the sensitivity and specificity of the system were determined.
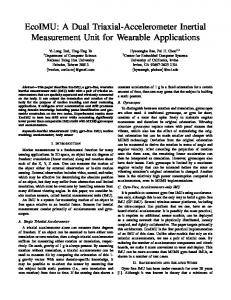
2 acceleration (g.m.s-2 )
Abstract-Triaxial accelerometers have been employed to monitor human movements in a variety of circumstances. It is necessary, however, to be able to extract useful information from the acceleration measurements. We show that we can, in a controlled environment, use an energy expenditure method to identify and separate dynamic activities, including changes in posture and ambulation.
walking standing
1.5 1 0.5
sitting 0
0
50
100
150 200 time (s)
250
300
Figure 1: vertical axis signal from a subject performing part of the test sequence
1 13,15
RESULTS
True Positive Rate
III.
Filter lengths from f=3 to 15 samples, window widths from w=0.2 to 4.0 s and thresholds from th=0 to 20x10-3 were tested. Optimal values were f=13, w=0.8, th=3.5x10⁻³ These parameters led to a sensitivity of 1.0 and a specificity of 0.96 in the control group. In the test group, these parameters resulted in a sensitivity of 0.99 and a specificity of 0.94. Using a threshold of th=3.0 or th=3.5 ensured that sensitivity > 0.93 and specificity < 0.14 regardless of the choice of f when w took any value between 0.2 and 2.0 s. The sensitivity of the system decreased when w increased above 2.0 s. The system was most effective when the extreme values for f (3, 5, 13 and 15) were used. Figure 2 shows the effect of each of the three parameters.
CONCLUSION
We have shown that it is possible to identify dynamic activities in a triaxial accelerometer monitoring experiment using a signal energy thresholding approach, for the case of controlled movements. It was found that there were three basic parameters of interest, the length of the median filter, f, the width of the window, w, and the IA threshold value, th. It is the Table 1. Variation in Sensitivity and Specificity due to variation in each parameter, f, w, and th. Sensitivity range Specificity range
f 0.04 0.08
w 0.06 0.23
th 0.96 0.90
0.96
9
0.94
values indicate f in samples 0
True Positive Rate
1
IV.
V.
7
0.05
0.1
0.15
0.2
(a)
0.4
(b)
False Positive Rate 1.2 2.6
0.98
1.0 0.6 2.2 2.4
0.4 0.2
2.8
0.96
3.2 3.4 3.8 4.0
0.94
values indicate w in s
0.92 0
0.1
0.2
0.3
False Positive Rate 1
True Positive Rate
DISCUSSION In detecting dynamic activity, a high sensitivity is more important than a high specificity, because it is important to detect all significant movements. If a non-significant movement is detected as dynamic activity, there is opportunity in the later processing to correct this. At this stage of processing, the aim is to detect all dynamic activity, regardless of whether the movement is a postural transition, ambulation, a fall or some other movement. Once the movement has been identified as such it can then be classified by type. The choice of window is important. The wide variance in the time taken to undertake an activity (for example, a sit-tostand transition may vary from 1 to over 3 s in healthy subjects [6]) means that it is not possible to obtain a window that is matched to the width of the activities. Using a window width that is shorter than the shortest expected activity means that in the worst case, when a dynamic activity is reached, at least half of the window will contain dynamic activity. Using still shorter windows, or overlapping windows, will increase this proportion, and hence the detection rates. If the window width is too short, the system becomes more susceptible to false positives. Once a dynamic activity is detected, an algorithm needs to be executed to determine the end points of the activity, but this eliminates the need for matched width windows. When the system is working optimally, it should detect a period of static activity followed by a period of dynamic activity, followed by another period of rest, and so on. When th is very low, the system is hypersensitive and the entire signal is determined to be dynamic activity. This means that the system only resolves one period of activity. When th is very large, no parts of the signal are detected as dynamic activity. It was found that the system was more sensitive to the choice of th than to the choice of f or w as Table 1 shows.
3,5 11
0.98
0.5
3.0 6.0 2.0 7.0 0.0 9.0 10.0
15.0 0 20 0
1.5
1.0
0.5
values indicate th x 1000 0.5
1
(c)
False Positive Rate
Figure 2: ROC charts showing the effect of (a) window width, w with f=3 and th=3.0, (b) median filter length, f, with w=1 and th=3.0, (c) threshold, th, with f=3 and w=1.0 last of these that is the most sensitive for the tuning of the analysis. Upon tuning these parameters using a training subset of our measurements, it was found that a sensitivity of 0.99 and a specificity of 0.94 was measured in the test group. This shows the robustness of the technique for separation of the activities in the case of controlled movements. Future work will involve testing the system on data collected from free-living subjects in a home environment. VI.
REFERENCES
[1] P. H. Veltink, E. G. O. Engberink, B. J. Van Hilten, R. Dunnewold, and C. Jacobi, "Detection of static and dynamic activities using uniaxial accelerometers," IEEE Trans Rehab Eng, vol. 4, pp. 375-385, 1995. [2] K. Aminian, P. Robert, E. E. Buchser, B. Rutschmann, D. Hayoz, and M. Depairon, "Physical activity monitoring based on accelerometry: validation and comparison with video observation," Med & Biol Eng & Comp, vol. 37, pp. 304-308, 1999. [3] B. G. Celler, N. H. Lovell, M. Mathie, J. Basilakis, R. Salleh, and F. Magrabi, "Ambulatory monitoring and real time diagnosis of clinical data," HIC 2000 Integrating Information for Health Care, Adelaide, 2000. [4] M. Mathie, J. Basilakis, and B. G. Celler, "A system for monitoring posture and physical activity using accelerometers," 23rd Annual International Conference of the IEEE EMBS, Istanbul, Turkey, 2001. [5] C. V. C. Bouten, K. T. M. Koekkoek, M. Verduin, R. Kodde, and J. D. Janssen, "A triaxial accelerometer and portable data processing unit for the assessment of daily physical activity," IEEE Trans Biomed Eng, vol. 44, pp. 136-147, 1997. [6] K. M. Kerr, J. A. White, D. A. Barr and R. A. B. Mollan, "Analysis of the sit-stand-sit movement cycle in normal subjects," Clin Biomech, vol. 12, pp. 236-245, 1997.