Sep 13, 2018 - effects of chlorogenic acid, a major phenolic acid in coffee, and ... Key words: chlorogenic acid, epigallocatechin gallate, epidermal.
INTERNATIONAL JOURNAL OF MOLECULAR MEDICINE
(-)-Epigallocatechin gallate but not chlorogenic acid suppresses EGF-stimulated migration of osteoblasts via attenuation of p38 MAPK activity TETSU KAWABATA1,2, TAKANOBU OTSUKA1, KAZUHIKO FUJITA1,2, GO SAKAI1,2, RIE MATSUSHIMA‑NISHIWAKI2, OSAMU KOZAWA2 and HARUHIKO TOKUDA2,3 1
Department of Orthopedic Surgery, Nagoya City University Graduate School of Medical Sciences, Nagoya, Aichi 467‑8601; 2Department of Pharmacology, Gifu University Graduate School of Medicine, Gifu 501‑1194; 3 Department of Clinical Laboratory, National Center for Geriatrics and Gerontology, Obu, Aichi 474‑8511, Japan Received July 21, 2017; Accepted September 13, 2018 DOI: 10.3892/ijmm.2018.3884 Abstract. Phenolic compounds provide health benefits in humans. A previous study by our group has indicated that the epidermal growth factor (EGF)‑induced migration of osteo‑ blast‑like MC3T3‑E1 cells is mediated by the phosphorylation of p44/p42 mitogen‑activated protein (MAPK), p38 MAPK, stress‑activated protein kinase (SAPK)/c‑Jun N‑terminal kinase (JNK) and Akt, and that resveratrol, a major polyphenol in grape skin, suppresses the EGF‑induced migration by atten‑ uating Akt and SAPK/JNK activation. In the present study, the effects of chlorogenic acid, a major phenolic acid in coffee, and (‑)‑epigallocatechin gallate (EGCG), a major flavonoid in green tea, on the EGF‑induced migration of MC3T3‑E1 cells were investigated. EGCG significantly reduced the EGF‑induced migration as evaluated by a Transwell migration assay and by a wound healing assay. However, chlorogenic acid failed to affect the EGF‑induced migration. The phosphorylation of p38 MAPK induced by EGF was significantly suppressed by EGCG; however, the EGF‑induced phosphorylation of p44/p42 MAP kinase, SAPK/JNK or Akt was not affected by EGCG. These results suggest that EGCG, but not chlorogenic acid, suppresses EGF‑induced osteoblast migration through inhibiting p38 MAPK activation. Introduction Bone metabolism is rigorously controlled by two different func‑ tional cell types‑osteoblasts and osteoclasts (1,2). Osteoblasts
Correspondence to: Professor Osamu Kozawa, Department of
Pharmacology, Gifu University Graduate School of Medicine, 1‑1 Yanagido, Gifu 501‑1194, Japan E‑mail: okozawa@gifu‑u.ac.jp
Key words: chlorogenic acid, epigallocatechin gallate, epidermal growth factor, migration, osteoblast, p38 mitogen‑activated protein kinase
are responsible for bone formation and osteoclasts for bone resorption. Bone tissue continues to regenerate in a process known as ‘bone remodeling’. The process of bone remodeling starts with osteoclastic bone resorption and osteoblasts subse‑ quently migrate to the sites resorbed by osteoclasts, resulting in the stimulation of bone formation. The orchestrated coupling of osteoblasts and osteoclasts maintains the appropriate bone mass. Metabolic bone diseases, including osteoporosis, are caused by the impairment of bone remodeling. Accumulating evidence indicates that osteoblast migration is pivotal for numerous processes in physiological bone metabolism, including responses to mechanical loading (1,3,4). In addition, it has been indicated that osteoblast migration is essential for processes associated with pathological conditions of the bone, including tumor metastasis and the repair of bone frac‑ ture (5). It is widely recognized that various humoral factors, including epidermal growth factor (EGF), have important roles in bone metabolism (3,4,6). As for the effects of EGF on osteoblasts, EGF reportedly stimulates their proliferation but suppresses their differentiation (7‑10). In addition, it has been indicated that EGF enhances osteoblast migration (11). The migration of mesenchymal progenitors was reported to be mediated via phosphatidylinositol‑3 kinase (PI3K)/Akt and p38 mitogen‑activated protein kinase (MAPK) through the EGF receptor, which is activated by an EGF ligand released from osteoblasts (12). Regarding the intracellular signaling associated with the EGF‑induced migration of osteoblasts, a recent study by our group suggested that p44/p42 MAPK, p38 MAPK, stress‑activated protein kinase (SAPK)/c‑Jun N‑terminal kinase (JNK) and Akt function as positive regula‑ tors in osteoblast‑like MC3T3‑E1 cells (13). It is generally established that natural polyphenols contained in beverages and foods are beneficial for human health through exerting anti‑oxidative, anti‑inflammatory and anti‑tumor effects (14,15). Regarding the effects of natural polyphenolic compounds, several epidemiological studies indicate that chlorogenic acid, a major phenolic compound in coffee, and (‑)‑epigallocatechin gallate (EGCG), a major polyphenol in green tea, has beneficial properties on human health (16‑18). As for the potential benefit on bone tissue, it
2
KAWABATA et al: EGCG SUPPRESSES EGF‑STIMULATED OSTEOBLAST MIGRATION
is known that green tea consumption in elderly individuals leads to an increase of bone mass, improves the bone mineral density and decreases the risk of fracture (19). Chlorogenic acid has been reported to cause an increase of mineraliza‑ tion in rat tibia and improves the mechanical properties of the femoral diaphysis (20). In addition, it has been indicated that chlorogenic acid suppresses osteoclastic bone resorp‑ tion due to downregulation of receptor activator of nuclear factor‑κ B‑ligand and its downstream effects (21). However, EGCG was reported to promote osteoblastic bone formation and inhibit osteoclastic bone resorption (19,22). However, the mechanisms underlying the effects of chlorogenic acid or EGCG on bone metabolism remain to be clarified. In the present study, it was investigated whether chloro‑ genic acid or EGCG affect the EGF induced‑migration of osteoblast‑like MC3T3‑E1 cells. It was demonstrated that not chlorogenic acid but EGCG reduces the EGF‑induced migra‑ tion of osteoblasts through the suppression of p38 MAPK. Materials and methods Materials. Chlorogenic acid and EGCG were obtained from Sigma‑Aldrich (Merck KGaA, Darmstadt, Germany). EGF was purchased from R&D Systems, Inc. (Minneapolis, MN, USA). Antibodies to phosphorylated p38 MAPK (cat. no. 4511), p38 MAPK (cat. no. 9212), phosphorylated p44/p42 MAPK (cat. no. 9101), p44/p42 MAPK (cat. no. 9102), phosphorylated SAPK/JNK (cat. no. 9251), SAPK/JNK (cat. no. 9252), phos‑ phorylated Akt (cat. no. 9275) and Akt (cat. no. 9272) were purchased from Cell Signaling Technology, Inc. (Beverly, MA, USA). GAPDH antibodies (cat. no. sc‑25778) were obtained from Santa Cruz Biotechnology, Inc. (Dallas, TX, USA). An ECL Western blotting detection system (cat. no. RPN2108) was obtained from GE Healthcare UK Ltd. (Little Chalfont, UK). Chlorogenic acid was dissolved in ethanol and EGCG was dissolved in dimethyl sulfoxide to prepare stock solutions. The maximum concentration of dimethyl sulfoxide or ethanol during incubations was 0.1%, which did not affect the cell migration assay or the western blot analysis. Cell culture. Cloned osteoblast‑like MC3T3‑E1 cells that have been derived from newborn mouse calvaria (23) were provided by Dr Masayoshi Kumegawa (Meikai University, Sakado, Japan), and maintained as previously described (24). In brief, the cells were cultured in α‑minimum essential medium (α‑MEM) obtained from Sigma‑Aldrich (Merck KGaA) containing 10% fetal bovine serum (FBS) obtained from Gibco (Thermo Fisher Scientific, Inc., Waltham, MA, USA) at 37˚C in a humidified atmosphere of 5% CO2/95% air. The cells were seeded into 90‑mm diameter dishes (2x10⁵ cells/dish) in α‑MEM containing 10% FBS. After 5 days, the medium was replaced with α‑MEM containing 0.3% FBS. After 48 h, the cells were subjected to western blot analysis initiated by the EGCG pretreatment. For the cell migration assay, the cells cultured in α‑MEM containing 10% FBS for 3 days were sub‑cultured in α‑MEM containing 0.3% FBS for 6 h, and were then used for the experiments. Cell migration assay. A Transwell cell migration assay was performed as described previously (25) using Boyden cham‑
bers (polycarbonate membrane with 8‑µm pores; Transwell®; Corning Costar Corp., Cambridge, MA, USA). In brief, the cultured cells were trypsinized and seeded onto the upper chamber at 1x10⁵ cells/well in α‑MEM containing 0.3% FBS. EGF (10 ng/ml) was added to the lower chamber in α‑MEM containing 0.3% FBS and the cells were incubated for 16 h at 37˚C. Subsequently, the cells on the upper surface of the membrane were mechanically removed. The migrated cells adherent to the lower side of the membrane were fixed with 4% paraformaldehyde for 10 min at room temperature, and stained with 1:1,000 of DAPI solution (Wako Pure Chemical Industries, Ltd., Osaka, Japan) with 0.1% bovine serum albumin in phosphate buffered saline for 10 min at room temperature. Images of the migrated cells were captured under the fluores‑ cent microscope (BZ‑9000; Keyence Co., Ltd., Tokyo, Japan) at a magnification of x20 and the cells were quantified by counting the stained cells in three randomly chosen fields. When indicated, the cells were pre‑treated with chlorogenic acid or EGCG for 60 min at 37˚C. For the wound‑healing assay, the cultured cells were seeded at 1x10⁵ cells/well into an Ibidi Culture‑Insert 2 Well (Ibidi, Martinsried, Germany) with a 500‑µm margin from the side of the well and allowed to grow for 24 h. After the culture insert had been removed, the cells were stimulated with 30 ng/ml EGF for 8 h. Images of the cells were captured using an EOS Kiss X4 digital camera (Canon, Tokyo, Japan) connected to a CK40 culture microscope (Olympus Optical Co. Ltd., Tokyo, Japan) prior to EGF stimulation and after 8 h. The area into which the cells migrated was measured using ImageJ software (version 1.48; National Institutes of Health, Bethesda, MD, USA). Western blot analysis. The cultured cells were pre‑treated with various doses of EGCG for 60 min and then stimulated with either 50 ng/ml EGF or vehicle in 1 ml α‑MEM containing 0.3% FBS for the indicated durations. The cells were then lysed, homogenized and sonicated in a lysis buffer containing 62.5 mM Tris/HCl, pH 6.8, 2% SDS, 50 mM dithiothreitol and 10% glycerol. SDS‑PAGE was performed by the method of Laemmli (26) in 10% polyacrylamide gels. The protein was fractionated and transferred onto an Immun‑Blot polyvinyli‑ dene difluoride membrane (Bio‑Rad Laboratories, Hercules, CA, USA). The membranes were blocked with 5% fat‑free dry milk in Tris‑buffered saline‑Tween‑20 (TBS‑T; 20 mM Tris/HCl, pH 7.6, 137 mM NaCl, 0.1% Tween 20) for 1 h prior to incubation with the primary antibodies. Western blot analysis was performed as described previously (27) using antibodies to phosphorylated p38 MAPK, p38 MAPK, phosphorylated p44/p42 MAPK, p44/p42 MAPK, phosphorylated SAPK/JNK, SAPK/JNK, phosphorylated Akt, Akt and GAPDH as primary antibodies and peroxidase‑labeled antibodies raised in goat against rabbit immunoglobulin G (cat. no. 5110‑0336; KPL Inc., Gaithersburg, MD, USA) as secondary antibodies. The primary and secondary antibodies were diluted at 1:1,000 with 5% fat‑free dry milk in TBS‑T, and incubated for 24 h at 4 ˚C and for 60 min at room temperature, respectively. The peroxidase activity on the polyvinylidene difluoride sheet was visualized by means of the ECL western blotting detection system and images were captured on X‑ray film (Fujifilm, Tokyo, Japan). Densitometric analysis was performed using
INTERNATIONAL JOURNAL OF MOLECULAR MEDICINE
3
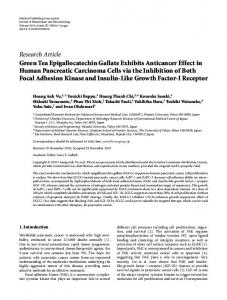
Figure 1. Effect of chlorogenic acid on the EGF‑induced migration of MC3T3‑E1 cells. The cell migration was examined by a Transwell assay. The cells were pre‑treated with various doses of chlorogenic acid for 60 min and then stimulated by 10 ng/ml of EGF or vehicle for 16 h. The migrated cells were fixed with paraformaldehyde and the nuclei were stained with DAPI (blue signal). Images of the migrated cells were captured by fluorescent microscopy at a magnification of x20 and the number of cells in each field was counted. Representative images and the histogram displaying the numbers of migrated cells in each group are presented. Values are expressed as the mean ± standard error of the mean of triplicate determinations from three independent cell preparations. *P