Polder Dutch: Aspects of the /Ei/-lowering in Standard Dutch Irene Jacobi, Louis C.W. Pols and Jan Stroop Amsterdam Center for Language and Communication, University of Amsterdam, Netherlands
[email protected]
Abstract This paper is an initial report on the systematic analysis of changes within the vowel system of Standard Dutch. The work focuses on the recent lowering of the diphthong /Ei/, known as ‘Polder Dutch’ (Poldernederlands). The purpose was to find an automatizable method to reliably analyze and compare speakers of a large corpus of Dutch spontaneous speech. Diphthong variants of twelve native speakers were compared by measuring both formants and spectral energy distributions. The resulting pc1-pc2 plane of a principal component analysis (PCA) on the barkfiltered spectrum of anchor vowels /a/, /i/, /u/ was comparable to the F1-F2 bark plane of the same segments and explained 90% of the variance in the data. The differences between the speakers’ vowel spaces appeared not to depend on sex, so male and female data could be calculated within the same analysis. The distance of the diphthong /Ei/ to the anchor vowels in the pc1-pc2 plane, together with the dipthong dynamics were the major cues to diphthong quality. Further indication of a sound change in progress for the ‘Polder Dutch’ speakers was the position of /E/ in the vowel space.
1. Introduction Cognates of the Dutch /Ei/ (orthographically or ) in the neighbouring languages English and German are fully open /aI/ diphthongs (comp. English and German vs. Dutch ); however, a look to the middle ages reveals these all developed from long /i/ (e.g., see the English Great Vowel Shift [5]). Since the late 1990s, speakers of a new, geographically unbound variant of Dutch have been recognized, sharing as their most salient attribute an [aI]-like quality of the diphthong /Ei/. Back then, most of these ‘Polder Dutch’ [14] speakers appeared to be females from a certain social background. For a homogeneous group of the Dutch ‘avant-garde’, van Heuven et al. [7] showed that the F1/F2 bark values taken from /Ei/ onsets of the female speakers are lower and closer to /a/ on the /a/-/i/ line than for the male speakers. By lowering [EI] towards an [aI]-like position, the Dutch diphthong pattern might get close to those of the English or German cognates. Representing the vowel space by means of formants is still the most common method. Yet, formant extraction algorithms produce errors that are not comparable to listeners’ errors [2], and their correction entails problems concerning objectivity as soon as knowledge about the intended vowel classes is taken into account. Secondly, it makes a fully automatic procedure for broader analysis difficult. (In a recent study of Dutch vowels from read speech [1], up to a quarter of the tracked formants had to be altered by hand.) As an alternative to the vulnerable procedure of formant tracking, Pols et al. [11], based on Plomp
et al. [10] compared a principal component (pc) / bandfilter representation of vowels to the frequency and level data of the first three formants from the same vowel segments. Analogous to this early research, the present speech data were analyzed by comparing formant tracking to a bandfilter analysis of the segments in order to use the best method for further analysis. Whenever comparing male to female data, it can be difficult to trace back the gender differences to physical as opposed to sociolinguistic attributes. To avoid mixing the two factors as much as possible, the data have to refer to reference vowels, in which a (socio)linguistic change is not in the offing. Then, diversity can be assumed to be the effect of mainly physical variety and can be normalized for.
2. Speech data For reasons of impartiality, our Dutch speech data were taken from the IFACorpus1 and the CGN2 . Both corpora had been built without any regard towards the aspects and appearance of ‘Polder Dutch’ (PD). The IFA Speech Corpus contains recordings of 8 speakers, 4 female and 4 male, in a variety of speaking styles, which are hand-labeled and segmented at the phoneme level [13]. For this research, only the informally uttered and spontaneously retold speech of the adult 4 female and 3 male speakers was analysed. Further 3 male and 2 female speakers were taken from the Spoken Dutch Corpus (CGN). The CGN contains nearly 9 million spoken words from adult speakers of contemporary Standard Dutch, of which over 5.6 million were collected in the Netherlands [8]. At the time of recording, the 6 female (F) speakers were aged 20, 28, 36, 40, 46 and 60, the 6 male (M) speakers 32, 36, 40, 54, 56 and 66. During an informal listening test, 8 of the 12 speakers (F20, F28, F36, F40, M32, M36, M56, M66) were categorized as speakers of the [aI]-like variant of /Ei/. The spontaneous speech of all 12 adult speakers was labeled selectively and segmented in order to measure realizations of /a/, /i/, /u/ and /Ei/. Generally, stressed vowels are longer and they are articulated more accurately compared to unstressed vowels [12]. Furthermore, the anchor vowels /a/, /i/, /u/ seem to have been left untouched by language changes. This is affirmed in a recent study of read Dutch speech, where the point vowels /a/, /i/, /u/ from speakers of the Northern and Southern Standard Dutch (Flanders) variants have roughly the same formant values [1]. Since the frequency of the appearance of words and vowels in spontaneous speech differs among speakers and depends on topics, the restrictions for the extraction of the vowels were minimized to capture a preferably large amount of realizations. The only criterion for extraction was occurence in a stressed 1 http://www.fon.hum.uva.nl/Service/IFAcorpus/ 2 http://lands.let.kun.nl/cgn/ehome.htm
syllable. Most frequent were segments of /a/ (953), followed by /i/ (543), /Ei/ (428) and /u/ (293), never falling below 10 realizations of each per speaker. All segment boundaries and phoneme labels were set manually, and measurements were done using the Praat programm [3]. All speech data were formant tracked and bandfiltered at the same points in time. For monophthongs, the spectral energy was taken from the middle of the steady state phase of the vowel. For diphthongs, begin and end values were extracted at one tenth and nine tenths resp. of the total diphthong duration. Frames at the very beginning and end were thus ignored, to exclude major coarticulatory effects and onset as well as offset measurement artefacts. This left the major diphthong phase with rather unidirectional spectral transitions for measurement. Due to the variety of the surrounding sound segments, the results were checked on coarticulatory influences. For the formants as well as for the pc’s, no word specific clustering within the extracted vowel classes or diphthongs was found. Hence, systematic influence of the local (consonant) context on the measured areas could be excluded. The fundamental frequency was measured using the Praat standard analysis. For the female speakers, F0 yielded no regularities concerning the lowered vs. not lowered variants. For the male speakers, the two variant qualities were apparent in the F0 values. For the lowered variant speakers, F0 of the diphthong was closer to F0 of /a/ than for the other speakers.
Pols et al. decided to combine the first one-third octave filters to make sure that all speakers’ fundamental frequency were represented within the same filter. Also in our one-Bark filter set, F0 strongly influenced the variance within the first two filters. To get rid of the unwanted influence on the PCA, the first two filters were combined and were represented by the mean intensity. The total number of dimensions thus decreased from 20 to 19. To compare the speakers’ vowel structures, the calculated dimensions had to include as little variance caused by individual speaking style variants as possible, and therefore the pc’s calculated on only the 3 rather stable anchor vowels /a/, /i/, /u/ were used to present further vowels and diphthongs in that vowel space. The amount of /a/, /i/, /u/ differed between speakers. To include all /a/, /i/, /u/ data and give each speaker equal influence in the analysis, each speaker’s mean vowel values were used for the PCA (figure 1). Since the number of speakers was rather small and the eigenvectors only differed slightly between the sexes, female and male speakers were analyzed together.
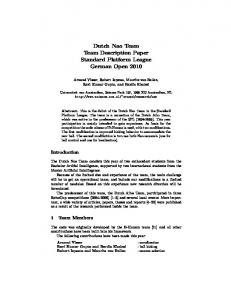
Figure 1: Eigenvectors pc1 (I), pc2 (II) and pc3 (III) of a PCA on all speakers’ means of /a/, /i/, and /u/.
3. Formant analysis Using Praat, the sound was resampled to 2·5500Hz for female, and 2·5000Hz for male speakers for the extraction of five formants. After pre-emphasis, the LPC coefficients were computed applying the Burg algorithm on Gaussian-like windows, with a time step of 1ms, not enhancing frequencies below 50Hz. The window size was related to the mean pitch to fit a duration of three periods. Only the first three formant values were scaled to Bark and used for further analysis. In Gay [6], the diphthong duration influences the diphthong offset positions. In our data, the diphthong onset showed no (systematic) correlation with length, and the offset values of F1bark and F2bark slightly correlated with an increasing overall duration in getting more extreme (mean rF 1 = -.35, rF 2 =+.40). This suggests that further examination can reliably refer to the diphthong onset formant values, whereas the offset values carry effects of different speaking rates and need further examination. To gain a first insight into the acoustic formation, the mean diphthong onset values of each speaker were taken, as well as the mean values of the anchor vowels /a/, /i/ and /u/. All but one (M66) of the eight lowered diphthong speakers showed an overlap for the /a/ values and the begin of the diphthong /Ei/, but this was also the case for one speaker (F46) of the opposite group, indicating less articlatory space between /a/ and the /Ei/ onset than for the other speakers.
4. Bandfilter analysis The spectra of the sound segments were filtered up to 21 bark, with a window length of 13ms and a time step of 1ms, and intensities were equalized. Built according to the physical characteristics of the auditory filters in the human ear, the bandfilters were set with progressively increasing bandwidths, each over an area of one bark, resulting in 20 filters, overlapping by -3dB. A problem of bandpass filtering can be the fundamental frequency, resulting in empty filter outputs now and then and high variance.
5. Principal components vs. formants Table 1: Correlations of F1/2/3 with pc’s 1/2/3, 2767 speech segments (/a/, /i/, /u/, /E/, /Ei/ onset). On the very right the percentage of total variance explained by the first three dimensions of the PCA on bark filtered /a/, /i/, /u/ of 12 speakers. pc1 pc2 pc3
F1bark +.81 -.08 -.19
F2bark -.12 +.70 +.05
F3bark +.26 +.10 -.15
expl. var. 65% 25% 5%
As can be seen in table 1, pc1 strongly correlated with F1bark, and pc2 with F2bark. A rotation of the pc1-pc2 plane might bring about even stronger correlations. The inter-speaker variability for the anchor vowels appeared to be smaller for the pc1-pc2 plane than for the F1-F2 bark plane. Regarding the principal components compared to formants, /a/ and /i/ were more clearly separated in terms of pc1, and differences for male and female speakers regarding their circumferential vowel space were smaller for the pc plane (comp. table 2). When it comes to errors and automatization of the measurement procedure, barkfiltering the spectral energy distribution reduced by a PCA prevails over a formant analysis. Since the pc1-pc2 plane was comparable to the F1bark-F2bark plane (compare exTable 2: Table of mean and std of F1 vs. pc1 for anchor vowels /a/, /i/, /u/ of all twelve speakers.
/a/ /i/ /u/
F1 (std) 6.36 (12%) 3.26 (11%) 3.50 (12%)
pc1 (std) 191 (6%) 131 (8%) 135 (9%)
110
u
i
a
210
10 15
13
11 F2(bark)
230 90
9
70
50 30 pc2
190
13 12 11 10 9 8 7 65 4 12 3
u pc1
150
6
F20 13
11 F2(bark)
i
9
210 230 90
70
210 90
70
M32
50
M40
30
pc2
50
30
pc2
u
170 190
a 8
210 90
170
Figure 3: Pc1-pc2 planes of mean /Ei/ diphthong dynamics and one-sigma ellipses of the 13 measured points in time. ‘Polder Dutch’ speaker M32 (left) and non-lowering speaker M40.
130
i
13 12 11 109 87 54321 6
10
110 2
170 190
F46
F46
F1(bark)
150 pc1
pc1
170 190
10 15
150
a 70
F20 50 30 pc2
10
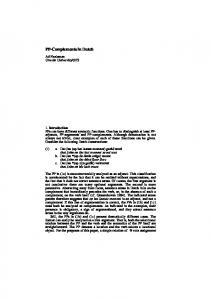
Figure 2: F1-F2 bark planes (left) vs. pc1-pc2 planes (right) of non-lowering speaker F46 (top) and ‘Polder Dutch’ speaker F20 (bottom). Mean anchor vowel values with one-sigma ellipses. In grey the diphthong /Ei/ on- and offsets, the means connected by an arrow.
patterns varied within and between speakers. The further one gets in the duration of the diphthong, the greater the standard deviation of the measured mean points in time (comp. figure 3). Yet, some speaker spanning patterns continued to reappear. The mean dynamic patterns of the non-lowering diphthong speakers showed a rather steady state in the begin phase with little pc1- and hardly any pc2-movement, whereas the speakers of the other variant showed steady-going transitions in pc2 from the very start on (comp. figure 4). At the same time, the lowered variant shows in the begin phase either hardly pc1-movement, or pc1-movement into the direction of /a/. 110 130
not PD
7. Temporal diphthong structure Besides further classification of the state of diphthong change within Standard Dutch, investigating the temporal structure could give more insight to the auditory judgment of the variants, which could not merely be explained by relative begin and end diphthong values related to the anchor vowels or /E/. The mean duration of the diphthong segments was 130 ms, and so the temporal strucure was analyzed by measuring in 13 equidistant steps along the diphthongs. The dynamic diphthong
170 190
6. The position of /E/ in relation to /a/, /i/, and /Ei/
a
210 70
50 30 pc2
10
210 230 90
* * ** ** E ** a **
170
u
M40 70
50 30 pc2
10
110 130
i
i
150 pc1
u
170 190
150
230 90
130
PD
i
210
110
150
130
190 F46
230 90
pc1
The first articulatory goal for the Dutch Standard diphthong and is said to be [E]. For further relativisation of the begin position of the diphthong in the articulatory-acoustic /a//i/ space, /E/ tokens from the lexically stressed syllables of the words and were measured. Compared to the anchor vowels /a/, /i/, /u/, the Dutch /E/ is significantly shorter and more strongly influenced by coarticulation. Therefore we chose for less realizations but similar environments. Compared to the anchor vowels, /E/ turned up more speaker specific in the vowel space. The /E/ of five of the eight lowered diphthong speakers surfaced around the middle of the /a/-/i/ line whereas for the other group /E/ is close to /a/, except for one speaker. The diphthong onset of all non-lowering speakers is within or just outside the sigma ellipses of /E/, never in between /E/ and /a/.
*** ** ***** *E
150 pc1
amples in figure 2), further analysis of the variants was carried out using the pc’s.
110
u
i
pc1
a
8
PD
130
150
6
4
130
u
i
130
4 pc1
not PD
F1(bark)
2
E
70
170 190
*** **** a ****
F20 50 30 pc2
10
u
* E ** * * * ** * ***a
210 230 90
M36 70
50 30 pc2
10
Figure 4: Pc1-pc2 planes of speakers F46 and M40 (top) versus ‘Polder Dutch’ speakers F20 and M36 (bottom). Mean anchor vowel values with one-sigma ellipses. The black stars indicate the speaker’s mean /Ei/ diphthong dynamics.
8. Discussion and conclusions Measuring formants is still the most common and most preferred method to visualize the vowel space, and when it comes to articulatory patterns, there is a direct relation between the
Table 3: Table of presence (+) or absence (-) of attributes for female and male speakers of different ages. In gray the speakers perceived as producing a lowering of the diphthong /Ei/. perceived as lowering /Ei/ /Ei/ onset overlaps /a/ continuous pc2 dyn. first 40ms of /Ei/ pc2 /Ei/ onset ≤ pc2 /E/ high /E/
F20 + + + + +
F28 + + + + +
M32 + + + + +
vocal tract properties and the formants. In this study, pc1 and pc2 of a PCA on the barkfiltered segments yielded comparable results to F1bark and F2bark. Since the bandfilter method is easier to append, especially for larger corpora, and more objective, it was chosen for further analysis. Table 3 gathers the acoustic cues that go together with the perceived diphthong variant quality for the twelve speakers. Within our sample of 12 speakers, the variant quality seems to be predictable from the relative distances in the pc1-pc2 vowel space and the dynamics of the diphthong /Ei/ itself. Peeters [9] claims that his data point to a temporally based articulatory pattern of language-specific diphthong properties. Further examination will have to reveal how close the lowered variant pattern in our data got to the English or German patterns. No clear tendencies for female speakers as opposed to male speakers were found in our sample. Regarding older versus younger speakers, there was a generation-oriented pattern for female speakers, with the younger generations speaking ‘Polder Dutch’. A closer look at /E/ taken from realizations of and revealed a variant-specific pattern of the position of the /E/ when related to the diphthong onset and the /a/-/i/ line. Alongside the lowering of /Ei/, the tendentiously higher orientation of /E/ in the vowel space for the group of ‘Polder Dutch’ speakers shows a further change within the vowel inventory of the speaker group. Among the female ‘Polder Dutch’ speakers, only the young ones have high /E/, whereas neither the ’middle aged’ speakers nor the older generation show it. More detailed analyses on more speakers will have to reveal if this possibly indicates a certain order within the shifting process of vowels. The observations in this study entail a closer analysis of the whole vowel system in future research including different listening tests to further define the obvious speech change in progress. This will be done using more speakers of the CGN as well as new recordings since the CGN was recorded around 2000, and changes denoting ‘Polder Dutch’ might have spread and developed further since then. Besides the positions in the vowel space, the dynamic patterns themselves seem to play a role within the vowel system, and further research will have to include not only investigations of the other Dutch diphthongs /Au/ and /2y/, but also investigations on the dynamics of the Dutch so-called ‘pseudo’ diphthongs, e.g. /aj/ (compare [4]), and possible dynamic changes within such monophthongs as /e:/, /o:/, and /ø:/ . A larger sample of speakers might then reveal the temporal order of change within the whole vowel system over the last decades, including the aspects of age and social background.
9. Acknowledgements We would like to thank D.J.M. Weenink, R.J.J.H. van Son, and T.G. Wempe of the IFA for the fruitful discussions.
F36 + + + + -
M36 + + + + +
F40 + + + + -
M40 -
F46 + -
M54 + +
M56 + + + -
F60 -
M66 + + +
10. References [1]
Adank, P.M., van Hout, R. & Smits, R., “An acoustic description of the vowels of Northern and Southern Standard Dutch”, J. Acoust. Soc. Amer., Vol.116, 2004, p.17291738.
[2]
Bladon, A., “Arguments against formants in the auditory representation of speech”, in: The Representation of Speech in the Peripheral Auditory System., editors: Carlson, R. and Granstr¨om, B., Elsevier, Amsterdam, 1982, p.95-102.
[3]
Boersma, P.P.G. & Weenink, D.J.M., “Praat, a system for doing phonetics by computer”, http://www.praat.org, 1992-2004.
[4]
Collier, R., Bell-Berti, F. & Raphael, L.J., “Some acoustic and physiological observations on diphthongs”, Language and Speech, Vol.4, 1982, p.59-69.
[5]
Fennell, B.A., “A history of English”, Blackwell Publishers, Oxford, 2001.
[6]
Gay, T., “Effect of speaking rate on diphthong formant movements”, J. Acoust. Soc. Amer., Vol.44, 1968, p.15701573.
[7]
van Heuven, V.J., Edelman, L. & van Bezooijen, R., “The pronunciation of /Ei/ by male and female speakers of avant-garde Dutch”, Linguistics in the Netherlands, 2002, p.62-72.
[8]
Oostdijk, N., “The Spoken Dutch Corpus. Overview and first Evaluation”, Proc. LREC, Vol.II, 2000, p.887-894.
[9]
Peeters, W.J.M., “Diphthong Dynamics. A crosslinguistic perceptual analysis of temporal patterns in Dutch, English, and German”, PhD thesis, Rijksuniversiteit Utrecht, Mondiss, Kampen, 1991.
[10] Plomp, R., Pols, L.C.W. & van de Geer, J.P., “Dimensional analysis of vowel spectra”, J. Acoust. Soc. Amer., Vol.41, 1967, p.707-712. [11] Pols, L.C.W., Tromp, H.R.C. & Plomp, R., “Frequency analysis of Dutch vowels from 50 male speakers”, J. Acoust. Soc. Amer., Vol.53, 1973, p.1093-1101. [12] van Son, R.J.J.H., “Spectro-temporal features of vowel segments”, PhD thesis, University of Amsterdam, IFOTT3, 1993. [13] van Son, R.J.J.H., Binnenporte, D., van den Heuvel, H. & Pols, L.C.W., “The IFA corpus: a phonemically segmented Dutch Open Source speech database”, Proc. Eurospeech, Vol.3, 2001, p.2051-2054. [14] Stroop, J., “Poldernederlands, waardoor het ABN verdwijnt”, Bert Bakker, Amsterdam, 1998.