1 Identifying and Using Emergent Consumers in Developing Radical Innovations
Donna L. Hoffman Praveen K. Kopalle Thomas P. Novak*
March 3, 2008
Donna L Hoffman is the Chancellor’s Chair and Professor of Marketing at the A. Gary Anderson Graduate School of Management, 900 University Avenue, University of California, Riverside, Riverside, CA 92521; Ph 951-827-4848; Fax 951-827-3970;
[email protected] Praveen Kopalle is associate professor of business administration, Tuck School of Business at Dartmouth, and is a Bozzone Visiting Scholar at the Lally School of Management and Technology, Rensselaer Polytechnic Institute, 110 8th Street, Troy, NY 12180; address for correspondence: Dartmouth College, Hanover, NH 03755; Ph: 603-646-3612, Fax: 603-6461308,
[email protected]. Thomas P. Novak is the Albert O. Steffey Professor of Marketing at the A. Gary Anderson Graduate School of Management, 900 University Avenue, University of California, Riverside, Riverside, CA 92521; Ph 951-827-4999; Fax 951-827-3970;
[email protected]
2
*The authors thank David Porter, an entrepreneur and the inventor of SmartBox, a patented storage device for the delivery and pickup of goods (U.S. Pat. #5,774,053), for permission to use the SmartBox descriptions in this research.
3 Identifying and Using Emergent Consumers in Developing Radical Innovations
ABSTRACT Though marketers are well aware that typical consumers have difficulty estimating the usefulness of really new products (Hoeffler 2003), little research has focused on which consumers to use in the new product development process, particularly in developing radical innovations in the consumer goods industry. In this paper, we develop a methodology to identify ―emergent consumers,‖ individuals that are able to synergistically apply intuition and judgment to improve product concepts that mainstream consumers will find more appealing and useful relative to ones that are developed by mainstream or even innovative consumers. Our approach involves a comprehensive calibration and validation phase of scale development and construct measurement, along with four studies for concept development and market reaction that show that the product concept developed by the emergent group is found most appealing by mainstream consumers. Emergent consumers can aid in the successful development of radical new product concepts, improve the chances of success in the marketplace for such innovations, and help predict their acceptance by mainstream consumers.
4 INTRODUCTION Several years ago, David Porter, an inventor and entrepreneur, had an idea that an intelligent storage device outside of people's homes would stimulate the home delivery of goods1. Porter bounced the idea off some customers, enlisted a few engineers to help with the technical specifications, patented the ―SmartBox‖ solution, built a prototype in partnership with a company and ran a small home trial with ordinary consumers. On the basis of the home trial, the company concluded that the market for the SmartBox was too small and abandoned the project. The SmartBox is a really new product (or a radical innovation) relative to how consumers currently accept delivery of goods at home. The concept development problem faced by David Porter is not unique. Consumer firms focused on innovation are generally interested in learning which consumers might be the "right" ones they should be talking to and how they might use them to further develop innovative concepts and improve their chances for success in the marketplace. Which consumers are the most appropriate to engage in the product development process for innovative products is important because while new product development is a major activity of firms (Chandy and Tellis 1998), most of the 25,000 products introduced in the United States each year fail (Goldenberg, Lehmann, and Mazursky 2001). Products may be abandoned when consumers exhibit uncertainty with respect to an innovation (Christensen 1997; Economist 1999), but research suggests that typical consumers have difficult estimating the usefulness of radical innovations (Griffin 1996; Hoeffler 2003). Such preference uncertainty may lead firms to abandon projects that might ultimately be successful innovations.
1
Personal communication between David Porter and the authors and articles reported in Business Week (Borrus 2000) and the Wall Street Journal (Tam 2002).
5 Yet, while much research has emphasized improving current new product concept techniques, for example, via mental analogies (Dahl and Moreau 2002; Hoeffler 2003), visual depiction and animation (Dahan and Srinivasan 2000), Web based testing (Dahan and Hauser 2002), or conjoint analysis (Green, Krieger, and Vavra 1997), little research has focused on which consumers to use in the new product development process, particularly in the consumer goods industry. Note that the lead user approach, using customers with an early awareness of their needs, has been applied primarily in a business-to-business setting (von Hippel 1986); however, the use of particular, as opposed to typical consumer groups for developing and testing radical new products in consumer settings has not received nearly as much attention. Considering further the high failure rate of new products, a methodology that can aid in the product development process for really new consumer products may be warranted. We propose a methodology to identify these ―right‖ consumers. We argue that the right consumers possess what we call an ―emergent nature,‖ i.e., the ability to process information in a synergistically experiential and rational thinking style, and exhibit a unique set of personality traits such that interactions among them in a new product development context will produce a radical innovation that mainstream consumers would find more appealing and useful relative to one that is developed by mainstream or even innovative consumers. We propose that identifying and using such ―emergent consumers‖ in the concept development stage can aid in the successful development of radical new product concepts and help predict their ultimate acceptance by the mainstream customers. Identifying these consumers is important since firms find it hard to develop radical innovations, particularly those that may actually disrupt products currently in widespread use (Ahuja and Lampert 2001; Chandy and
6 Tellis 2000; Christensen 1997). Thus, our methodology may serve as a kind of ―early warning system‖ that could prove vital for really new products. The paper is organized as follows. First, we draw on psychological theories of information processing and self-organizing theory to develop the emergent nature construct and specify a number of directional predictions regarding the important role of emergent consumers in the new product development process. Next, we test our hypotheses in one pilot test and four studies. The pilot study demonstrates that experiential and rational processing strategies are distinct from innovativeness. Study 1 is a comprehensive calibration and validation phase involving scale development and construct measurement to support our understanding of the emergent consumer and related constructs in which we are able to show that the emergent nature construct is distinct from lead user-status as well as dispositional innovativeness (Steenkamp and Gielens 2003). In study 2, six mutually exclusive groups of consumers, including those high on emergent nature, lead user status, and dispositional innovativeness, develop a new product concept using an online bulletin board methodology and in studies 3 and 4, those concepts are market tested and it is demonstrated that the concept developed by emergent consumers is rated significantly more positively compared to concepts developed by average consumers, lead users, innovators, and the two other concept testing groups.
7 THEORY Current Approaches for Developing New Product Concepts One approach to developing new products is to use a product-based, template method that helps specify the final pattern of an innovation and steer the pattern formation process (Goldenberg, Mazursky, and Solomon 1999). A consumer-based approach follows from Rogers’ (2003) innovation diffusion theory which suggests that innovators and early adopters play a key role in the diffusion process (Goldenberg and Efroni 2001). A related consumer-oriented approach to evaluate the potential success of an innovation is to rely on consumer innovativeness, defined as an underlying predisposition of consumers to buy new and different products (Midgley and Dowling 1978), distinct from innovation adopter categories (Rogers 2003), which are determined ex-post product introduction (Midgley and Dowling 1978; Steenkamp, ter Hofstede, and Wedel 1999). Consumer innovativeness has been found to correlate positively with personality traits such as extraversion, risk taking, and impulse buying (Steenkamp et al. 1999). The use of lead users has also received wide attention, particularly in business-tobusiness settings (e.g. von Hippel and Katz 2002). Lead users have a conscious awareness of their domain-specific needs, are motivated to innovate to satisfy those needs, and experience those needs earlier than most in the market (Lilien, et.al. 2002; Morrison, Roberts, and von Hippel 2000). The lack of lead user studies in consumer settings suggests that it may be hard to identify lead users in consumer markets and lead user status may not be a trait-based characteristic.
8 Consumer Thinking Styles A considerable body of research in dual-processing theory has differentiated among two types of information processing styles: experiential thinking style (intuitive, associative, affective, holistic, and heuristic) and rational thinking style (analytic, logical, causal, intentional, systematic) (e.g. Epstein 1994; Pacini & Epstein 1999; Sloman 1996; Smith and DeCoster 2000). Research has substantiated the existence of individual differences in these two thinking styles through highly reliable and valid measurement instruments that assess an individual’s relative tendency to engage in rational versus experiential thinking (Epstein, Pancini, Denes-Raj, and Heier 1996; Pancini and Epstein 1999; Norris and Epstein 2003a, 2003b). Rational thinking style involves goal-directed, active, logical processing, and permits consumers to make optimal judgments about the utility of adopting a particular product innovation. Experiential thinking style, on the other hand, involves holistic, emotional, associative processing. Immediate experience is critical for experiential thinking, while logic and evidence are critical for rational thinking. Thinking Style Correlates. Rational and experiential thinking styles are not mutually exclusive processing styles; empirically they tend to have a very small positive correlation. Epstein and his colleagues have shown that these two processing styles reliably relate to a variety of psychological constructs (Denes-Raj & Epstein, 1994; Denes-Raj, Epstein, & Cole, 1995; Epstein, Donovan, & Denes-Raj, 1999; Epstein, Lipson, Holstein, & Huh, 1992; Epstein & Norris, 2000; Epstein & Pacini, 1999, 2001; Epstein, Pacini, Denes-Raj, & Heier, 1996; Pacini & Epstein, 1999a, 1999b; Pacini, Muir, & Epstein, 1998). Individuals high in rational thinking style are also high on the ―Big Five‖ traits of Openness and Conscientiousness and exhibit
9 positive beliefs about themselves and the world, while high experiential processors score high on the Big Five traits of Extraversion and Agreeableness, show high levels of emotional expressivity, exhibit positive beliefs about relationships, and score low on categorical thinking. Recent research has also demonstrated that higher levels of experiential thinking style are associated with significantly higher levels of creativity (Norris and Epstein 2003b). Thus, a rational thinking style appears to be adaptive for good judgment in specific decision-making situations, while an experiential style is adaptive for interactions and creative pursuits.
Synergy Between Experiential and Rational Thinking Styles Creates Emergent Nature While the ―cognitive miser‖ (Gilovich and Griffin 2002) approach to information processing essentially views experiential cognition as biasing rational thought, other dual processing models see the dual thinking styles as operating in a more complementary fashion (Epstein 1985; Hogarth 2005; Kahneman 2003; Novak and Hoffman 2007; Sloman 1996), allowing for the possibility that the thinking styles may operate both simultaneously and sequentially, with each best suited to its own particular tasks or situations. Novak and Hoffman (2007) suggested that, in the case of task-specific thinking style, some tasks ―might demonstrate synergistic effects‖ in which both experiential and rational task-specific thinking style might correlate positively with performance. We propose that consumers with an emergent nature are high in both experiential and rational thinking style and are able to use the two thinking styles in a synergistic manner. That is, we argue that emergent nature is defined largely by the complementary interaction between the experiential and rational thinking styles.
10 How does emergent nature influence product development? We propose that emergent consumers, owing to the synergies among their thinking styles, are able to engage successfully in both idea generation to enhance the original concept and logical analysis to refine and develop the concept further. In other words, emergent consumers are able to synergistically apply intuition and judgment to improve product concepts. Consumers with a high emergent nature develop an intuitive, almost ―instinctive‖ understanding, i.e., visualizing the latent uses of a new product, through a sequence of small scale, affective, and associative perceptions. They are able to generate these ideas focused on the future because they possess a high degree of experiential processing ability. Another way to look at this is to consider that the experiential system generates the ―gut feelings‖ underlying the intuitive understanding of the potential usefulness of a new product concept. Following this automatic, associative stage, emergent consumers, owing to their high degree of rational processing ability, then employ a rational thinking style in a conscious, logical and analytic effort to evaluate and refine the concept. In our conceptualization, the thinking styles work together in a complementary and iterative fashion, where a rational effort to analyze a product concept may activate further implicit, experiential associations about that concept, followed by another round of rational analysis, and so on. The essence of emergent nature is that consumers so possessed are able to inform their experiential impressions and associations with rational evaluation and judgment and vice versa. Our conceptualization is consistent with the notion of self-organization among certain individuals, for example, such as those high in both rational and experiential thinking style with a vision for the future (Vojak, Griffin, Price, and Perlov 2006), where a process by which patterns at an aggregate level emerge based on interactions among the individuals (Camazine,
11 Deneubourg, Franks, Sneyd, Theraulaz, and Bonabeau 2001). Emergence refers to a process by which outcomes of interactions among those individuals acquire qualitatively new properties that may be more than a simple addition of their individual contributions. Camazine et al. (2001) establish the scientific nature of the emergent property among individuals, where under a particular set of conditions a global pattern emerges over time. In the context of a new product development process, the resultant ―global pattern‖ could be a radical innovation that typical consumers will be likely to adopt. The ―particular set of conditions‖ under which the radical innovation develops is brought about through the explicit interaction among a group of consumers we call ―emergent consumers,‖ who are able to imagine or visualize new product concepts that may best fit typical consumers’ needs. In these interactions, emergent consumers make use of both their rational and experiential thinking styles. Experiential thinking can be affective in nature, consisting not only of objective information regarding an innovation, but also the associative connections the innovation invokes in consumers’ minds. Rational, rule-based reasoning allows emergent consumers to make logical connections among the activated associations evoked from experiential thinking. This actively conscious thinking style is interpretive and the innovation itself is built based on the interplay among the emergent consumers.
Personality Correlates of Emergent Nature Emergent consumers possess both an experiential and rational thinking style. We also conceptualize that they will exhibit openness to new experiences and ideas, possess an intellective self-focus referred to as reflection, process information both verbally (rational style)
12 and visually (experiential style), and report high levels of creativity. Below we briefly review these correlates. An open-minded thinking disposition (Kline 2000; Stanovich and West 1997) is expected to correlate strongly with emergent nature because individuals with such dispositional tendencies will be expected to apply logical reasoning. Further, previous research has found that openness to experience is related to divergent thinking, an important component of creativity (McCrae 1987). Individuals high on this trait are more imaginative and reflective, and enjoy experiences with unique aesthetic, emotional and intellectual components. Reflection is a type of private introspection (Fenigstein, Scheier and Buss 1975) stimulated by exploratory curiosity and represents an intellective self-consciousness or self-focus motivated by epistemic goals (Trapnell and Campbell 1999). This suggests we can expect reflection and openness to experience to be positively correlated. We hypothesize that emergent consumers possess greater amounts of internal reflection (along with openness to experience), thus contributing to an increase in network associations in memory that could extend beyond the self to other associations. Such consumers are able to experientially explore and rationally investigate unique alternatives in product development contexts. Two types of information processing are expected to be positively correlated with emergent nature, verbal and visual processing (Childers, Houston and Heckler 1985). Imaginal processing relates to an individual’s ability to process imagery and verbal processing refers to an individual’s ability to process words. Consumers with an emergent nature are expected to possess the ability to process information both verbally and visually.
13 We expect the emergent nature of consumers to be positively correlated with optimism. Optimism relates to the extent people view things to be better in the future than they are now (Kopalle and Lehmann 2001). Given the nature of emergent consumers, i.e., those who are able to envision or intuit how current new product concepts may be better developed such that they would fit into the lives of typical people in the future, suggests an intrinsic level of optimism, we posit that the level of optimism may be a correlate of the emergent nature. Our new emergent nature scale is predicted to be unidimensional and distinct from lead user status (itself a unidimensional construct) and dispositional innovativeness, and positively correlated with experiential and rational thinking style, openness to experience, reflection, and creativity and optimism. We further hypothesize that emergent consumers will exhibit higher levels of these traits than consumers high on dispositional innovativeness or lead user status. We expect that dispositional innovators will display the highest correlations with impulse buying behavior. We will observe the direction of trait correlations with lead users post hoc as the lack of in-depth examination of lead user characteristics and their identification, particularly in the consumer market (Morrison, Roberts, and von Hippel 2000), makes hypothesis specification difficult.
STUDY 1: SCALE DEVELOPMENT AND VALIDATION Calibration Method
14 A broad range of general measures related to processing style and personality, along with attitudes, intentions and perceptions related to the SmartBox concept were collected in study 12. A total of 1124 native English speaking adult respondents randomly selected from a global online panel comprised the total analysis sample. Sampling details are provided in the section ―Study 1 Sampling Details‖ in the Web Appendix. Following Wickens (1989), we unevenly split the sample into a larger calibration sample of 754 randomly drawn respondents for developing the emerging consumer scale; 370 respondents served as the validation sample. Respondents were directed to a login screen for a Web-based experiment. Once at the experiment, they were instructed that they were being asked to participate in two separate and independent studies in the same experimental session. All respondents first answered a short series of questions regarding Internet usage. In the first part of the study, respondents were told that the experimenters were interested in assessing their general attitudes toward products and services. They were presented with the seventeen items comprising our original emergent nature scale, an impulse buying behavior scale (Rook 1995), and an existing eight-item scale measuring a consumer’s tendency toward dispositional innovativeness (Steenkamp and Gielens 2003). Following these dispositional scales, we provided respondents with a description of the SmartBox concept (see Appendix A) and a series of evaluative questions about the SmartBox. As noted above, the SmartBox is a new invention (U.S. Pat. #5,774,053) intended to make home pickup and delivery secure and convenient even if no one is at home. Respondents were asked to evaluate their general attitudes toward the SmartBox, along with their utilitarian and hedonic
2
A pilot study (see the section ―Pilot Study‖ in the Web Appendix for details) showed that experiential processing style, theorized to be a strong correlate of emergent nature, is a separate dimension from innovativeness and provided the first empirical evidence that experiential and rational processing styles are both independent of innovativeness.
15 attitudes (Voss, et.al. 2003), the degree to which the SmartBox was a novel product concept
3
(Moorman 1995), and a number of single item measures regarding adoption, use, ordering behavior, the maximum price the respondent would be willing to pay for installation of the SmartBox, whether the SmartBox was a radical innovation4, how attractive the SmartBox currently is to average consumers, how long it would take before average consumers would buy one, how much $1000 invested in the SmartBox company would be worth in ten years, and whether respondents could picture the SmartBox being developed in the future in such a way that average consumers would find it attractive. We also used a modified version of the product improvement task from the Torrance Tests of Creative Thinking (Torrance 1990) in which respondents were asked to provide up to twenty ways they ―can think of for changing the SmartBox so that it will be successful in the marketplace as a home delivery solution for average consumers.‖ Respondents also completed eight items comprising our original domain-specific lead user status scale. These items were developed based on definitions supplied in Morrison, Roberts and von Hippel (2000). The first part of Study 1 concluded by asking respondents to evaluate their interest and experience with the home delivery of goods and services using scales for product class involvement and knowledge (Beatty and Talpade 1994) and a single item measure for actual use.
3
We modified the first three items in the new product novelty scale by dropping ―for/to this category‖ from the ends of the first three bipolar statements. 4 The radicalness of innovations is the extent to which an innovation advances the performance frontier faster than the existing technological trajectory, i.e., it is based on a substantially new technology relative to what already exists in the industry (Gatignon et al., 2002). For measuring the radicalness of SmartBox, we chose four items from Gatignon et al. (2002) Also, we measured, ―Considering the home delivery of goods industry, do you think the SmartBox is a radical product innovation? (measured on a seven-point strongly disagree-strongly agree scale)‖.
16 In the second part of Study 1, respondents completed a series of scales designed to measure information processing styles and constructs hypothesized to relate to emergent nature, including rational and experiential thinking style, reflection, openness to experience, verbal and visual processing, optimism, creativity and impulse buying behavior. Rational and experiential thinking style was measured by means of the short form of the Rational-Experiential Inventory (Norris and Epstein 2003b), a highly reliable and valid instrument for measuring dispositional thinking styles (Epstein, Pacini, Denes-Raj and Heier 1996). We used Trapnell and Campbell’s (1999) twelve-tem reflection to measure private self-consciousness, the twelve-item subscale from the Revised NEO Personality Inventory (Costa and McCrae 1992) that measures the broad personality domain of ―openness to experience‖ (the other domains are neuroticism, extraversion, agreeableness and conscientiousness), two eleven-item scales that tapped verbal and visual processing style (Childers, Houston and Heckler 1985), two creativity scales5, one comprising three original items developed in pre-tests (―I consider myself to be a creative person,‖ ―Creative endeavors are important to me in my life,‖ and ―My best friends consider me to be a creative person‖) and the other a widely used self-assessment checklist to assess ―creative personality‖ (Gough 1979), and a three-item consumer optimism scale (Kopalle and Lehmann 2001).
Scale Development Results
5
Theory and empirical research discussed earlier suggest that creativity should be positively correlated with emergent nature. A variety of tasks exist to measure creativity. Because of their difficulty in administration, we sought reliable and valid self-report measures, based on an individual’s self-concept, and derived from the Adjective Check List (Gough 1979).
17 Using our theoretical definition of an emerging consumer, the authors generated an extensive set of preliminary items as the first step in scale construction. On the basis of a pretest, we used item analysis to refine the items and produce a reduced set of 17 items for inclusion in study 1. Following current practice in psychometrics (e.g. see Kline 2000), we submitted the seventeen items to factor analysis using the principal axis method of factor extraction and oblique rotation (direct oblimin with delta=0). Items loading above .70 were selected as being more defining of the latent construct. An iterative item-analysis procedure produced virtually identical results (items were retained if item correlations with the total scale were above .70). This procedure yielded an eight-item emergent nature scale. A principal axis factor analysis of these eight items accounted for 63% of the variation in the correlations among the items and a scree plot showed a clear elbow after one factor, supporting the hypothesis that the EC scale contains one dimension. Coefficient alpha was .929, lending further evidence that a consumer’s emergent nature is a unidimensional construct that can be reliably measured. The final set of items is listed in table 1. [Insert Table 1 About Here] We used the same general procedure to develop a domain-specific lead user scale. While lead user status has typically been applied in business-to-business contexts, we constructed a lead user scale specific to the SmartBox domain of consumer home delivery that incorporates the following characteristics: 1) actively engages in a broad range of activities related to the delivery of consumer goods to their home and workplace (category-specific expertise), 2) expects that adoption of the innovation will address their needs and provide clear benefits, and 3) experiences these needs ahead of the general population (Lilien, et.al. 2002; von Hippell 1986; von Hippel,
18 et. al. 1999; Urban and von Hippel 1988). Exploratory principal axis factor analysis and iterative item analysis produced a five-item scale. A principal axis factor analysis of the five items accounted for 73% of the variation in the correlations; the scree plot clearly showed one dominant factor, supporting the hypothesis that our domain-specific lead user scale is unidimensional. Reliability was also high (.931). The final set of items is listed in table 1. Steenkamp and Gielen’s (2003) eight-item dispositional innovativeness scale was used as is. Coefficient alpha was .830. We created summed scales from the measured variables. Moderately low correlations among the observed summed scales supported our theory that emergent nature is a distinct construct from dispositional innovativeness (r=.37) and domain-specific lead user status (r=.39). Also consistent with theory, lead user status and dispositional innovativeness exhibited a weak correlation (r=.18) in the calibration sample. To investigate the dimensionality of the three scales together we first fit a single-factor model. The fit was very poor (CFI=.599, RMSEA=.171). A three-factor model fit well (CFI=.941, RMSEA=.066), supporting our hypothesis that emerging consumer, dispositional innovativeness and domain-specific lead user are three separate constructs. All factor loadings were above .60 except for three items on the dispositional innovativeness scale.
Scale Validation To show criterion validity, we need to demonstrate that our emergent nature scale correlates with other measures hypothesized to relate to the emerging consumer trait. If these measures are assessed at the same time, that is a demonstration of concurrent validity. If we take
19 these measures at a later point in time, we may be able to establish predictive validity. In study 1, we demonstrate concurrent validity. In study 3, we will establish predictive validity, using concept development scores as a criterion. In the validation sample, coefficient alphas were high (see table 2) and correlations among the summed scales followed the same pattern as in the calibration sample: emergent nature exhibited low to moderate correlations with dispositional innovativeness (r=.38) and lead user status (r=.48) and lead user status and dispositional innovativeness were only weakly associated (r=.17). The fit of the three-factor model was also very good (CFI=.938, RMSEA=.069), all factor loadings were above .60 except for three items on the dispositional innovativeness scale. Having established reliability and discriminant validity with the calibration and validation samples, we combined the samples to demonstrate construct validity. [Insert Table 2 About Here]
Emergent Nature, Dispositional Innovativeness and Lead User Status The means of the summed scales and measured variables for the combined (n=1124) sample appear in table 3. Table 4 displays the correlations and means of emergent nature, dispositional innovativeness and domain-specific lead user status with demographics. There is a slight tendency for consumers high on emergent nature, dispositional innovativeness and lead user status to be younger and better educated (although the correlation between innovativeness and education is not significant). There are very small effects for gender and country. There is a slight tendency for men to be emergent and innovators and for women to be lead users in the home delivery category. Residence in the United Kingdom is positively associated with lead
20 user status and a positive association between being an American or from the U.K. and emergent nature and dispositional innovativeness. [Insert Table 3, 4 and 5 About Here] Table 5 presents the correlations and regression results from fitting a series of simple models using the three product development constructs as predictors and the validation constructs as criteria. The results show that emergent nature is a useful construct that adds predictive value. The pattern of correlations with the constructs aids in our understanding of emergent nature. It correlates with and is significant with more constructs than the other two predictors. Emergent nature is significantly positively associated with reflection, openness to experience, verbal and visual processing and optimism. Emergent consumers see themselves as creative and possess a creative personality. Also as expected, the association with impulse buying is likely attenuated due to the high level of rational processing that emergent nature exhibits. In fact, the only model in which emergent doesn’t add anything over and above the other constructs is impulse buying. In contrast, dispositional innovativeness does not add additional predictive value in most cases, except for experiential thinking style and impulse buying. Compared to emergent consumers, innovators show a lower association with rational thinking style, reflection, openness, verbal and visual processing, creativity and optimism. Interestingly, dispositional innovativeness adds predictive value for creative personality but not self-perceived creativity. The reverse is true for lead users. There, self-perceived creativity adds predictive value, but not creative personality.
21 In table 6, we present a similar analysis using the SmartBox scales as the criteria. Lead user status is not as strongly associated with attitude and intention measures as emergent nature and DI. This may be because lead user status is domain-specific, not SmartBox specific. As before, the regression coefficients are attenuated compared to correlation coefficients because they include the other constructs in the model. Thus, each regression model tells us which constructs add predictive value over and above the other constructs and which variables are most important in accounting for variation in dependent variable. [Insert Table 6 About Here] Taken together, tables 1 through 6 offer evidence in support of the construct and predictive validity of emergent nature, both on its own and over and above dispositional innovativeness and domain-specific lead user status. To further investigate the relationships of each construct to the measured variables, we used median splits on each of the three constructs to create a 2 x 2 x 2 design. The eight mutually exclusive groups are arrayed in the columns of table 7. Since there we no interactions among the ―factors,‖ we fit a main-effects model to each of the validation summed scales to investigate what value emergent nature adds to each of the groups. Because there are no interactions, effects of the emergent nature group are additive and the tests give insight into what unique value the construct adds. The means and effect size statistics appear in table 7. Effect sizes between .01 and .06 are small, .06 to .13 moderate and above .13 large. Since only five consumer groups were of interest (High All, High Emerge, High Innovate, Hi Lead User, and Low All), we used a series of least significant difference tests with a p < .005 (.05/10) to test differences among pairs of means. The key result is that consumers in groups high in emergent
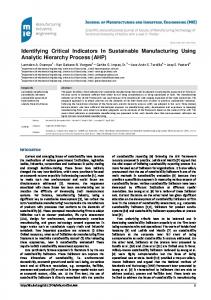
22 nature (e.g. High All and High Emerge) displayed significantly higher levels of experiential thinking style, rational thinking style, reflection, openness and visual thinking compared to innovators, lead users and the Low All consumer groups. One exception is that lead users are significantly higher than emergent consumers on impulse buying behavior. [Insert Table 7 About Here] Supplementing our main-effects analysis, we conclude our validation analysis with a canonical discriminant analysis of the eight concept development groups with the construct validation measures. The two-dimensional solution, accounting for 83 percent of the variance in the data, and both dimensions significant at p=.000, is displayed in figure 1. The first dimension (canonical correlation=.516) separates lead users and the low group on the negative side of the space from the High All and emergent consumers on the positive side. The second dimension (canonical correlation=.291) discriminates between innovators and emergent consumers. We interpret the center of the map as the average consumer. Again, we can examine this analysis to see what emergent nature adds to any of the combinations. Figure 1 shows that consumers with a high emergent nature are more creative, reflective, rational and visual compared to innovators and lead users. [Insert Figure 1 About Here] STUDY 2: CONCEPT DEVELOPMENT In study 2, we created six mutually exclusive concept development groups by classifying the 1124 respondents in study 1 according to their scores on the emergent nature, dispositional innovativeness, and lead user status scales. The six mutually exclusive groups were Low All (225 respondents below the median on all three scales), High All (208 respondents above the
23 median on all three scales), High Lead User (134 respondents above the median on lead user status and below the median on emergent nature and dispositional innovativeness), High Innovativeness (129 respondents above the median on dispositional innovativeness and below the median on emergent nature and lead user status) and High Emergent (84 respondents above the median on emergent nature and below the median on dispositional innovativeness and lead user status). We created a sixth group, Average, which consisted of 18 respondents who scored at the mean on all three scales. The Average group served as the control group6 . We randomly selected 50 respondents from the five groups Low All, High All, High Lead User, High Innovativeness, High Emergent, and all respondents from the Average group, and emailed each an invitation to participate in a follow-up study in which they would further develop the SmartBox product concept in an online bulletin board discussion group over a series of days. Respondents were told that up to eight participants would be selected for the study and that participation required registering by a specified Monday and participating a least twice a day at any time of the day and for as much or as little time as they chose on Tuesday, Wednesday and Thursday of that same week, followed by completing a short survey on Friday. Participants were instructed to ―further develop the SmartBox concept so that it will be successful in the marketplace as a home delivery solution for average consumers‖ and to ―develop the concept so that the SmartBox will be as appealing as possible to the average consumer for the home delivery of goods and that they will want to buy it.‖ Participants were encouraged to both build on others’ ideas and question those ideas. At the end of the week, each participant completed a set of items measuring their satisfaction with the final concept developed.
6
Note that the remaining respondents were classified in groups that were not relevant for the purposes of the study and were not utilized further.
24 A total of 35 respondents completed the study. See the Web Appendix section on ―Study 2 Sampling Details‖ for further information on the selection and implementation process. From Tuesday through Thursday, participants were quite active, visiting the online bulletin board an average of nine times each and posting an average of four concepts and 10.5 comments each. Participants developed and refined multiple concepts, and iterated until they had a single SmartBox concept that they believed would be the most appealing to the average consumer when introduced into the market. Following completion of the three-day concept
development task, each participant rated their trust with the other participants in the online group (four-item scale adapted from Ramsey and Sohi 1997), satisfaction with the experience (11-item scale adapted from Mano and Oliver 1993), satisfaction with the final SmartBox concept (fouritem scale adapted from Ganesan 1994), attitude toward the concept and new product novelty (seven-item scale adapted from Moorman 1995), post-task mood (Allen and Janiszewski 1989) and involvement (Swinyard 1993). All items were measured using seven-point scales. The final concept descriptions created by each group are presented in Appendix B. Mean scores on the measures for the six groups were not noticeably different; the average (across group) scores for trust (6.37), satisfaction with the experience (6.49), satisfaction with the concept (6.15), attitude toward the concept (6.19), new product novelty (1.89 with lower scores indicating more novel product concepts) and post-task mood (6.46) and involvement with the task (6.12) were uniformly high. It is clear that the online bulletin board concept development task was successful; participants in all groups trusted other group members, enjoyed the experience, were satisfied with the concept their group developed, has positive attitudes toward
25 the concept, perceived it to be novel, and reported a positive post-task mood and high involvement with the study. These final product concepts were used to test market reaction with a large group of realworld consumers.
STUDIES 3 AND 4: TESTING MARKET REACTION The six concepts produced by the Average, Low All, High All, High Lead, High Innovate, High Emerge groups in study 2 were evaluated in a within-group study by an independent sample of 631 native English-speaking adult consumers randomly selected from a global online panel. Sampling details are provided in the section ―Study 3 Sampling Details‖ in the Web Appendix. After completing several warm-up questions, participants were presented with the diagram and basic description of the SmartBox (see Appendix A). Participants were then instructed to carefully review the six different SmartBox concepts (see Appendix B), identified only by number (one through six). The order of the concepts was counterbalanced to control for order effects. (Six ―method‖ conditions were created so that in each condition one of the six concepts appeared first and the remaining concepts followed in random order.) After reviewing the six concepts, participants were asked to indicate which concept was the most and least appealing, and rated their attitudes toward each concept on four standard 7-point concept testing scales (bad/good, dislike/like, dull/dynamic and not useful/useful), their involvement with and knowledge of home delivery (adapted from Beatty and Talpade 1994), and their frequency of home delivery.
26 Concept Testing Results On average, the participants reported moderate levels of involvement with the general idea of home delivery (4.5 on a 7-point scale) and knowledge with the practice (3.94 on a 7-point scale). Only one-third of the respondents reported having goods delivered to their home once a week or more; 12.5% said they had only rarely or never had good delivered at home. As a group, our concept testing sample was neither particularly knowledgeable/experienced nor inexperienced/not knowledgeable regarding home delivery. Since two of the scale items were binary in nature and the other four items utilized a 7point scale, we first standardized each of the six items using the corresponding means and standard deviations computed across all the respondents. We then summed the standardized scores across the six-items to create a composite score for each respondent. The mean (standard deviation) composite scores for the six concepts developed by the Average, Low All, High All, High Lead, High Innovate, and High Emerge groups were respectively -1.273 (4.84), -1.592 (4.525), 0.414 (4.153), 1.189 (4.136), -0.605 (4.071), and 1.765 (4.12). Coefficient alphas for the six-item, new product concept testing scale for each of the six new product concepts were uniformly high (Average (.978), Low All (.975), High All (.976), High Lead (.977), High Innovate (.974), and High Emerge (.976)). A repeated measures ANOVA revealed a significant main effect (F=82.636, p = .000) of the concept development groups on the product concept testing scale for the concepts developed. To more formally test the concept testing results, we conducted a random effects regression analysis where the composite score of respondent i for concept j was the dependent variable. The independent variables were five dummy variables representing the six concepts. The left out dummy variable was the concept developed by the High Emerge group. Since we have multiple (six) observations from each respondent, we take into consideration individual
27 specific effects using the following random effects regression model (Raudenbush and Bryk 2002, p. 23).
CScoreij 0 1 ( Averagei ) 2 ( Lowi ) 3 ( Highi ) 4 ( Leadi ) 5 ( Inni ) j ij where, CScoreij = Composite score for concept i by respondent j Averagei = 1, if concept i was developed by the Average group, otherwise 0 Lowi = 1, if concept i was developed by the Low All group, otherwise 0 Highi = 1, if concept i was developed by the High All group, otherwise 0 Leadi = 1, if concept i was developed by the High Lead User group, otherwise 0 Inni = 1, if concept i was developed by the High Innovate group, otherwise 0 j = Respondent j’s specific effect on the composite score ~ Normal(0, 12 )
ij = error ~ Normal(0, 22 ) We test model significance by constructing a null model which includes the intercept (0) and the respondent specific effects (j); the corresponding log-likelihood test (Raudenbush and Bryk 2002, p. 58) shows that the full model performs significantly better than the corresponding null model. The results are given in table 8. We obtain similar results using OLS regressions which (i) take into consideration respondent level effects in other ways, i.e., either via 630 dummies for the 631 participants or by including the mean response for each respondent across the six concepts, and (ii) include five dummy variables representing the six new product concepts. [Insert Table 8 About Here] The left out category in table 8 is the concept developed by the ―High Emerge‖ group. We find that the concepts developed by the other five concept development groups were rated significantly lower (with p-values ranging from p < .0001 to p < .01) than the concept developed by the ―High Emerge‖ group. The marginal effect - or differential - was most significant (p < .0001) between the ―High Emerge‖ SmartBox concept and the one developed by the group that
28 was low on lead user status, innovativeness, and emergent nature, followed by the group that was average on all three characteristics. The concept developed by the high innovativeness group also did not fare well compared to the ―High Emerge‖ concept (p < .0001) and although the ―High all‖ group’s new product concept rating was closer to that of the ―High Emerge‖ group, it was still rated significantly lower (p < .0001). Note that the high lead user group’s concept was rated significantly better (p < .01) than the concepts produced by the ―Average‖, ―Low All‖, ―High All‖ and High Innovate product concept development groups. This result is consistent with the vast research on lead users as a key source for radical new product concepts. Quite interestingly, only one group was able to develop a SmartBox concept that received a significantly higher (p < .01) score than the high lead user group and that is the high emergent group. Finally, in an effort to further understand consumer preference for the most favorable product concepts, those developed by the lead user and high emergent groups, these two concepts were evaluated in a between-groups study by two independent samples of native English-speaking consumers randomly selected from a global online panel. For this study 4, a total of 95 consumers evaluated the lead user concept; 97 consumers evaluated the high emergent concept. Sampling details are provided in the section ―Study 4 Sampling Details‖ in the Web Appendix. Consumers evaluated the concept on fifteen attributes (easy to use, secure, prevents breakage, keeps cold foods cold, fun to use, can use anytime, is waterproof, sturdy, convenient, has a unique design, looks good, safe to use, saves money, saves time, and easy to install) on the 9-point scale does not describe at all—describes completely. Figure 2 provides the means for the two groups on each attribute. The concept developed by the high emergent group was rated significantly higher than the one developed by lead users on 11 attributes (p < .01, p < .05, and p < .1 on 4, 9, and 11 attributes respectively). There were no significant differences on the remaining four attributes. A two-factor solution
29 from a factor analysis of the attribute ratings explained 73.4% of the variation. (We obtained similar factor structures when we factor analyzed the ratings for each concept separately.) The two dimensions were clearly interpretable as ―utilitarian‖ (easy to use, secure, prevents breakage, keeps cold foods cold, can use anytime, is waterproof, sturdy, convenient, has a unique design, safe to use) and ―hedonic‖ (fun to use, looks good, saves money, saves time, easy to install). A regression analysis of the factor scores showed that the concept developed by the high emergent group was rated significantly higher than the lead user concept (p < .05) on both factors, indicating that the high emergent concept provided more utilitarian and hedonic benefits compared to the lead user concept. [Insert Figure 2 About Here] DISCUSSION We address two important questions in this paper. First, how can we identify emergent consumers? This answers who firms should talk to first when testing new consumer products that represent really new ideas. Second, how can emergent consumers be used at the concept testing stage to improve the new product development process and the opportunities for success with mainstream consumers? This answers how firms can extract and incorporate key feedback from emergent consumers. Our results suggest that the interplay among emergent consumers in a new product development context can produce a concept that will in general be more attractive to mainstream customers relative to one that is developed by other frequently used product development consumer segments, viz. typical consumers, consumers high on dispositional innovativeness, or consumers high on domain-specific lead user status. We believe this research provides strong support for the idea that emergent nature is a useful construct in the product development context. We have developed a highly reliable and valid scale to measure emergent nature in consumers and showed that the emergent nature
30 construct is empirically distinct from other product development constructs such as lead user status or dispositional innovativeness. We have also demonstrated that consumers high on emergent nature can develop product concepts that are perceived by typical consumers as significantly better than concepts developed by groups high on domain-specific lead user status or dispositional innovativeness. This result highlights how firms can ―co-opt‖ the competence of a particular set of consumers in developing radical new products that average consumers would find it appealing (Prahalad and Ramaswamy 2000). Because the concept developed by the high emergent group was rated significantly higher than the concepts developed by the five other concept development teams, including the high lead user group, we have strong support for the basic premise of this paper, namely, that high emergent consumer groups are a significant positive source for developing radical new product concepts and appear to help develop concepts that a typical consumer would find it more appealing than alternative concept development groups including the high lead user group. It is interesting to note that the new product concept developed by the ―High all‖ group was rated significantly (p < .0001) lower relative to the concepts developed by either the high lead user or the high emergent groups. This indicates that there is perhaps a downside of having new product development teams that score high on all characteristics. Both the concepts developed by the high lead user group and the high emergent group were rated significantly higher than the concepts developed by the other four groups (average, high innovativeness, low emergent/lead user/innovativeness, high emergent/lead user/innovativeness). The strong showing of the concept developed by the high lead user group reinforces research that argues that lead users represent a good segment for developing radical new product concepts (von
31 Hippel 1986). It also provides strong face validity to our results. We also note that we have developed a highly reliable and valid scale to measure domain-specific lead user status in a consumer context and marketing researchers may also find value in this scale. While the results are promising, they are not without limitations. We tested the product concepts via descriptions rather than actual prototypes. This is typical for many concept testing studies for which prototypes would be cost prohibitive. Clearly, it would be important to show that actual products based on concepts developed by consumers high in emergent nature are ultimately found more appealing and lead to greater sales, compared to those developed by other consumers groups. This is an area for future research and our paper provides the first step in being able to identify and use emergent consumers in developing radical new products. A related limitation is that the study was performed in a laboratory setting using small concept development groups. As our main aim was to demonstrate that emergent nature can be reliably and validly measured and that concepts developed by consumers high in emergent nature would be more appealing to typical consumers, a laboratory setting is appropriate for this first demonstration. Nonetheless, future research should seek to replicate our results in multiple field settings and with larger size groups. Thus, although work remains to be done, the idea of identifying and using emergent consumers in the development of really new products seems viable and worthy of the effort required to understanding it more fully. Firms struggle constantly to introduce innovations (Bayus, Griffin, and Lehmann, 1998). Our research suggests using a specific type of consumer in the product concept development phase, but many questions remain unaddressed. For example, can consumers high on emergent nature help firms solve the puzzle of the innovator’s dilemma (Christensen 1997) so that firms can do a better job of developing radical innovations that will eventually be adopted by the mainstream?
32 REFERENCES Baumgartner, Hans and Jan-Benedict E.M. Steenkamp (1996), ―Exploratory Consumer Buying Behavior: Conceptualization and Measurement,‖ International Journal of Research in Marketing, 13, 121-137. Bayus, Barry L, Abbie Griffin, Donald R. Lehmann (1998), ―From the special issue editors,‖ Journal of Product Innovation Management 15: 108–110. Beatty and Talpade (1994), ―Adolescent Influence in Family Decision Making: A Replication,‖ Journal of Consumer Research, 21 (September), 332-41. Borrus, Amy (2000), ―Leave It In The Box,‖ Business Week EBiz, December 11, EB82-83. Camazine, Scott, Jean-Louis Deneubourg, Nigel R. Franks, James Sneyd, Guy Theraulaz, Eric Bonabeau (2001), Self-Organization in Biological Systems, Princeton Studies in Complexity Series, Princeton University Press: Princeton, NJ. Chandy, R., G. J. Tellis. 1998. Organizing for Radical Innovation: The Overlooked Role of Willingness to Cannibalize. Journal of Marketing Research 35 (November) 474–487. Childers, Terry L., Michael J. Houston, and Susan E. Heckler (1985), ―Measurement of Individual Differences in Visual Versus Verbal Information Processing,‖ Journal of Consumer Research, 12 (September), 125-135. Christensen, Clay M. 1997. The Innovator’s Dilemma. Boston, MA: Harvard Business School Press. Dahan, Ely and John R. Hauser (2002), ―The Virtual Customer,‖ Journal of Product Innovation Management, 19 (5), 332-353. Dahan, Ely and V. Srinivasan (2000), ―The Predictive Power of Internet-Based Product Concept Testing Using Visual Depiction and Animation,‖ Journal of Product Innovation Management, 17 (2), 99-110. Dahl, Darren W. and Page Moreau (2002), ―The Influence and Value of Analogical Thinking During New Product Ideation,‖ Journal of Marketing Research, 39 (February), 47-60. Economist. 1999. A Survey of Telecommunications. October 9, 1-36. Epstein, S. (1994), ―Integration of the Cognitive and the Psychodynamic Unconscious,‖ American Psychologist, 49, 709-724. Epstein, S., Pacini, R., Denes-Raj, V., & Heier, H. (1996). Individual differences in intuitiveexperiential and analytical-rational thinking styles, Journal of Personality and Social Psychology, 71, 390-405.
33 Feick, Lawrence and Linda Price (1987), ―The Market Maven: A Diffuser of Marketplace Information,‖ Journal of Marketing, 51, 83-97. Fenigstein, A., M. Scheier and A. Buss (1975), ―Public and Private Self-Consciousness: Assessment and Theory,‖ Journal of Consulting and Clinical Psychology, 36:1,241-250. Goldenberg, J., Mazurksy, D., and Solomon, S. (1999), ―Toward Identifying the Inventive Templates of New products: a Channeled Ideation Approach,‖ Journal of Marketing Research, 36 (May), 200-210. Goldenberg J. and Efroni, S. (2001), ―Using Cellular Automata Modeling of Emergence of Innovations,‖ Technological Forecasting and Social Change,‖ 68, 293-308. Goldenberg, J. Lehmann, R. D., and Mazursky, D. (2001), ―The Idea Itself and the Circumstances of its Emergence as Predictors of New Product Success,‖ Management Science, 47 (1), 69-84. Goldenberg, J. and D. Mazursky (2002), Creativity in Product Innovation, Cambridge: Cambridge University Press. Gough, Harrison G. (1979), ―A Creative Personality Scale for the Adjective Check List,‖ Journal of Personality and Social Psychology, 37(8), 1398-1405. Green, Paul E., Abba M. Krieger, and Terry G. Vavra (1997), ―Evaluating New Products,‖ Marketing Research, Winter, 12-21. Griffin, Abbie (1996), Obtaining Information from Consumers, PDMA Handbook of New Product Development, Wiley: New York, NY, 154-55. Hoeffler, S. (2003), ―Measuring Preferences for Really New Products,‖ Journal of Marketing Research, 40 (November), 406-420. Kline, Paul (2000), The Handbook of Psychological Testing. Second Edition. London and New York: Routledge. Kopalle, Praveen and Donald R. Lehmann (2001), ―Strategic Management of Expectations: Role of Disconfirmation Sensitivity and Perfectionism, Journal of Marketing Research, 38 (August), 386-394. Lilien, Gary L., Pamela D. Morrison, Kathleen Searls, Mary Sonnack, and Eric von Hippel (2001), ―Performance Assessment of the Lead User Idea Generation Process for New Product Development,‖ ISBM Report 4-2001.
34 Lilien, Gary L., Pamela D. Morrison, Kathleen Searls, Mary Sonnack, and Eric von Hippel (2002), ―Performance Assessment of the Lead User Idea-Generation Process for New Product Development,‖ Management Science, 48 (8), 1042-1059. McCrae, R. R. (1987), ―Creativity, Divergent Thinking, and Openness to Experience,‖ Journal of Personality and Social Psychology, 52, 1258-1265. Midgley, David F. and Grahame R. Dowling (1978), ―Innovativeness: The Concept and Its Measurement," Journal of Consumer Research, Vol.4, March, 229-42. Moorman, Christine (1995), ―Organizational Market Information Processes: Cultural Antecedents and New Product Outcomes,‖ Journal of Marketing Research, 32 (August), 318-335. Morrison, Pamela D., John H. Roberts, Eric von Hippel (2000), ―Determinants of User Innovation and Innovation Sharing in a Local Market,‖ Management Science, 46 (12), 113-1527. Novak, Thomas P. and Donna L. Hoffman (2007), ―The Fit of Thinking Style and Situation: New Measures of Situation-Specific Experiential and Rational Cognition,‖ working paper. Novak, Thomas P., Donna L. Hoffman, and Yiu-Fai Yung (2000), ―Measuring the Customer Experience in Online Environments: A Structural Modeling Approach,‖ Marketing Science, Winter, 19(1), 22-44. Norris, P. and S. Epstein (2003a), ―The Investigation of Some Fundamental Issues Concerning Rational-Analytical and Intuitive-Experiential Thinking Styles with a Short Form of the Rational-Experiential Inventory,‖ working paper. Norris, P. and S. Epstein (2003b), ―Objective Correlates of Experiential Processing.‖ Working paper. Pacini, R., & Epstein, S. (1999). The relation of rational and experiential information processing styles to personality, basic beliefs, and the ratio-bias phenomenon. Journal of Personality and Social Psychology, 76, 972-987. Prahalad, C. K. and V. Ramaswamy (2000) ―Co-opting Customer Competence,‖ Harvard Business Review, 78 (1), 79-87. Rogers, Everett M. (2003), Diffusion of Innovations. Fifth Edition. New York: Free Press. Rook, Dennis W. and Robert J. Fisher (1995), ―Normative Influences on Impulsive Buying Behavior,‖ Journal of Consumer Research, 22 (December), 305-313.
35 Sloman, Steven A. (1996), ―The Empirical Case for Two Systems of Reasoning,‖ Psychological Bulletin, 119(1), 3-22. Smith, Eliot R. and Jamie DeCoster (2000), ―Dual-Process Models in Social and Cognitive Psychology: Conceptual Integration and Links to Underlying Memory Systems,‖ Personality and Social Psychology Review, 4(2), 108-131. Steenkamp, Jan-Benedict E.M. and Katrijn Gielens (2003), ―Consumer and Market Drivers of the Trial Rate of New Consumer Products,‖ Journal of Consumer Research, 30 (December), 368-384. Steenkamp, Jan-Benedict E.M., Frenkel ter Hofstede and Michel Wedel (1999), ―A CrossNational Investigation into the Individual and National-Cultural Antecedents of Consumer Innovativeness,‖ Journal of Marketing, 63 (April), 55-69. Stanovich, Keith E. and Richard F. West (1997), ―Reasoning Independently of Prior Belief and Individual Differences in Actively Open-Minded Thinking,‖ Journal of Educational Psychology, 89(2), 342-357. Tam, Pui-Wing (2002), ―Delivering the Goods: What’s Missing From E-Commerce? How About a Box?,‖ Wall Street Journal Online, February 11. Torrance, P.E. (1990), Manual for Scoring and Interpreting Results. Torrance Test of Creative Thinking. Verbal, Forms A and B. Bensenville, IL: Scholastic Testing Services. Trapnell, Paul D. and Jennifer D. Campbell (1999), ―Private Self-Consciousness and the FiveFactor Model of Personality: Distinguishing Rumination from Reflection,‖ Journal of Personality and Social Psychology, 76(2), 284-304. Urban, Glen and Eric von Hippel (1988), ―Lead User Analyses for the Development of New Industrial Products,‖ Management Science, 34(5), May, 569-582. Vojak, Bruce A., Abbie Griffin, Raymond L. Price, and Konstantin Perlov (2006), ―Characteristics of Technical Visionaries as Perceived by American and British Industrial Physicists,” R&D Management, 36 (1), 17-26. Von Hippel, E. (1986), ―Lead Users: A Source of Novel Product Concepts,‖ Management Science 32(7), 791–805. Von Hippel, E., and R. Katz (2002), ―Shifting Innovation to Users via Toolkits,‖ Management Science, 48 (7), 821-833. Wickens, T.D. (1989). Multiway Contingency Tables Analysis for the Social Sciences. Hillsdale, NJ: LEA, Associates.
36
TABLE 1 FINAL ITEMS FOR EMERGENT NATURE AND LEAD USER SCALES Emergent Nature When I hear about a new product or service idea, it is easy to imagine how it might be developed into an actual product or service. Even if I don’t see an immediate use for a new product or service, I like to think about how I might use it in the future. When I see a new product or service idea, it is easy to visualize how it might fit into the life of an average person in the future. If someone gave me a new product or service idea with no clear application, I could ―fill in the blanks‖ so someone else would know what to do with it. Even if I don’t see an immediate use for a new product or service, I like to imagine how people in general might use it in the future. I like to experiment with new ideas for how to use products and services. I like to find patterns in complexity. I can picture how products and services of today could be improved to make them more appealing to the average person. Domain-Specific Lead User Other people consider me as ―leading edge‖ with respect to home delivery of goods. I have pioneered some new and different ways for home delivery of goods. I have suggested to stores and delivery services some new and different ways to deliver goods at home. I have participated in offers by stores to deliver goods to my home in new and different ways. I have come up with some new and different solutions to meet my needs for the home delivery of goods.
37
TABLE 2 CONSTRUCT RELIABILITY IN THE STUDY 1 CALIBRATION AND VALIDATION SAMPLES Calibration Sample (n=754) Number of Items: 8
Validation Sample (n=370)
Mean Scale: Valid Coefficient (Std. Coefficient Range alpha Dev) alpha Emergent Nature (8, 56) .929 36.76 .937 (9.74) Dispositional (8, 56) 8 .830 33.43 .801 Innovativeness (8.50) Domain-specific Lead (5, 35) 5 .931 14.48 .930 User (7.66) *All items were measured on 7-point strongly disagree-strongly agree scales.
Mean (Std. Dev.) 37.11 (9.88) 33.89 (7.86) 14.86 (7.84)
38 TABLE 3 MEANS OF STUDY 1 SUMMED SCALES AND MEASURED VARIABLES FOR THE COMBINED (N=1124) SAMPLE Items
Valid Mean Standard Coefficient Measure*: Range Deviation Alpha Emergent Nature 8 (8,56) 36.88 9.78 .93 Dispositional Innovativeness 8 (8,56) 33.58 8.30 .82 Domain-Specific Lead User 5 (5,35) 14.61 7.72 .93 Experiential Thinking Style 12 (12,60) 43.39 6.94 .86 Rational Thinking Style 12 (12,60) 44.42 7.15 .85 Reflection 12 (12,60) 40.64 9.89 .92 Openness to Experience 12 (12,60) 41.96 7.28 .77 Verbal Processing 11 (11,55) 39.22 6.44 .80 Visual Processing 11 (11,55) 39.50 5.96 .76 Creativity (self-perceived) 3 (3,15) 11.54 2.85 .94 Creative Personality* 30 (-12,18) 4.57 3.87 .78 Optimism 2 (2,14) 10.33 2.94 .91 Impulse Buying 9 (9,63) 34.29 12.69 .93 Attitude toward SmartBox 4 (4,28) 22.29 5.34 .93 Utilitarian attitude 5 (5,35) 27.76 6.54 .91 Hedonic attitude 5 (5,35) 23.58 6.41 .91 Novel product concept 7 (7,49) 39.03 8.37 .94 Adopt if given free 1 (1,7) 5.30 1.67 Use if given free 1 (1,7) 5.50 1.61 Order, if given SmartBox 1 (1,7) 5.16 1.71 Max price willing to pay 1 (1,5) 2.54 1.27 SmartBox radical innovation 1 (1,7) 5.02 1.60 SmartBox radical innovation 2 (2,14) 9.73 3.10 .90 SmartBox disruptive 1 (1,7) 3.21 1.70 Attractive in current form 1 (1,7) 4.77 1.45 Time before consumer buys 1 (1,6) 2.01 1.04 Value of investment in 10 yrs 1 (1,6) 4.32 1.34 Picture it developed in future 4 (4,28) 23.13 4.87 .94 Ways to improve SmartBox 1 (1,20) 3.18 2.97 Category involvement 3 (3,21) 14.16 4.98 .95 Category knowledge 3 (3,21) 12.79 5.20 .94 Category actual use 1 (1,6) 3.04 1.24 *All measures used seven-point rating scales except the following: Rational and Experiential Thinking Style and Verbal and Visual Processing Style and self-perceived creativity were measured on five-point definitely false-definitely true scales. Creative personality was measured by means of a 30-item check-list. Private self-consciousness and openness to experience were measured on five-point strongly disagree-strongly agree scales.
39
TABLE 4 CORRELATIONS AND MEANS OF EMERGENT NATURE, DISPOSITIONAL INNOVATIVENESS AND DOMAIN-SPECIFIC LEAD USER STATUS WITH DEMOGRAPHICS Correlations Emergent Nature Age Education Men Women Effect size p2 (p-value)
DomainDispositional Specific Lead Innovativeness User Status
-.076* .085**
-.095** .010
-.098** .073*
37.81 (9.03) 36.18 (10.26) .007 (.006)
15.83 (7.73) 13.70 (7.59) .019 (.000)
32.06 (7.5) 34.71 (8.68) .025 (.000)
Australia 34.73 (9.30) 12.96 (6.77) 33.17 (7.35) Canada 35.08 (9.54) 13.33 (7.06) 32.18 (8.04) United Kingdom 36.77 (9.83) 14.51 (8.59) 36.57 (8.51) United States 37.33 (9.99) 14.82 (7.80) 33.88 (8.54) All other countries 39.87(7.45) 18.01 (8.08) 33.01 (6.57) 2 .017 (.001) .021 (.000) .012 (.010) Effect size p (p-value) **Correlation is significant at the 0.01 level. * Correlation is significant at the 0.05 level. All tests are two-tailed.
40
TABLE 5 CORRELATIONS AND REGRESSION RESULTS OF EMERGENT NATURE (E), DISPOSITIONAL INNOVATIVENESS (DI) AND DOMAIN-SPECIFIC LEAD USER STATUS (LU) WITH GENERAL VALIDATION SCALES Standardized Regression Coefficient (p-value) for Dependent Variable: Model R2
Correlations E Experiential Thinking .166 Style
DI
LU
DI
LU
.069 .140 .196 -.103 (.000) (.000) (.001) .155 .412 .014 -.066 Rational Thinking Style .389 .148 .108 (.000) (.631) (.029) .164 .351 .038 .077 Reflection .397 .175 .230 (.000) (.196) (.01) .170 .348 .174 -.091 Openness .372 .281 .085 (.000) (.000) (.003) .033 .121 .236 .166 Verbal Processing .309 .255 .160 (.000) (.000) (.288) -.055 .112 .327 .062 Visual Processing .326 .168 .092 (.000) (.04) (.075) .222 .406 .045 .095 Creativity (self-perceived) .462 .204 .272 (.000) (.112) (.001) .044 .139 .308 .095 Creative Personality .360 .212 .189 (.000) (.001) (.146) .037 .081 .223 .090 Optimism .270 .175 .146 (.000) (.003) (.240) -.005 .292 .108 .113 Impulse Buying .145 .310 .162 (.890) (.000) (.000) *All correlations, except as noted, are significant at the 0.01 level (2-tailed). All regression models are significant at the .000 level. Notes: E = Emergent nature, DI = Dispositional innovativeness, LU = Domain specific lead user .227
-.011 ns
E
41 TABLE 6 CORRELATIONS OF EMERGENT NATURE (E), DISPOSITIONAL INNOVATIVENESS (DI) AND DOMAIN-SPECIFIC LEAD USER STATUS (LU) WITH SMARTBOX SCALES Standardized Regression Coefficient (pvalue)
Correlations E Attitude toward SmartBox .220 Utilitarian attitude .227 Hedonic attitude .228 .183 Novel product concept
DI .189 .211 .242 .208
Model R2
LU
E
DI
LU
.119 .069* .242 .015n s .213 .186 .228 .122 .099
.164 (.000) .189 (.000) .093 (.005) .157 (.000)
.126 (.000) .151 (.000) .179 (.000) .166 (.000)
.029 (.363) -.036 (.253) .172 (.000) -.080 (.012)
.063 .072 .106 .062
.141 (.000) .196 (.000) .167 (.000) .109 (.001) .088 (.010)
.158 (.000) .178 (.000) .144 (.000) .084 (.008) .098 (.002)
.127 (.000) .073 (.000) .133 (.000) .062 (.055) .045 (.163)
.099 .116 .109 .037 .030
.100 (.003) .130 (.000) -.092 (.007) -.060 (.060)
.071 (.028) .068 (.038)
.050 .014
.085 (.012) .072 (.021) -.012 (.725) -.073 (.021)
.165 (.000) -.067 (.040)
.060 .013
Adopt .249 Use .289 Order .273 Max price willing to pay .165 SmartBox radical .141 innovation Radical Scale .175 -.085 SmartBox disruptive
.230 .260 .226 .133 .137
Attractive in current form .179 Time before consumer -.066* buys Vale of investment in 10 .155 yrs Picture it developed in .281 future Ways to improve .212 Smartbox Category involvement .379 Category knowledge .413 Category actual use .311
.130 -.089
.135 .019n s .213 -.085
.160
.088
.103 (.002)
.120 (.000)
.024 (.464)
.037
.220
.143
.221 (.000)
.137 (.000)
.027 (.396)
.096
.089
.094
.204 (.000)
.016 (.611)
.006 (.844)
.045
.267 .259 .251
.432 .541 .376
.193 (.000) .188 (.000) .136 (.000)
.142 (.000) .115 (.000) .152 (.000)
.327 (.000) .443 (.000) .292 (.000)
.252 .347 .190
.177 -.080
*Correlations marked with an asterisk are significant at the 0.05 level. All other correlations are significant at p=0.01 unless otherwise noted. All tests are two-tailed. All regression models are significant at the .000 level.
42
TABLE 7 MAIN-EFFECTS MODEL RESULTS FOR MEANS ON VALIDATION SUMMED SCALES BY MEDIAN SPLITS OF EMERGENT NATURE (E), DISPOSITIONAL INNOVATIVENESS (DI) AND DOMAIN-SPECIFIC LEAD USER STATUS (L)
Experiential Thinking Style Rational Thinking Style Reflection Openness Verbal Processing Visual Processing Creativity (selfperceived) Creative Personality Optimism Impulse Buying
Effect size p2
8 Hi E, Hi DI, Hi L n=208 High All
5 Hi E, Lo DI, Lo Lead n=84
3 Lo E, Hi DI, Lo Lead n=129
2 Lo E, Lo DI, Hi L n=134
1 Low E, DI, L n=225
7 Hi E, Hi DI, Lo L n=125
6 Hi E, Lo DI, Hi L n=140
4 Lo E, Hi DI, Hi L n=79
High Emerge
High Innovate
Hi Lead User
Low All
45.63
44.23
43.29
40.78
42.30
High Emerge & Innovate 45.76
High Emerge & Lead User 41.69
High Innovate & Lead User 43.48
.063 (.000)
48.05
47.18
42.27
40.73
42.38
46.02
45.14
43.68
.125 (.000)
45.39 45.88 42.50 41.60 13.17
43.77 44.11 39.17 41.14 12.01
37.79 41.21 38.45 38.67 10.53
38.13 38.72 36.49 37.04 10.38
36.48 38.78 37.30 38.03 10.16
41.69 44.90 40.69 40.94 12.4
42.70 41.34 39.40 40.33 12.61
40.25 41.61 39.33 38.24 11.05
.110 (.000) .143 (.000) .095 (.000) .075 (.000) .174 (.000)
6.32 11.32 38.19
5.82 10.80 28.79
3.91 10.01 36.12
3.39 9.93 34.15
2.64 9.42 30.00
5.24 10.94 36.61
5.35 10.86 33.5
4.77 10.22 37.04
.119 (.000) .067 (.000) .064 (.000)
(p-value)
43 TABLE 8 STUDY 3: RANDOM EFFECTS REGRESSION RESULTS Dependent Variable: Respondent j’s Composite Score of Concept i (t-values in parentheses)
Independent Variables Intercept Averagei: Concept i developed by the Average Group Lowi: Concept i developed by the Low All Group Highi: Concept i developed by the High All Group Leadi: Concept i developed by High Lead Users Inni: Concept i developed by High Innovators FIT STATISTICS Sample Size -2 Log Likelihood AIC (Akaike Information Criterion) BIC (Bayesian Information Criterion) -2 Log Likelihood of the Null Model Chi-Square Statistic (p-value)
Coefficient 1.7647 (10.27) -3.0378 (-14.38) -3.3565 (-15.89) -1.3505 (-6.39) -0.5757 (-2.73) -2.3695 (-11.22) 3786 21442.0 21446.0 21454.9 21822.9 380.9 (< .001)
44
FIGURE 1 CANONICAL DISCRIMINANT ANALYSIS OF THE EIGHT CONCEPT DEVELOPMENT GROUPS WITH CONSTRUCT VALIDATION MEASURES
Innovator Hi Innovator + Hi Lead User
Impulse Buyer
Hi Emerge + Hi Innovator
Experiential
Openness
Verbal
High ALL
Low All Lead User
Optimism Visual Rational Creative Person. Reflection
Emergent Creativity
Hi Emerge + Hi Lead User
45 FIGURE 2 Attribute ratings of Emergent and Lead User Group Concepts
46 APPENDIX A: The SmartBox Product Concept used in Study 1 Now we’d like you to evaluate a new product concept called the ―SmartBox.‖ The SmartBox is depicted in the drawing below. Regardless of whether it’s laundry, dry cleaning, groceries or most anything else, the SmartBox should make home pickup and delivery secure and convenient even if no one is home. Presuming you had a choice of many styles, sizes and installation locations, please imagine that a device similar to this is on, by, or close to your home – or, if you live in an apartment, that a cluster of them is by your building. Suppose that FedEx, UPS and the Postal Service as well as grocers, drycleaners and anyone else you want to authorize could use it to make secure pickups and deliveries. Built-in intelligence enables authorized deliveries only and sends notification to both consumer and merchant whenever a delivery is made. Thinking about the SmartBox concept, please answer the questions below.
47 Appendix B: SmartBox Basic Description and Final Concepts Basic Description: The SmartBox is a new device that enables secure and convenient delivery and home pickup of almost anything that can be delivered to the home (for example, groceries and laundry and many other things). Many different styles are possible and there are many different locations the SmartBox could be located in many different types of dwellings. The device is "smart" because it needs a code to be opened, so only people with authorization (like the person at home and the delivery person) can open it. It also tracks who delivered what and when and keeps a record of deliveries. Final Concepts: Group 1: AVERAGE The SmartBox should be very easy to install, and big enough to fit a few bags of groceries in it at least. It should be easy to get access to for the delivery person and the person at home by having a scanner for the delivery person, and a code the person at home enters to open it. The main thing is convenience; if the SmartBox is not a convenience no one will use it. It must be easy to use so that most any age can do it, so there can't be a lot of instructions one wants to get access or to install it. Group 2: LOW ALL The Smartbox comes in a variety of sizes with a heating/cooling option. The door will be locked with a code needed to unlock it. Owners give the code to people they want to have access/deliver items. They can change the code whenever needed and can check delivery information on the Internet. The SmartBox also has an option for an additional unlocked door, if wanted by the customer. Group 3: HIGH ALL The SmartBox box is securely mounted to a structure to ensure that it can't be pried off its mounting and stolen. It is a heavy duty-sturdy unit w/optional mountings for placement with styles, sizes and colors available to the consumer. It is rust resistant, has air and watertight seals, and a self latching door with adjustable/removable shelving and hooks. There is also security lighting, a delivery alert system, a camera and a modification kit for consumers with special needs. The SmartBox also has an optional refrigeration unit for those using it for groceries. There is also adjustable sturdy shelving inside the unit so it can accommodate packages expected for delivery.
48 Group 4: HIGH LEAD For new homes, the SmartBox can be built to blend with the appearance of the home. Shelves inside the unit collapse upward to have room inside for large items. The SmartBox can send an email or text message to a mobile phone when a delivery has occurred. The SmartBox can also be built with a door opening from within the home so that it can be opened from inside. It has a freezer/refrigerator section for cold or frozen food deliveries and a built-in clothes hanger rack for laundry deliveries. It is easy for the owner to change the security code; the SmartBox has an alarm system that either sounds an audible alarm or sends a signal to the police in the event a thief tries to gain access.
Group 5: HIGH INNOVATE The SmartBox can be insulated for perishables and is available in various designs. There is a SmartBox ―professional edition‖ that is customizable for businesses. The SmartBox is connected to email or wireless communication to the cell phone, sending an alert when packages have been delivered. A keypad allows all authorized "users" to easily access it. Authorized users would be given the code by the owner upon purchase of the item to be delivered. The SmartBox is sturdy, reliable, but not a permanent fixture.
Group 6: HIGH EMERGE The SmartBox is offered in various sizes and is accessible from either the outside or inside of the home or apartment for convenience in retrieving deliveries. Each delivery is uniquely computer coded with a randomly generated computer code that expires soon after the delivery person accesses the SmartBox; retrieval of items by the owner is also via a unique code, with the option of a using key as well, again for convenience. The SmartBox is inconspicuous, fire proof, vandalism proof, rust resistant, and is available with options such as multiple compartments, refrigeration and an alarm mechanism similar to car alarms. The SmartBox is affordable and has purchase incentives and installation incentives for first-time customer
Web Appendix
49
WEB APPENDIX PILOT STUDY We conducted a pilot study using 93 consumers to measure a set of constructs related to innovativeness (exploratory acquisition of products, exploratory information seeking, dispositional innovativeness, impulse buying, and market mavenism) and information processing style (experientiality, rationality, and visual/verbal processing). Coefficient alphas and measurement scales for the various measures are provided in Table W1.
Table W1: Coefficient Alphas for Scales Used in Pilot Study Scale: Alpha: Innovativeness Scales: Exploratory Acquisition of .877 Products (EAP) Exploratory Information .825 Seeking (EIS) Dispositional Innovativeness (DI)
.852
Impulse Buying (IB)
.926
Market Mavenism (MM)
.573
Processing Scales: Experiential Ability
.795
Source:
Baumgartner, Hans and Jan-Benedict E.M. Steenkamp (1996), ―Exploratory Consumer Buying Behavior: Conceptualization and Measurement,‖ International Journal of Research in Marketing, 13, 121-137.
Steenkamp, Jan-Benedict E.M. and Katrijn Gielens, ―Consumer and Market Drivers of the Trial Probability of New Consumer Packaged Goods,‖ Journal of Consumer Research, 2003. Rook, Dennis W. and Robert J. Fisher (1995), ―Normative Influences on Impulsive Buying Behavior,‖ Journal of Consumer Research, 22 (December), 305-313. Steenkamp, Jan-Benedict E.M. and Katrijn Gielens, ―Consumer and Market Drivers of the Trial Probability of New Consumer Packaged Goods,‖ Journal of Consumer Research, 2003. Market mavenism was measured by four items, adapted from Feick and Price (1987). Original scale has 7 items Norris, Paul and Seymour Epstein (2003a), ―The Investigation of Some Fundamental Issues Concerning
Web Appendix (EXPA) Experiential Favorability (EXPF) Rational Ability (RATA) Rational Favorability (RATF) Verbal Processing (VERBAL) Visual Processing (VISUAL)
50
.761
Rational-Analytical and Intuitive-Experiential Thinking Styles with a Short Form of the Rational-Experiential Inventory,‖ working paper.
.814 .804 .794 .722
Childers, Terry L., Michael J. Houston, and Susan E. Heckler (1985), ―Measurement of Individual Differences in Visual Versus Verbal Information Processing,‖ Journal of Consumer Research, 12 (September), 125-135.
An exploratory principal component analysis (Table W2) showed that innovativeness, rational processing style, and experiential processing style are independent constructs. While previous research (Pancini and Epstein 1999) has demonstrated that rational and experiential processing represent orthogonal dimensions, this is the first empirical evidence that additionally shows that experiential and rational processing styles are both independent of innovativeness. Thus, experiential processing style, which we theorize is a strong correlate with the construct of a consumer’s emergent nature, is a separate dimension from innovativeness as defined by the scales in Table W1. We also note that verbal and visual processing both correlate with innovativeness, and, consistent with prior theory, verbal processing correlates with a rational processing style and visual processing with an experiential processing style.
Web Appendix
51 Table W2: PCA for Innovativeness and Processing Style Scales
DI Dispositional Innovativeness (DI) EAP Exploratory Acquisition of Products (EAP) EIS Exploratory Information Seeking (EIS) MM Market Mavenism (MM) IB Impulse Buying (IB) RATF Rational Favorability (RATF) RATA Rational Ability (RATA) VERBAL Verbal Processing (VERBAL) VISUAL Visual Processing (VISUAL) EXPF Experiential Favorability (EXPF) EXPA Experiential Ability (EXPA)
Component: 1 2 3 Innova- Rational- Experientiveness ity tiality .808 .126 .133 .800 .136 .748 .177 .634 .254 .591 -.310 .169 .111 .892 .844 .133 .428 .591 .315 -.382 .381 .901 .150 .136 .887
STUDY 1 SAMPLING DETAILS The study 1 experiment was programmed and administered via a Web-based facility for fielding online research. A total of 8300 respondents were randomly selected from an online panel for study 1. Up to three email notifications over a one week period were used to secure cooperation, and the chance to win a $500 prize drawing served as an incentive. Respondents were directed to a login screen for the Web-based experiment. Of the 8300 respondents that were invited, 1410 completed study 1, for a cooperation rate of 17%. Of these, 86 respondents who either spent less than five minutes or more than 75 minutes on the entire study were eliminated. This produced an initial analysis sample of 1324 respondents. We eliminated an additional 200 respondents who indicated that English was not their native language for a final analysis sample size of 1124 respondents. Of the 754 respondents in the calibration sample in study 1, 57% were female; 24% had a high school education or less, 34% had some college education, and 42% had college degrees or higher; and, 26% were between ages 18 and 30, 41%
Web Appendix
52
were between ages 31 and 45, and 33% were over age 45. Respondents represented 21 different countries with 62% from the United States, 20% from Canada, 7% from Australia and 4% were from the United Kingdom. As a group, respondents tend to be experienced Internet users: 55% use the Internet 20 hours a week or more, 77% started using the Internet more than five years ago, 77% have high-speed connections to the Internet (cable, DSL, satellite, etc.), 78% use the Internet to browse, research or compare products a few times a week or more, and only 13% rarely or never use the Internet to purchase products and pay for those products online. The 370 respondents in the validation sample in study 1 were highly similar demographically to the respondents in the calibration sample: 58% were female; 20% had a high school education or less, 35% had some college education, and 45% had college degrees or higher; and, 34% were between ages 18 and 30, 39% were between ages 31 and 45, and 28% were over age 45. Respondents represented 17 different countries with 70% from the United States, 14% from Canada, 6% from Australia and 5% were from the United Kingdom. As a group, respondents tend to be experienced Internet users: 56% use the Internet 20 hours a week or more, 77% started using the Internet more than five years ago, 77% have high-speed connections to the Internet (cable, DSL, satellite, etc.), 75% use the Internet to browse, research or compare products a few times a week or more, and only 10% rarely or never use the Internet to purchase products and pay for those products online.
STUDY 2 SAMPLING DETAILS The study 2 online bulletin board discussion group study was programmed and administered via a Web-based facility for fielding online research. Participants from study 1 were grouped according to the procedures described in the text and then fifty respondents from
Web Appendix
53
each group were randomly selected, emailed and invited to participate in an online bulletin board study involving the further development of a concept for the SmartBox. Participants were informed that the study represented an important followup to the SmartBox study they participated in previously (study 1). The first eight individuals in each group who responded to the email invitation were selected to participate in study 2. A total of 35 respondents completed the study, six in the Low All group, six in the High All group, five in the High Lead User group, five in the High Innovate group, six in the High Emergent group and seven in the Average group. We had nearly equal numbers of male and female participants (51% female; 49% male); 14% had a high school education or less, 37% had some college education, and 49% had college degrees or higher; 17% were between the ages of 18-30, 52% were between ages 31 and 45 and 31% were over age 45. The study was restricted to native English speaking respondents: 69% were from the United States, 23% from Canada and 8% from the United Kingdom. Each participant received a payment of $50 for completing the study. All six groups were conducted in six separate, but identical bulletin boards. The groups had no knowledge that other bulletin board groups were also in progress. The study was conducted asynchronously. Participants could log on at any time of their choosing and post their ideas. The bulletin board reflected a detailed running log of the participants’ contributions. The online bulletin board study began with the Basic Description of the SmartBox shown in Appendix B. Each participant within a group posted ideas that would help further develop the SmartBox concept. Participants had the option of rating each idea on a seven-point scale, commenting on ideas, sorting ideas by ratings, and building on ideas they liked the best. Participants registered for the online bulletin board study on Monday; the bulletin board was opened at 8 AM CST on Tuesday and then closed at midnight CST on Thursday. At the end of
Web Appendix
54
each day, participants received an email summarizing that day’s activity (i.e. idea posts and comments) to date, and the bulletin board itself had a dynamically updated summary of the activity. Participants responded to a set of scale items on Friday.
STUDY 3 SAMPLING DETAILS The study 3 experiment was programmed and administered via a Web-based facility for fielding online research. A total of 3315 native English speaking respondents from the United States were randomly selected from an online panel for study 3. Respondents who had participated in studies related to the topic in this research were excluded from the sampling frame. Up to three email notifications over a five-day period were used to secure cooperation, and the chance to win a $300 prize drawing served as an incentive. Respondents were directed to a login screen for the Web-based experiment. Of the 3315 respondents that were invited, 631 completed study 3, for a cooperation rate of 19%. Of the 631 respondents in study 3, 65% were female; 19% had a high school education or less, 38% had some college education, and 43% had college degrees or higher; and, 22% were between ages 18 and 30, 38% were between ages 31 and 45, and 40% were over age 45. As a group, respondents tend to be experienced Internet users: 62% use the Internet 20 hours a week or more, 86% started using the Internet more than five years ago, 81% have high-speed connections to the Internet (cable, DSL, satellite, etc.), 79% use the Internet to browse, research or compare products a few times a week or more, and only 8% rarely or never use the Internet to purchase products and pay for those products online.
Web Appendix
55 STUDY 4 SAMPLING DETAILS
The study 4 experiment was programmed and administered via a Web-based facility for fielding online research. A total of 1067 native English speaking respondents from the United States were randomly selected from an online panel for study 4. Respondents who had participated in studies related to the topic in this research were excluded from the sampling frame. Up to three email notifications over a five-day period were used to secure cooperation, and the chance to win a $300 prize drawing served as an incentive. Respondents were directed to a login screen for the Web-based experiment. Of the 1067 respondents that were invited, 192 completed study 4, for a cooperation rate of 18%. Of the 192 respondents in study 4, 41% were female; 17.5% had a high school education or less, 35% had some college education, and 47.5% had college degrees or higher; and, 16% were between ages 18 and 30, 35% were between ages 31 and 45, and 49% were over age 45. As a group, respondents tend to be experienced Internet users: 60% use the Internet 20 hours a week or more, 85% started using the Internet more than five years ago, 81% have high-speed connections to the Internet (cable, DSL, satellite, etc.), 77% use the Internet to browse, research or compare products a few times a week or more, and only 5% rarely or never use the Internet to purchase products and pay for those products online.