prosecutor's and defendant's âfallaciesâ common in legal contexts (e.g. .... The prosecutor's fallacy (Thompson and Schumann 1987) is so named since it aids the.
IASE /ISI Satellite, 2009: Samantha Low Choy and Therese Wilson
How do experts think about statistics? Hints for improving undergraduate and postgraduate training Samantha Low Choy and Therese Wilson School of Mathematical Sciences, Queensland University of Technology Experts are increasingly being called upon to quantify their knowledge, particularly in situations where data is not yet available or of limited relevance. In many cases this involves asking experts to estimate probabilities. For example experts, in ecology or related fields, might be called upon to estimate probabilities of incidence or abundance of species, and how they relate to environmental factors. Although many ecologists undergo some training in statistics at undergraduate and postgraduate levels, this does not necessarily focus on interpretations of probabilities. More accurate elicitation can be obtained by training experts prior to elicitation, and if necessary tailoring elicitation to address the expert’s strengths and weaknesses. Here we address the first step of diagnosing conceptual understanding of probabilities. We refer to the psychological literature which identifies several common biases or fallacies that arise during elicitation. These form the basis for developing a diagnostic questionnaire, as a tool for supporting accurate elicitation, particularly when several experts or elicitors are involved. We report on a qualitative assessment of results from a pilot of this questionnaire. These results raise several implications for training experts, not only prior to elicitation, but more strategically by targeting them whilst still undergraduate or postgraduate students.
1. Introduction Expert knowledge is valuable in many situations where empirical data is sparse or nonrepresentative especially in new investigations, for informing design of data collection or providing preliminary estimates. In ecology, expert knowledge has therefore informed many investigations where empirical data is lacking: delineating bioregional boundaries, assessing habitat preferences of rare species, and parameterizing complex biological demographic models (Ellison 1996; Low Choy et al. 2009). For instance expert knowledge has been used to characterise habitat preferences for input into Bayesian regression (O’Leary et al. 2008a), Bayesian classification trees (O’Leary et al. 2008b) and Bayesian networks (Smith et al. 2007). An important component of the substantive knowledge of ecological experts arises from direct experience such as fieldwork. They add to their knowledge through discussions with other experts and by distilling the scientific literature. Effective elicitation of expert opinions relies not only on this high level knowledge and understanding of the subject-matter, but also on their understanding of what is required by the elicitor from a quantitative perspective, including a basic understanding of probabilities. Hence detailed assessment of an expert’s understanding of probabilities would allow (1) training and (2) elicitation to be tailored to the individual expert. In the longer term such an assessment, if formative rather than summative, would also provide the basis for more strategic training of experts, and integrated into (3) future elicitation exercises, or more strategically (4) delivered in undergraduate or postgraduate courses. Not only would this help improve an expert’s ability to interpret the relevant scientific literature throughout their career, whilst they develop their expertise, it may also help motivate tertiary level students by illustrating the relevance of mastering probability concepts. This paper reports on preliminary efforts to diagnose an expert’s level of understanding of probability concepts, a necessary prerequisite of aims (1-4) above. We first identify some key probability concepts to be tested, thought to have significant effect on accurate elicitation of probabilities (Section 2). These form the aims of a questionnaire designed to test these concepts (Section 3). Since successful elicitation of probabilities must be assessed in a particular context (O’Hagan et al., 2006), we focus on a target population of experts who may be consulted about incidence or abundance of species, as related to environmental factors. We report on a qualitative assessment of results from a pilot study, whose intent is to refine the questionnaire for a major study involving a relatively large sample size comprising tens of ecological experts (Section 4).
IASE /ISI Satellite, 2009: Samantha Low Choy and Therese Wilson
Finally we discuss some implications for teaching at undergraduate or postgraduate level (Section 5).
2. Probability concepts: Biases, Fallacies, Traps and Pitfalls Well-designed expert elicitation is one way to ensure rigour (O’Hagan et al., 2006). One framework for designing elicitation in ecology (Low Choy et al., 2009) highlights six main elements: determine the purpose (E1), formulate the statistical model (E3), appropriately target (E2) and encode (E4) expert knowledge, and design an accurate (E5) and repeatable elicitation protocol (E6). The way in which experts understand and communicate their probabilities has immense impact on the accuracy of information provided (E5), as well as comparability between opinions provided by several experts (E6). Within this framework the aspects most impacted are: (1) training experts in probability to provide a basis for eliciting their probability assessments on a particular topic (also affecting encoding E4); and (2) identifying strengths and weaknesses in the expert’s understanding and communication of probabilities and capitalize this knowledge to target the design of elicitation to manage measurement error (therefore affecting the goal E2). It is also common to suggest including a preliminary phase in elicitation to “condition” experts to the common biases (e.g. Spetzler and Stäel von Holstein 1975) or training experts vigorously on probability in the specific context of elicitation (e.g. O’Hagan et al. 2006). Nevertheless few details are generally provided on a structured approach to conditioning or training experts. Although optional in situations involving one elicitor and one or two experts (e.g. O’Leary et al. 2008), a structured approach becomes mandatory in situations where an elicitation protocol may be applied to a wide range of experts, especially when there is more than one elicitor. Early research in psychology established that many biases arose from the use of particular “heuristics” used by people to assess probabilities (eg Tversky and Kahneman 1974, 1983). These included: the availability bias depending on how easily information is recalled; the anchoring and adjusting bias where people start with an initial estimate and adjust it from there; and the representativeness bias where people tend to focus on a typical member of a population and extrapolate from there. The first two biases may quite easily be addressed prior to, or during, the elicitation process (Low Choy et al., to appear). The representativeness bias is related to several different misunderstandings about conditional probabilities including Bayes’ Theorem. Several misunderstandings have been identified as prevalent amongst lay people, and include the prosecutor’s and defendant’s “fallacies” common in legal contexts (e.g. Villejoubert and Mandel, 2002). In addition diagnostic testing of probability reasoning has been performed in an introductory statistical modelling course (e.g. MacGillivray 2006, 2007). Both sources provide useful foundation for a questionnaire diagnosing probability concepts in ecologists. In this paper we develop a formal method for diagnosing how experts understand concepts about probabilities, rather than simply testing whether they understand the concept correctly. This is the first step towards finding a remedy via training or targeting design of elicitation (aims 1 and 2 above). 2.1. Crocodile example
Consider an example requiring interpretation of conditional probabilities. Suppose that a crocodile with particular markings bit a tourist, and that these markings are known to occur in 3% of the species. A crocodile is captured with these markings, and permission to terminate will only be given if there are “good” odds that the animal is guilty. This scenario is similar to one recently reported in the news (Murphy 2008), and may be of similar flavour to other situations encountered by ecological experts, particularly if they provide scientific evidence as experts in legal settings. The events of interest are whether the crocodile is marked (M) or not ( M ) and whether guilty (G) or not ( G ). This parallels the problem of determining the guilt of suspects in legal contexts depending on whether they match the evidence (Finkelstein and Levin 2001). Using mathematical notation, the core skill is to recognize that we need Pr(G|M), and since we know that at least the guilty one of the crocodiles is marked we have Pr(M|G)=1 (assuming the markings have been accurately recalled). Bayes’ Theorem can be used to obtain:
IASE /ISI Satellite, 2009: Samantha Low Choy and Therese Wilson
Pr(G | M ) =
Pr( M | G ) Pr(G ) Pr( M )
Eqn 1
If there are N suspect crocodiles, then ignoring the evidence on markings, the probability of guilt is Pr(G) = 1/N, and of innocence is Pr( G )=(N–1)/N. The remaining challenge is to interpret the statement “these marking occur in x% of the species”. In general, this probability could be interpreted as Pr(M). However if Eqn 1 is to be applied to a given group of N suspect crocodiles, then Pr(M) in this equation must measure the probability of marked crocodiles also occurring within this group of size N. Thus the probability of marked crocodiles amongst the N suspects is Pr(M|G)Pr(G) + Pr(M| G )Pr( G ) = 1.1/N + x (N–1)/N. This is equivalent to assuming that the x% mentioned as the incidence of markings in the general population is in fact be considered as equivalent to Pr(M| G ) amongst the suspects. Then from Eqn 1 we have
Pr(G | M ) =
1 ( N − 1) x + 1
Eqn 2
This provides a relationship between the assumed number of suspects (N) and p=Pr(G|M) as
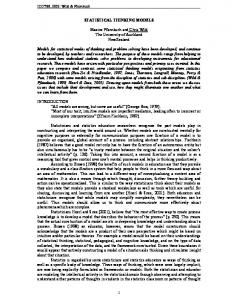
N = (1 − p ) px + 1 G: Is the suspect guilty?
1 Guilty N suspects N-1 Innocent
Eqn 3
2.2. Visual presentation
M: Of these, how many match the evidence? 100% Match 0% No match 3% Match 97% No match
Despite the logical appeal of equations to mathematicians, in teaching contexts it has been shown that this style of presentation appeals to very few people. Visual representations, such as a 2×2 table, a logic tree (Figure 1) or a matrix can be more useful to the vast majority of people (Ruscio 2003). This raises the first research question R1: Determine the types of formats preferred by the target population of ecological experts. In particular consider whether ecological experts provide more accurate responses when probabilities are expressed in terms of frequencies (e.g. Edgell et al. 2004, Giggerenzer and Hoffrage 1995; Hoffrage and Giggerenzer 1998; Kynn 2008). 2.3. The Conjunction Fallacy
In many situations linguistic uncertainty such as brevity or ambiguity in explanations can Figure 1: A logic tree for visualizing conditional lead to confusion between joint and conditional probabilities. Crocodile example. probabilities, a form of underspecificity (Burgman 2005). In this case, the statement “these marking occur in x% of the species”, could lead to interpretation of x =0.03 as the marginal probability Pr(M) for the suspects, which gives Pr(G|M) = 1/(Nx). For small N this can lead to an inconsistent set of probabilities, an issue difficult to detect “on the spot”. The fallacy arises with a small set of suspects, N1 and also Pr(M)=x is not then larger than the conjunction Pr(MG)=1/N. Hence research question R2: Will ecological experts avoid the conjunction fallacy? 2.4. Prosecutor’s fallacy
The prosecutor’s fallacy (Thompson and Schumann 1987) is so named since it aids the prosecution by over-estimating the probability of guilt. It may occur if the conditioning is misinterpreted by (R3a) setting a conditional probability equal to the probability of the condition, e.g. Pr(M| G ) = Pr( G ). In this case, this corresponds to incorrectly reasoning: since the chance of
IASE /ISI Satellite, 2009: Samantha Low Choy and Therese Wilson
markings if innocent is Pr(M| G ) = 3%, then the probability of innocence (for marked crocodiles) Pr( G |M) is 3%, or equivalently that the probability of guilt (if marked) is Pr(G|M) = 1–Pr( G |M) = 97%. In fact, 97% equates to the distinctly different probability that there is no match when the suspect crocodile is in fact innocent Pr( M | G ). Note that Eqn 2 implies Pr(G|M) = 97% in the special case when the number of suspects N is 2. So intuitive thinkers may get confused if they have a “gut feeling” that the estimate could be correct (R3b). Thus research question R3 is: Do ecological experts err via the prosecutor’s fallacy? If so, are misunderstandings of type (a) or (b)? 2.5. Inversion fallacy
The prosecutor’s fallacy is mathematically equivalent to the “inversion” fallacy which occurs when the ordering of the conditioning is confused, setting Pr(M| G )=Pr( G |M). Thompson and Schumann (1987) notes that the prosecutor’s fallacy is true in the special case when the prosecutor assumes even prior odds of guilt before viewing the evidence, in contrast with the usual “legal” presumption of innocence until proven guilty “beyond all reasonable doubt”. Villejoubert and Mandel (2002) find that this error is consistently made by a large percentage of lay people, and does indeed result from switching the conditioning rather than neglecting base rates Pr(G) and Pr( G ) in the computation, as suggested by others (e.g. Evans et al. 2002). This extends the third research question to R3: If the prosecutor’s fallacy occurs, is it due to (a) equating Pr(M| G ) to Pr( G ); (b) inverting the logic by setting Pr(M| G )=Pr( G |M); (c) neglecting base rates; (d) assuming the prior odds of guilt before viewing evidence is one half; (e) assuming the number of suspects N=2; or (f) a desire to conclude the crocodile is guilty? 2.6. Defendant’s fallacy
The defendant’s fallacy is so-called since it over-estimates the probability of innocence in favour of the defendant. It may occur if subjects dilute the evidence on marking, despite how rarely it occurs in the population at large (Thompson and Schumann 1987). In this case, they may start by choosing a very large reference region, e.g. Northern Queensland. If there are 40,000 other crocodiles in Northern Queensland, then they can logically state that they expect 1,200 of these to be marked, leading to the seemingly logical conclusion that there is a chance of 1 in 1,200 that the captured crocodile is guilty. The fallacy arises from a mis-specification of the probability space. It fails to take into account that there was a much smaller group of suspect crocodiles within the vicinity of where the tourist was bitten, leading to a much reduced likelihood that one of the suspects was also one of the rare marked crocodiles. Suppose the number of suspects was more realistic: a local scientist estimates that at most 100 crocodiles inhabit the river where the tourist was bitten. Since crocodiles are quite territorial they are unlikely to move around much outside of breeding season or floods. Since the probability (p) is related to the number of suspects (N) via Eqn 3, this would lead to a much larger chance of one in four that the suspect is indeed guilty given the evidence of marking, with p = 0.25. Thus research question R4 is: Are ecological experts susceptible to the defendant’s fallacy? If so, can this be attributed to accepting an inappropriate reference population? 2.7. Naughty Noughts and defining the Baseline Population
The defendant’s fallacy is closely related to the “naughty noughts” (Austin and Meyers, 1996) or “excess zeros” (e.g. Martin et al. 2005) problem in ecology. This occurs when an inappropriately large reference region is used, thus diluting the probability of presence of a species. Excess absences [or presences] may map to large [or small] geographic areas of absences that will dilute [or inflate] estimated probabilities of presence. To account for environmental constraints, e.g. to ensure the species’ environmental envelope excludes areas uninhabitable by the species, a solution is to redefine the baseline population (Austin and Meyers 1996; Murray et al. 2008) or model (Martin et al., 2005; O’Leary et al., unpublished manuscript).
IASE /ISI Satellite, 2009: Samantha Low Choy and Therese Wilson
Other elements important in reducing biases include: defining spatio-temporal extent and scale to reduce underspecificity; and recognizing important pre-conditions or sub-populations to reduce context dependence (Burgman 2005). In elicitation the statistical model should isolate the variable that experts know something about (Spetzler and Stäel von Holstein 1975). This often requires decomposition of the problem by adding extra “hierarchy” which highlights important pre-conditions (Low Choy et al. 2009). For example, the probability of occupancy may depend on detection of a species when it is or is not present (Martin et al. 2005). Missing pre-conditions may manifest when important sub-populations are not identified. Thus experts may need to report probabilities separately for different regions (Murray et al., in review). To address these baseline biases, Girotto and Gonzalez (2001) recommend asking subjects to explicitly communicate both the numerator and the denominator in the ratio (odds) defining a conditional probability. Kynn (2008) recommends that explanations are provided for any extreme probabilities (close to zero or one), potentially revealing tacit assumptions. These issues complement research question R4 to define R5: Are experts aware of the need to appropriately define the baseline population, by (a) identifying important ecological constraints (e.g. species envelope); (b) defining the spatio-temporal extent and scale; and recognizing important (c) pre-conditions or (d) sub-populations that modify the probability of interest? 2.8. The importance of joint probabilities
Some visual representations encourage assessment of joint probabilities rather than conditional probabilities, which can be important. Edgell et al. (2004) note the inversion fallacy (Section 2.4) is less prevalent when people are introduced to information expressed as joint rather than conditional probabilities. Girotto and Gonzalez (2001) encourage evaluation of joint probabilities where all possibilities for at least one condition are considered, e.g. estimate both Pr(MG) and Pr(M G ). This ensures that the full range of possibilities of at least one factor (here G and G ) are considered in conjunction with the other factors. Hence research question R6: Confirm whether reasoning improves when guided to evaluate joint probabilities first.
3. Questionnaire design 3.1. Principles
This questionnaire seeks to diagnose and evaluate how ecological experts think and communicate about probabilities when asked questions in particular formats. It was important to emphasize to respondents that there are therefore no right or wrong answers, and that it may be that the wording or presentation of questions may make it difficult for experts to answer in the expected way. Information targeted by the questionnaire falls in three main areas: an introduction to set the scene and frame the topic; assessing probabilistic reasoning and skills; and relevant background information such as risk attitudes and previous statistical training which may impact their reasoning. Risk attitudes are important and could conceivably modify all probability assessments provided by an individual expert. Questions on training on statistics and probability throughout their education provide important context and allow experts to identify gaps, both important for future design of training. In this paper we focus on the core questions addressing comprehension of conditional probabilities. Recognizing that different experts think in different modes (Low Choy et al., submitted), probabilistic thinking can be assessed using problems that are presented in different formats: (i) verbal descriptions with information in numeric form, (ii) in tabular format, or (iii) using a map. The verbal presentation targets experts with strong aural learning and thinking modes. Tabular formats are designed to appeal to experts with experience in spreadsheeting or with strengths in visual learning and thinking, in concrete rather than abstract contexts. Maps provide an alternative visual focus, and may trigger kinetic memories (i.e. of physically doing things) in ecological experts with a strong background in fieldwork (Denham and Mengersen 2007) or familiarity with Geographic Information Systems (GIS).
IASE /ISI Satellite, 2009: Samantha Low Choy and Therese Wilson
The verbal format may encourage intuitive thinking across all types of experts, however they may be susceptible to linguistic bias. These questions tend to be more open-ended so have higher potential to reveal the expert’s thinking processes, depending on the skill of an interviewer in divining this information. In contrast the tabular and map-based formats provide more specific information, but may appeal to experts with greater numeric literacy. Specific follow-up questions may be used to reveal particular types of thinking. Either approach may be used to provide different cues, for example on: format and expressing probabilities in terms of frequencies, percentages, ratios or proportions (R1); or encouraging evaluation of joint before conditional probabilities (R5). Regardless of the format of presentation, questions are designed to assess whether the expert is susceptible to: (R3) the prosecutor’s or inversion fallacy, with five potential causes; (R4) the defendant’s fallacy or (R5) other biases due to weaknesses in defining the baseline, with four postulated causes. 3.2. Target population of experts
Successful elicitation of expert knowledge can only be assessed within the area of expertise (O’Hagan et al., 2006). For specificity, we therefore target experts, in ecology or related fields, who might be called upon to estimate probabilities of incidence or abundance of species, and how this relates to environmental factors. In addition to outlining a preliminary rationale, aim and design of a questionnaire for diagnosing how these ecological experts learn and think about probabilities, this paper reports on a pilot exercise to test a preliminary version of a questionnaire. Although the final questionnaire is intended for delivery in written form, this first pilot was delivered via interview. This form of delivery allowed the interviewer to: control the order of questions and note the need for additional follow-up questions either for clarification or to guide thinking; assess the amount of time taken on each question; note the “comfort” level for different question formats. Thus three phases are proposed for development of the questionnaire. In phase I (some aspects reported here) we propose an initial design, and pilot this on a small though diverse group of experts, to assess the discriminatory ability of questions to detect a variety of conceptual misunderstandings. For phase II, the initial design is refined, and tested on at least two more discipline-specific groups of experts, to provide an indication of the need to tailor the questionnaire to specific disciplines. This will provide a final questionnaire in phase III that can be used to diagnose expert knowledge prior to a specific elicitation exercise, train experts, and redesign elicitation to account for their strengths and weaknesses. The small group of six experts consulted during the pilot phase I was selected to cover a range of disciplines: two ecologists with varying expertise on vegetation or animal species in several ecosystems; two environmental scientists with expertise either in assessing or reporting across a wide range of species and ecosystems; a wildlife veterinarian with expertise in epidemiology of animal diseases across various species; and an ecologist with research interests on species-environment interactions who also teaches statistics. 3.3. Content of questions
Experience in statistical education provided a conceptual template for questions in verbal (Q3 on crocodiles) or tabular format (Q4 on deer, Q6-Q7 on foliage projected cover) that can be tailored to the elicitation topic (e.g. MacGillivray 2006,2007). Experience in eliciting information on this topic supported by map-based software tools (Low Choy et al., to appear) helped formulate the map-based question (Q5). A word problem (Q3 on crocodiles, similar to Section 2) reflects the type of everyday information that an expert may encounter whilst reading the newspaper, and is similar to questions in the literature on fallacies (e.g. Thompson and Schumann 1987). Hence verbal, tabular and map-based presentations are tested (R1). Several situations are considered for assessing skills in conditional probabilities, and reflect realistic situations thought to be commonly encountered by the target ecologists: (I) determining presence of an ecological factor (e.g. guilt) given evidence; (II) characterizing how species presence relates to one or two environmental factors; and (III) predictive ability of species’ environmental niche or habitat models. A verbal question (Q3) based on the example in
IASE /ISI Satellite, 2009: Samantha Low Choy and Therese Wilson
Section 2 concerned whether a crocodile was guilty given it matched a description (Situation I), and was used to assess whether the expert was coherent (R2) or committed the prosecutor’s and defendant’s fallacies (R3-4). A tabular question (Q4) focussed on whether environmental managers mentioned a deer species’ preference for two types of habitat factors (Situation II), and helped assess benefits of tabular format (R1); detect impacts of linguistic ambiguity (R2), especially on distinguishing joint from conditional probabilities (R6); assess the inversion fallacy (R4) and some aspects of baseline biases (R5). The map-based question (Q5) required experts to assess environments preferred by a gecko species (Situation II) and targeted baseline biases (R5). A tabular question (Q6) addressed similar though fewer questions to another question (Q4), but in the more abstract context of assessing a model’s predictive ability in discerning foliage projected cover (Situation III). A verbal question (Q7) addresses similar questions to another (Q6) in the same context (Situation III), but provides cues in terms of percentages rather than counts. This presentation of the problem requires experts to apply Bayes’ Theorem or its visual analogues (such as a decision tree) to obtain a solution. In particular it was interesting to see whether experts utilized the tabular format that was used to present information for previous questions, to help answer this question. All tabular questions provided information in terms of frequencies. Comparisons between questions tested whether presentation of information as conditional probabilities (Q3,Q7), joint probabilities (Q4,Q6) or visual frequencies (Q5) affected evaluation (R6), in part due to format; and whether some experts had an intuitive (Q3,Q5) rather than logical (Q4,Q6-Q7) grasp of conditional probabilities (R1).
4. Results from a pilot study 4.1. Verbal question (Q3) addressing prosecutor’s and defendant’s fallacy
The verbal format of the crocodile question (Q3) provided information in the form of the reverse conditional probability to that required (x), and some frequencies relevant to baseline rates. However key information on the number of suspects was not provided. This information was identified as important by half of the pilot experts at the outset and by the other half later during the question. Although two experts just wondered about N, two experts were concerned with how large N was and one with how large the region was, and one provided an example N=100. This suggests a tendency for experts to eventually realise that spatio-temporal and baseline and reference population are important (R5), so it is important to assess the timing of the realisation. All experts were quickly able to identify the prosecutor’s fallacy in the verbal context (Q3), with two highlighting the reversal of logic, one empathising with the misunderstanding, one person stating the correct interpretation of the probability of marking given guilty. However although one person identified that the statement was incorrect, their explanation revealed the inversion fallacy (3% chance of innocence). Two thirds of the experts fell prey to the standard defendant’s fallacy, despite one of these noting that only local crocodiles should be considered at the outset. 4.2. Tabular questions (Q4,Q6) assessing inversion fallacy and baseline biases.
Using a tabular format of presenting a 2x2 table in a standard context (Q4), all experts reported the marginal probability correctly, and some experts noted the ambiguous wording affecting their estimates of the two joint probabilities. All experts estimated the first conditional probability (by column) correctly, whilst only two thirds estimated the second conditional probability (by row) correctly, although this could be due to the similar row and column totals (56 and 58 respectively). Altogether this indicates that one question each on a marginal, joint, row and column conditional probability should be sufficient to capture most variation in thinking. In Q4 the number of times that factors are “mentioned” by managers is reported, rather than the number of managers mentioning a factor. This issue with the underlying support was noted by one third of the experts. Only one expert noted that one of the questions was erroneously referring to the number of managers rather than the number of mentions.
IASE /ISI Satellite, 2009: Samantha Low Choy and Therese Wilson
For the other tabular format question in a different context (III) (Q6), one expert made a mistake and reported a conditional probability instead of the desired marginal. Half the experts accurately reported the row-based conditional probability, with one interpreting it as a joint probability, one reporting the odds of high to low, and one committing the inversion fallacy. Twothirds of experts accurately estimated the column-based conditional probability, with the remainder estimating a joint instead. Taken together results from the tabular format questions indicated that linguistic uncertainty was a key element (R1). The sampling units in Q4 were consider ambiguous or unusual by most experts, and led to longer response times. Errors increased with the more abstract context (R1) of model performance (Q6). Errors seemed higher for the row-based conditional probabilities (consistent across Q4,Q6), indicating potential sensitivity to orientation of tabular format (R1b). The order of marginal, joint and conditional probabilities may assist some but not all experts (R6). These trends need to be investigated further, and confirms the need to present tabular information in these two different contexts (I,III), both commonly encountered by the target ecological experts. 4.3. Map-based question (Q5) assessing baseline biases.
All expects commented that they enjoyed (R1) the map-based presentation (Q5). All but one expert provided an estimated (joint) probability over the entire grid, explaining that there was no evidence to support limiting the area of concern in any way. One third of experts suggested that a constraint to administrative boundaries was likely to be flawed although difficult to discern from the available information. This suggests that one sub-question on constraints would be sufficient in the final questionnaire. However it is possible that this question is perhaps not sufficiently discriminating to detect baseline biases (R5), so that more challenging questions ought to be included. 4.4. Verbal question (Q7) assessing Bayes Theorem.
The final verbal question (Q7) required application of (a) the total law of probability to evaluate the marginal probability Pr(M) and (b) Bayes Theorem to evaluate an inverse conditional, with information provided in terms of probabilities conditional on guilt G. Without exception, all experts found this question, particularly evaluation of the inverse conditional probability, difficult to do on the spot, e.g. commenting “My brain hurts!” or “Brain is fibrillating”. Experts either made a short cursory effort or else attempted the question at least twice, with a substantial break in between. Half the experts took 20-25 minutes to arrive at their answers, and the one person who took the longest (30 minutes) got both answers “correct”. Half of the experts correctly applied the law of total probability to quantify the marginal based on the provided information in terms of conditional probabilities. One expert did not recognize a marginal or inverse conditional was required, and instead reported a conditional for both questions and one person reported a base rate. People encountered even more difficulties, and spent most their effort on part (b). One person calculated the inverse conditional probability correctly, and another third of the experts calculated the numerator correctly but then misapplied the denominator. Two people reported 90% which was the inverse conditional probability. Only one person adopted the tabular format of the previous questions (Q4,Q6) to work out the inverse probability. Overall these results suggest heavily that this type of question should be avoided in “live” situations such as just prior to or during elicitations, although it may prove highly informative and discriminating in assessing probabilistic literacy of students (R3,R4). These results suggest that the question could target knowledge of Bayes’ Theorem (R3,R4) better by using a less abstract context, even more straightforward than that used in Q4.
5. Discussion In general these preliminary results suggest that the presentation and format may have a large impact on experts’ ability to recognize and outline the solution to obtain the desired probabilities. Results from the tabular format (Q4,Q6) provide weak evidence that some experts
IASE /ISI Satellite, 2009: Samantha Low Choy and Therese Wilson
are more prone to the inversion fallacy than others. However no experts performed this fallacy for the verbal question (Q3) in the popular news context (I), whereas several experts erred in this way using verbal question (Q7) on the more abstract context (III). This provides a useful indication that the inversion fallacy is indeed sensitive to format, with some experts more susceptible than others. The map-based format of Q5 did not diagnose any sources of baseline bias. Thus either the format is highly successful or the questions need to be made more complicated. Current indications are that the map-based format (Q5) helped avoid baseline biases (R5) which were more likely to occur as the defendant’s fallacy (R4) in the verbal format (Q3) and to a lesser extent in the tabular formats (Q4,Q6). More extensive research is required to determine the extent to which format or context can improve experts’ abilities to avoid baseline biases. None of the pilot experts exhibited the conjunction fallacy (R2) in the one question able to detect it (Q3), signifying extra research is required to determine if other questions may detect this problem better, or if the problem is not as prevalent as first suspected. Thus preliminary results support continuing with diagnosis of fallacies in several formats as well as both a straightforward context (ecological response to two factors) and a more abstract context (predictive performance of models). This suggests retaining (with minor refinements) questions Q3, Q4 and Q6 in verbal and tabular formats, targeting the prosecutor’s, defendant’s, and conjunction fallacies as well as preference for joint rather than conditional probabilities. However indications are that more difficult concepts such as calculating marginal and inverse probabilities from conditional probabilities (rather than joint frequencies) as in Q7 should be assessed in simpler contexts. In phases II and III with more homogeneous target populations of experts, it will be possible to determine how consistent these patterns and trends are. Larger sample sizes will provide more power to detect emerging patterns across the target population whilst also allowing for examination of the individual susceptibility of experts via relationships between questions.
6. Implications for undergraduate and postgraduate training for ecologists Many ecological experts consulted for elicitation have had little formal training in understanding probability concepts, and little practice in quantifying their knowledge in the form of probabilities. Relevant concepts may have been encountered but not explored in a context relevant to elicitation. Probability may be introduced in the final two years of high school, in courses on philosophy or mathematics (statistics or probability component), and paid only cursory attention in a modern introductory statistics course at undergraduate and postgraduate levels which focuses on data analysis. The statistics education reform movement which has improved the teaching of data analysis, has so far had little positive impact on the teaching of probability concepts (MacGillivray, 2008). In contrast, scientific articles more accessible to ecologists postgraduation are increasingly addressing fundamental probability concepts, especially with proliferation of Bayesian statistics (e.g. Malakoff 1999; Ellison et al., 2004). Despite this limited training, experts have been quantifying their knowledge for input to models for decades; for review in ecological context see Low Choy et al. (2009). Some disciplines have recognized the need for appropriate training at undergraduate level, including interpretation of: evidence in a legal context (e.g. Finkelstein and Levin 2001), medical diagnostic tests risk assessments (e.g. Burgman 2005), and assessment of model performance via sensitivity and specificity (Fielding and Bell 1997). This paper provides preliminary evidence of this gap in the training of ecologists who may be called upon to quantify their expert advice. This preparation provides the foundations for improved understanding, implementation and interpretation of statistics more generally. Classical statistics rests on clear understanding of probabilities conditioning on the null hypothesis (e.g. p-values, confidence intervals, significance levels and power). Conditional probabilities underpin Bayes Theorem, leading to the central tenet of Bayesian statistics and a focus on the probability distributions of model parameters conditioning on the data observed. By addressing the gap in understanding how to apply probability concepts, the next generations of ecologists may be better prepared to explore and communicate their knowledge quantitatively, often as probabilities, with estimates qualified by a quantification of their uncertainty.
IASE /ISI Satellite, 2009: Samantha Low Choy and Therese Wilson
Acknowledgements Research for SLC was supported by an Australian Research Council Discovery grant DP0667168, and for TW by the QUT School of Mathematical Sciences. We thank Helen MacGillivray for early comments and the ecologists who participated in the pilot study.
References Austin, M. P. and Meyers, J. A. (1996) “Current approaches to modelling the environmental niche of eucalypts: implications for management of forest biodiversity”. Forest Ecology and Management 85: 95–106. Burgman (2005) Risks and Decisions for Conservation and Environmental Management, Cambridge University Press, Cambridge. Edgell, S. E., J.I. Harbison, W.P. Neace, I.D. Nahinsky and A.S. Lajoie (2004) “What is Learned from Experience in a Probabilistic Environment?” Journal of Behavioral Decision Making, 17: 213–229. Ellison, A. (1996) “An introduction to Bayesian inference for ecological research and environmental decision making.”, Ecological Applications 6:1036–1046. Ellison, A. M. (2004) “Bayesian inference in ecology”. Ecology Letters 7:509–520. Evans, J. St. B. T., S. J. Handley, D. E. Over and N. Perham (2002) “Background beliefs in Bayesian inference”, Memory & Cognition 30 (2):179-190. Fielding, A.H. and Bell, J.F. (1997) “A review of methods for the assessment of prediction errors in conservation presence/absence models, Environmental Conservation, 24(1):38-49 Finkelstein, M. O. and B. Levin, (2001) Statistics for Lawyers, 2nd edition, Spinger. Garthwaite, P. H., and A. O’Hagan (2000) “Quantifying expert opinion in the UK water industry: an experimental study”. Statistician 49:455–477. Girotto, V. and M.Gonzalez, “Solving probabilistic and statistical problems: a matter of information structure and question form”, Cognition 78 (2001): 247-276. Gigerenzer, G., and Hoffrage, U. (1995). “How to improve Bayesian reasoning without instruction: frequency formats” Psychological Review, 102, 684–704. Hoffrage, U., and Gigerenzer, G. (1998) “Using natural frequencies to improve diagnostic inferences”, Academic Medicine, 73, 538–540. Kynn, M. (2008) “The ‘‘heuristics and biases’’ bias in expert elicitation”. Journal of the Royal Statistical Society, Series A 171(1):239–264. Low Choy, S., O’Leary, R., Mengersen, K. (2009) “Elicitation by design in ecology: using expert opinion to inform priors for Bayesian statistical models” Ecology, 90(1): 265–277. Low Choy, S., Murray, J., James, A., and Mengersen, K. (to appear) “Indirect elicitation in ecology: from methods to software and habitat modelling to rock-wallabies” in the “Handbook of Applied Bayesian Analysis”, eds T. O’Hagan and M. West, Oxford University Press: Oxford. Low Choy, S., James, A. and Mengersen, K. (submitted) “Expert elicitation and its interface with technology: a review with a view to designing Elicitator”, In R. Braddock et al. (eds) 18th IMACS World Congress – MODSIM09 International Congress on Modelling and Simulation, December 2009. ISBN: 978-0-9758400-7-8.. MacGillivray, H.L. (2007) “Weaving assessment for student learning in probabilistic reasoning at the introductory tertiary level”, The Proceedings of the ISI / IASE Satellite on Assessing Student Learning in Statistics, Guimarães, Portugal: ISI, Voorburg, The Netherlands http://www.swinburne.edu.au/lss/statistics/IASE/Satellite_papers/IASE_SAT_07_Macgill ivray.pdf MacGillivray, H.L.(2006) “Using data, student experiences and collaboration in developing probabilistic reasoning at the introductory tertiary level”, 7th International Conference on Teaching Statistics http://www.stat.auckland.ac.nz/~iase/publications/17/6B4_MACG.pdf . MacGillivray, H.L.(2008) “Examples from an introductory course in developing probabilistic statistical thinking: partPart 1”, MSOR Connections 8(1), 7-10. http://www.mathstore.ac.uk/index.php?pid=37&vol=8&num=1
IASE /ISI Satellite, 2009: Samantha Low Choy and Therese Wilson
Murphy, P. (2008) “Vietnam veteran snatched by croc”, October 01 2008, The Australian, http://www.theaustralian.news.com.au/story/0,25197,24428682-601,00.html. Murray, J.V., S. Low Choy, C.A. McAlpine, H.P. Possingham, and A.W. Goldizen, (submitted) Evaluating model transferability for a threatened species across neighbouring regions: Implications for rock-wallaby conservation, Austral Ecology. Murray, J. V., A.W. Goldizen, R. A. O’Leary, C. A. McAlpine, H. P. Possingham and S. Low Choy (in review) “How useful is expert opinion for predicting the distribution of a species within and beyond the region of expertise? A case study using brush-tailed rock-wallabies (Petrogale penicillata)”, Journal of Applied Ecology. O’Hagan, A., C. E. Buck, A. Daneshkhah, R. Eiser, P. Garthwaite, D. Jenkinson, J. Oakley, and T. Rakow. (2006) “Uncertain judgements: eliciting experts’ probabilities”. John Wiley and Sons, New York, New York, USA. O’Leary, R. A., Mengersen, K. Fensham, R. and Low Choy, S. (2009) Improving the performance and interpretation of habitat models: using a multi-scale modelling approach to model the envelope and identify excess zeros, unpublished manuscript. O’Leary, R. A., S. J. Low Choy, K. Mengersen, M. Kynn, P. M. Kuhnert, R. Denham, T. J. Martin, J. Murray, and P. J. Jarman (2008a) Comparison of expert elicitation methods for logistic regression for presence of endangered brush-tailed rock-wallaby Petrogale penicillata. Environmetrics.[doi: 10.1002/env.935] O’Leary, R., J. Murray, S. Low Choy, and K. Mengersen (2008b) Expert elicitation for Bayesian classification trees. Journal of Applied Probability and Statistics 3(1):95–106. Pike, W. A. (2004) “Modeling drinking water quality violations with Bayesian networks”, Journal of the American Water Resources Association, 40(6):1563–1578. Pollino, C. A., O. Woodberry, A. Nicholson, K. Korb and B. T. Hart (2007) “Parameterisation and evaluation of a Bayesian network for use in an ecological risk assessment”, Environmental Modelling and Software, 22:1140–1152. Ruscio, J. (2003) “Comparing Bayes’s Theorem to Frequency-Based Approaches to Teaching Bayesian Reasoning”, Teaching of Psychology, 30(4): 324–328. Smith, C. S., A. L. Howes, B. Price, and C. A. McAlpine (2007) Using a Bayesian belief network to predict suitable habitat of an endangered mammal the Julia Creek dunnart (Sminthopsis douglasi). Biological Conservation 139:333–347. Spetzler, C. S., and C.-A. S. Staël von Holstein (1975) Probability encoding in decision analysis. Management Science 22(3):340–358. Thompson, W. C. and E. L. Schumann (1987) “Interpretation of Statistical Evidence in Criminal Trials: The Prosecutor's Fallacy and the Defense Attorney's Fallacy”, Law and Human Behavior, 11(3):167-187. Tversky, A., and D. Kahneman (1973) Availability: a heuristic for judging frequency and probability. Cognitive Psychology 5:207–232. Tversky, A., and D. Kahneman (1974) Judgment under uncertainty: heuristics and biases. Science 185:1124–1131. Tversky, A., and D. Kahneman (1981) The framing of decisions and the psychology of choice. Science 211:453–458. Uusitalo, L. (2007) Advantages and challenges of Bayesian networks in environmental modelling, Ecological modelling 203: 312–318 Villejoubert, G. and Mandel, D. R. (2002) “The inverse fallacy: An account of deviations from Bayes’s theorem and the additivity principle”, Memory & Cognition, 30(2):171-178.