The Determinants of the Life Cycle Stages of Brazilian Public Companies: A Study Based on FinancialAccounting Variables Wando Belffi da Costa† Universidade Federal do Espírito Santo (UFES) Marcelo Alvaro da Silva MacedoΩ Universidade Federal do Rio de Janeiro (PPGCC/UFRJ) Karen Yukari Yokoyama¥ Universidade Federal do Espírito Santo (UFES) José Elias Feres de Almeida* Universidade Federal do Espírito Santo (UFES) ABSTRACT
This paper analyses the relation between firms’ life cycles stages according to Dickinson’s (2011) definition and accounting and financial ratios. We applied multinomial logistic regression analysis on a sample of 1,515 observations of public companies listed on BM&FBOVESPA between 2005 and 2012. Based on the literature about firms’ life cycle stages (YAN; ZHAO, 2010; MILLER; FRIESEN, 1984; FAMA; FRENCH, 2001) the accounting and financial ratios used were dividends distribution, leverage, market-to-book, return on equity, firm size and revenue growth. The results show that leverage, dividends distribution, market-to-book, return on equity, firm size and revenue growth could be used as explanatory factors to classify firms’ life cycle stages. Keywords: Life cycle, Accounting ratios, Finance, Brazilian public companies, Capital market.
1. INTRODUCTION The life cycle theory of the firm, originating from the product life cycle theory, albeit traditionally applied to scientific studies associated with the Marketing, Strategy and Management disciplines (YAN; ZHAO,2010), has drawn the attention of international researchers in the accounting and finance disciplines as can be observed in the seminal studies by Miller and Friesen (1980; 1984), Fama and French (2001), De Angelo et al. (2006) and Dickinson (2011). Generally, studies in the literature use as an analytical tool the multiple linear regression or binary logistic regression from a Life Cycle proxy associated with the Theory of Dividends, such as dividends paid out and capital allocation. These studies assess the relevance and association of the proxies defined with independent variables. The literature has been presenting the ability of accounting numbers to predict and explain stages of bankruptcy and insolvency (BEAVER, 1966; ALTMAN, 1968; CARDOSO et al., 2010), financial constraints (FAZZARI et al., 1988; FAMA; FRENCH, 1995; DEMONIER, 2013) and future cash flows (SUBRAMANYAM, 1996; BROCHET; NAM; RONEM, 2008).
Corresponding author: † Universidade Federal do Espírito Santo (UFES). E-mail:
[email protected] Ω Universidade Federal do Rio de Janeiro (PPGCC/UFRJ). E-mail:
[email protected] ¥ Universidade Federal do Espírito Santo (UFES). E-mail:
[email protected] * Universidade Federal do Espírito Santo (UFES). E-mail:
[email protected] Received: 01/21/2015. Revised: 03/26/2015. Accepted: 02/03/2016. Published Online: 05/02/2017.
DOI: http://dx.doi.org/10.15728/bbr.2017.14.3.3
This article has a Creative Commons License - Attribution 3.0 Not Adapted.
Specialized publications have been addressing the correlation between different life cycle stages of organizations with the characteristics of firms (FAMA; FRENCH, 2001; DE ANGELO et al., 2006, DENIS; OSOBOV, 2008; COULTON, RUDDOCK, 2011), capital structure (OWEN, YANSOM, 2010; WARUSAWITHARANA, 2013), growth opportunity (FAMA; FRENCH, 2001), profitability (WARUSAWITHARANA, 2013) and revenue growth (BULAN, YAN, 2010). Thus, accounting and financial variables can also have predictive and/or explanatory capacity of the stages of firms’ life cycle, that may present different behavior in each of them, motivating the following research question: Which accounting and financial variables can be directly associated with the classification of companies according to the life cycle stage? The aim of this study is to investigate the accounting and financial variables that can be directly related to the classification of firms according to the life cycle stage. In other words, we seek to empirically identify the accounting determinants of the life cycle stages of listed Brazilian firms, i.e., accounting and financial variables that characterize certain times of corporate life. To conduct this study we collected a sample containing 1,515 observations between 2005-2012, where each company is classified within a life cycle stage, according to its cash flow characteristics proposed by Dickinson (2011), for subsequent application of the multinomial logistic regression, where each level of the dependent variable is a stage of the life cycle. Dickinson (2011) demonstrates how combinations of operating, financing and investing cash flows can be used to identify the life cycle stage of firms. From the metrics created, the author analyzes how life cycle stages explain various corporate factors, in particular, profitability patterns (return on net assets, profit margin, asset turnover, variation in returns). The present study expands the seminal study by Dickinson (2011) by verifying accounting and financial factors that explain the propensity of firms to fit into certain life cycle stages. Among these factors, we highlight size, leverage, growth opportunity, return on equity, dividends payout and revenue growth. Therefore, unlike previous studies, this study contributes to the literature in the Life Cycle Theory of the Firms and in accounting and finance by presenting evidence that accounting variables explain life cycle stages differently according to the evidence of the multinomial logistic regression model. The article is presented in two parts. First, we address key scientific studies on the association between the life cycle of firms and their accounting and financial ratios and which served as the basis for this work. The second part corresponds to the empirical study conducted, describing the proposed research methodology and the classification method of the adopted life cycle stages, and the construction of the econometric model of multinomial logistic regression and the obtained evidence.
2. THEORETICAL FRAMEWORK AND DEVELOPMENT OF HYPOTHESES Accounting as a source of information for the decision-making by the most various users (Stakeholders), treats the entity as an organization made to operate for an indefinite time. Thus we have two views on indefinite duration of the company. The first one says that, as a result of commitments having different deadlines, new commitments need to be undertaken continuously in the future so that all are met. The second view holds that the company in operation is a company that is adapted to itself through the sale of its assets in the ordinary course of business, i.e., an ordinary liquidation process, rather than a forced liquidation (HENDRIKSEN; BREDA, 1999).
BBR 14,3 305
BBR 14,3 306
To maintain this indefinite duration, the company must overcome internal and external factors to evolve. Miller and Friesen (1980) draw an analogy between the life cycle of firms with the life cycle of primitive organisms. The authors saw that both are complex organisms. The organizational adaptation is a process that results in the growth or dissolution of the company. One factor that influences the organizational adaptation is time. Understanding the time dimension in the organization helps to understand the process of adaptation and the interrelations between decisions and events (MILLER; FRIESEN, 1980). The research of firms’ life cycle investigates the changes that the company suffers over time, as organizational changes occur in predictable patterns characterized by developmental stages. Transitions are expected insofar as simple and young organizations become more complex and older (NECYK; SOUZA; FREZATTI, 2007). According to Greiner (1998), organizations go through five distinct stages of evolution, and each contains a relatively calm period of growth that ends with a crisis in management, with the previous phase strongly influencing the later stage. The life cycle of firms can be compared to the life of animals. The organizational life cycle is a divided model in stages through which a company can go through during its existence (COSTA; BOENTE, 2012). However, unlike animals’ life cycle, the cycle of organizations is not necessarily sorted into a chronological order. Thus, a company in the birth stage can move to its stage of decline. Miller and Friesen (1984) found that, even though organizations may present a tendency to evolve into a linear sequence over its life cycle stages, nonlinear evolutions can occur, since in each life cycle stage companies present special characteristics. The life cycle of products is characterized by progression, i.e., from the birth to the decline stages. However, the company is a portfolio of various products. New products innovation, expanding into new markets and structural changes can cause the company to move between the life cycle stages in a non-sequential manner. For this reason, the life cycle of the company can be cyclical in nature, and the main objective of the company is to remain at the Growth and Mature stage where the return and risk structure is optimized (DICKINSON, 2011). According to Gort and Klepper (1982), the life cycle stages can be classified into five stages, but companies do not necessarily need to go through each stage in order: I) The first stage, named as the “Introduction”, also termed as Birth, corresponds to the stage where the company seeks opportunities to establish themselves in the market, in some cases, through the insertion of new products on the market where other companies will copy it. The time period in the Birth stage will depend on the speed at which other companies will copy the product and launch it on the market; II) The second stage: “Growth”, the company is focused on investments, the number of competitors increases. This stage is characterized by the acceptance of the market towards the company’s products, i.e., the market is not yet saturated by the new product inserted therein; III) In the third stage, “Mature”, competition among participants is more defined, and the number of new entrants in the market is close to zero, and this suggests that the distribution of revenue (market-share) occurs among participants; IV) The fourth stage “Shake-out”, or Turbulence, the entry of new entrants in the market is negative and may result in the last stage of the life cycle; V) The last stage is called “Decline”, which corresponds to the Decline phase, where entrants into the market is zero, and obtaining revenue to cover costs and keep the activities is unstable (GORT; KLEPPER, 1982). Analyzing the life cycle in the organizational context is a difficult task (DICKINSON, 2011). Other authors such as Miller and Friesen (1980) and Almeida and Luz (2010) analyzed the company’s life cycle at the level of management, planning and product or focusing on the contingency theory. However, Dickinson (2011) proposed a proxy to identify the life cycle stages of firms through accounting variables.
Dickinson (2011) classifies the life cycle of firms through the “organic” methodology where the life cycle stage is defined by the performance and allocation of resources as opposed to arbitrary allocation. Also according to Dickinson (2011), the main advantage of using the cash flow pattern proxy is the entire financial information of the organization’s information sets, i.e., operating, investment and financing instead of a single metric to determine the life cycle. The use of variables such as age of the company, sales growth, capital expenditures, dividends payout or a compound of these variables requires the consideration of a prior hypothesis regarding the underlying distribution of life cycle membership, i.e., a uniform distribution of the life cycle stages is assumed. On the other hand, cash flow patterns are the organic results of a company’s operations and foster better congruence with the economic theory (DICKINSON, 2011). According to the theoretical foundation of firm life cycle, organizations undergo consistent patterns of development over time (AUZAIR, 2010). In this sense, some studies indicate expected behavior in relation to accounting and financial ratios for the various life cycle stages. Companies that are in the Birth stage are initiating their introduction in the market. Often they need to face strong competition from established organizations, demanding capital to steady themselves in the market and move to the next stage (GORT; KLEPPER, 1982). Their structures are simple and centralized. Decisions are made by the founder, being guided more by intuition than analytical models and few opinions are taken into account in key decisions (NECYK; SOUZA; FREZATTI, 2007). Thus, in early stages (Introduction and Growth), companies are expected to have high growth opportunities, accompanied by high expenditures, but with little ability to finance themselves through internal resource, so they will seek external financing in a greater measure. As they reach maturity, companies can generate resources internally by profit accumulation, relying less on external financing that increases leverage (OWEN, YANSOM, 2010; WARUSAWITHARANA, 2013). At the growth stage, the company’s structure tends to become more specialized, more effort is expended in collecting and processing information about the competitive environment (monitoring) to control financial performance (NECYK; SOUZA; FREZATTI, 2007). The growing company, can thus focus on making investments, the acquisition of subsidiaries and sales growth (DRAKE, 2013). According to Fama and French (2001), there is evidence of correlation between growth opportunity and the life cycle of firms, and this correlation indicates that firms in development would have greater growth opportunities in relation to mature firms. Growth and Maturity are the stages of the life cycle in which companies aspire political arrangements to maintain environmental stability, although this stage is characterized by a decrease in innovation. The structure is more professional (NECYK; SOUZA; FREZATTI, 2007). When the company is in the Maturity stage, it becomes more conservative, less inclined to risk and innovation, thus enabling greater freedom over the decision to distribute dividends or not. Unlike the early stages, now firms are able to generate resources internally through profit accumulation and may turn to the expansion process (OWEN, YANSOM, 2010; WARUSAWITHARANA, 2013). One of the research streams of the Life Cycle Theory, the Theory of Dividends (FAMA, FRENCH, 2001, DE ANGELO et al., 2006; DENIS, OSOBOV, 2008; COULTON, RUDDOCK, 2011), suggests that the effects of dividends payout and retained earnings vary with firms life cycle, working as proxies for the cycle itself. According to this strand, companies in early stages have a lower chance of internal resource generation, lower profitability and, on the other hand, greater investment needed to enter the market, and are therefore more likely to retain earnings. Having achieved Maturity, a higher profitability is expected, thus generating greater resources for their investment needs. Consequently, excess resources will be distributed to shareholders as dividends.
BBR 14,3 307
BBR 14,3 308
At the Shake-out stage firms face adverse period of operation due to changes in the environment, as in the event of a crisis, leading to the reduction and reconfiguration of the market and therefore, to the moment of probable decline in sales and profitability. This stage usually precedes the decline stage, but it can migrate or not to this stage, since the firm will still seek to change its strategy in order to revitalize the company (DRAKE, 2013). When the company is at the Shake-out stage, it needs to change behavior and strategy patterns so it can go back to its previous stage, when it was profitable (LESTER; PARNELL; CARRAHER, 2003). The Decline stage, can be considered as a critical moment for the company’s survival, because at this stage the company has negative revenue growth, with decreased responsiveness to challenges (NECYK; SOUZA; FREZATTI, 2007). Failure to meet external demands at an earlier stage led the company to a period of decline, in which it experiences a lack of profit and a reduction in market share (LESTER; PARNELL; CARRAHER, 2003). The Decline stage can therefore occur, after any other stage, for example, directly after the Introduction stage, if the firm fails to establish itself in the market (DICKINSON, 2011). According to the finance literature, whereas firms in the Growth stage present overall, high sales growth rates (BULAN; YAN, 2010), and mature firms present stable rates, since they are established in a market, with widely known product and competitors also established, in the Decline stage, companies are expected to present stagnant or decreasing sales revenue. In this study, the hypotheses developed to examine the relationship between the life cycle stages and accounting and financial ratios are presented together because the econometric model (multinomial logit) explains the probability of a firm being in a given stage of the cycle and the effects of the ratios compared to the Maturity stage. H1: Companies in the early stages (Introduction and Growth) are smaller in size and profitability, with higher financial leverage and growth opportunities than those in the mature stage. H2: Companies in stages of Turbulence and Decline present greater negative variations in sales and have less opportunities for growth and profitability in relation to firms in the Maturity stage. H3: Firms in the Maturity stage have higher dividends payouts compared with companies in other stages of life cycle. H4: Firms classified in the Growth stage have greater positive variations in sales (growth) if compared with companies in the Maturity stage.
3. RESEARCH DESIGN To empirically verify the theoretical assumptions on firm’s life cycle we resorted to the use of accounting and financial ratios of listed Brazilian firms in a multinomial logistic regression, estimated by the maximum likelihood method. The multinomial logistic regression is used to analyze categorical dependent variables (greater than two categories), comparing themselves to multiple groups, from binary logistic regressions between each group and a reference category. Thus, we compute the classification probabilities of the observations in each group by the odds ratio. Although the life cycle stages are ordinal in nature at first, so that it would follow progressively from Introduction to Decline, Miller and Friesen (1984) point out that companies can fall back between stages, therefore, with no sequential order being absolute. Thus, due to the dynamics of firms and the very environmental factors to which they are subject, the sequential progression of firms life cycle stages may not be suitable. For example, companies in the Introduction stage can go directly to the Decline and the bankruptcy stage, as well as a mature company, in developing a new product, go back to the Growth stage.
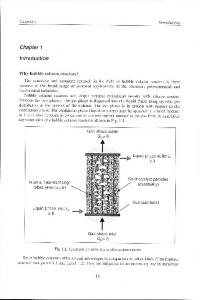
Besides the theoretical point of view, by virtue of the type of classification adopted here and limitations in the availability of data, as well as the possible impact of the 2008 crisis on the behavior of the sample, we cannot ensure the use of observations that antecede the assumptions of validity of the ordinal regression, whatever the existence of proportional odds ratio between pairs of successive categories. Thus, the adoption of multinomial logistic regression, which does not presuppose the existence of order among the categories, seems to be suitable for the research purposes. We collected accounting and financial data available from Economática and Thomson One of Brazilian public companies listed on the São Paulo Stock Exchange (BM&FBOVESPA) , covering annual observations from 2005 to 2012. Data were extracted from the consolidated financial statements and in the absence of these, from non-consolidated reports. We excluded financial institutions from the sample, since they have specific accounting standards and regulatory prerogatives, as well as companies with incomplete or unavailable data. Finally, in the sample we considered companies with data available in each year of analysis, regardless of whether they present data for other periods. The sample was also treated for the presence of outliers, we excluded observations with standard deviations greater than 3 of the normalized data. The final sample consists of 313 companies, totaling 1,515 valid observations, organized on pooled data. Table 1 shows the development of the database and stages of sample treatment. The data for the dependent variable classification were extracted from the Cash Flow Statement (CFS) accounting report that became mandatory for public companies or with equity above 2,000,000 (BRL), only from 01.01.2008, by the law 11.638/07, however, some companies released this statement already voluntarily in prior periods or due to regulatory requirements. Companies that did not have this information were excluded from the sample. Among the main proxies of firm life cycle highlighted in the accounting literature: dividend payouts, retained earnings on assets, revenue growth and the age of the company. However, for this study, we adopted the classification method proposed by Dickinson (2011), based in an integrated manner, on the behavior of firms’ cash flows regarding their operating, investing and financing activities, whereas the combination of cash flows covers various aspects/conditions of organizations. Through the composition of the cash variation signal (Operating, Investing and Financing), we classified each company at a certain stage of the life cycle, as in the following Table 2: According to Dickinson (2011), on Introduction, the operating cash flow is negative due to lack of full knowledge of start-ups regarding the dynamics of revenue and costs. At the same time, companies will make large investments (negative sign on the ICF) to support the firm’s entry in the market and will therefore, need external financing (positive sign on the FCF). Growing businesses will make major investments to expand (negative sign on the ICF) and the assertion in the market, thus requiring high external financing (positive sign on the FCF). During this period, the profit margin will increase, positively impacting the operating cash flow. During Maturity, firms will have greater knowledge of the market and its operations leading to maximization of profit (positive OCF); On the other hand, growth opportunities tend to stabilize whereas the maintenance costs of assets grow, negatively impacting on investing cash flow. However, firms in the mature stage will distribute their profits to the shareholders in the form of dividend payouts and will prioritize for funding with internally generated resources (positive FCF).
BBR 14,3 309
BBR 14,3 310
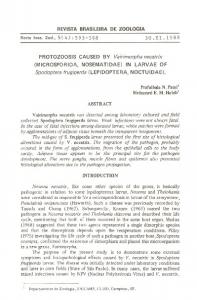
Table 1. Development of database Panel A – Total of companies Total of companies (-)Financial and funds sectors (-)Companies with null sector on Economática (-)Companies with incomplete data (=)Total of companies in the sample Panel B: Processing of data for use in model Raw information (-)Empty cells (-)Outliers and observations above or below three standard deviations (=)Total of observations for the model Observations per variable (16.665 observations / 11 variables )
896 (79) (163) (341) 313 87.808 69.384 (1.759) 16.665 1.515
Table 2. Life Cycle Classification based on Dickinson (2011, p. 1974) Cash Flow Operating (OCF) Investing (ICF) Financing (FCF) Life Cycle:
+ Birth
Composition of signals for Classifying Life Cycle Stages + + + + + + + + + + + Growth Maturity Shake-out Decline
Companies in the decline stage however, face growth and prices falls, resulting in a negative operating cash flow. Therefore, in order to meet its obligations, these firms are expected to be focused on renegotiation/payment of debts, demanding therefore, the liquidation of assets, consequently generating positive variation on investment. Regarding the period of Shake-out, Dickinson (2011) did not find in the economic literature a consolidated theory as to its characteristics. We assume, therefore, that the impact of cash flows will vary from case to case, and the stage will be classified by exclusion of others, i.e., for positive or negative variation situations for all activities, for situations where the financing activity is negative. Next, Table 3, presents the number of classified observations at each life stage after applying the method by Dickinson (2011), i.e., from the signals composition of cash variation drawn from the statements of companies’ cash flows, as presented in Table 3, totaling 1,515 observations. We can observe that the greater frequencies, as expected, occur in stages of Growth and Maturity. A possible bias arising from this distribution is considered in the developed models. To illustrate the non-linear change of firms life cycle stages comprising the sample in this study, we developed Table 3. Out of a total of 313 companies of the sample comprising the 1,515 observations, 84 did not change their life cycle stage, representing 276 observations. Companies identified in the Introduction stage, 41% migrated to the Growth stage. Those initially identified in the Growth stage, 55% remained in this stage and 36% migrated to Maturity. Companies that were in the Maturity stage, 62% remained in this stage and 30% moved to the Growth stage. Companies that were in the Shake-out stage, 29% remained there, 28% migrated to the Growth stage and 28% migrated to the Maturity stage. Companies that were in the Decline stage, 36% remained in this stage and 29% returned to the Maturity stage. As noted by Costa and Boente (2012) and Miller and Friesen (1984), the behavior of firms in the various life cycle stages does not follow an erratic pattern. It is possible for companies to change to between different stages over the years due to different characteristics
and strategies. However, as expected this variation occurs largely between the neighboring stages in the sample. As shown in Table 4, considering companies with observations over at least two years in a row, almost 80% of the companies that were in the Introduction stage in a year remained in this stage or moved to the Growth or Maturity stages. The same reasoning applies to the growth stage, since 91% of companies that were in this stage in a given year either in it or moved to the mature stage. For Maturity, 92% of companies remained either remained in this stage or moved to growth. In relation to Shake-out stage, we noted that 85% of companies either remained in this stage or moved to Maturity or Growth. Finally, we observe that 96% of companies in the decline stage either remained for another year in this stage or returned to the Shake-out or Mature stages. Thus, it is noticed that the possibly erratic classification of cash flows did not cause such an erratic variation in the classification of companies in the various life cycle stages. Based on the collected variables, we applied a multinomial logistic regression model in order to test the potential determinants of the classification probability of enterprises in each life cycle stage, namely: Introduction, Growth, Mature, Shake-out or Decline. The employed logistic regression uses the binomial distribution to examine the simultaneous impact of multiple explanatory factors in the probability of “success” against the chance of “failure” (FÁVERO et al., 2009). We adopted the Mature stage as a reference dependent variable, which the other categories will be analyzed against. In the multinomial regression we use the c-1 logit functions to apply the regression, with c being the number of categories of the dependent variable, so that the overall function of the conditional probability of the model for the 5 categories, according to Hosmer and Lemshow (2000, p. 263), is presented in the equation 1:
Considering these hypothesis, we developed the following econometric model:
Where: P(LIFE CYCLE): Categorical dependent variable, which can assume the following values: 1- Introduction, 2- Growth, 0 - Mature, 3- Shake-out, 4- Decline. DIVit: Dividends paid by the company i at time t divided by the shareholders’ equity (book value). LEVit: Debt-to-Asset, variable that measures the degree of leverage of company i at the time t, calculated by dividing the total liabilities by the total assets. ROE it: Return on equity, calculated by dividing net income by the shareholders’ equity of firm i at time t. MTBit: Market-to-Book, growth opportunity Proxy. Calculated by the market value over shareholders’ equity of firm i at the time t. SIZEit: Size of the firm i at the time t. Calculated by the natural logarithm of the total assets. REVG it: Revenue growth. Dummy for income variation between times t-1 and t, with 1 for positive variations (increased sales) and 0 for negative variations (reduction in sales). The option for the binary transformation of the sales growth variable due to identified collinearity problems. The maintenance of the variable is necessary since the growth variable is essential to identify firm financing decision patterns,
BBR 14,3 311
BBR 14,3 312
Table 3. Total of Analyzed Observations Life cycle stage Introduction Growth Mature Shake-out Decline Total
Nº observations 50 660 659 118 28 1515
% 3% 44% 43% 8% 2% 100%
differentiating, especially companies going through Growth and Mature (BULAN; YAN, 2010). The hypotheses developed from the previously referenced literature resulted in the following table of expected beta coefficients for each independent variable (Table 5), having as reference the Mature stage. The NA cells refer to the signs either inconclusive or not contemplated in the consulted literature, i.e., in which the analysis could not be applied due to lack of theoretical/empirical basis to support a hypothesis to be tested related to the life cycle stage.
4. RESULTS 4.1 DESCRIPTIVE STATISTICS In Table 6, next, we present the descriptive statistics of each independent variable for each life cycle stage. We must highlight that the analysis is indicative only, since the statistical difference was not assessed. We note that the Maturity stage concentrates the greater volume of dividend payouts and increased profitability. in Shake-out and in Decline, the Market-to-Book values are lower. However, unlike the expected, it is in the Mature stage that we observe the highest average value for the Market-to-Book. In relation to leverage, we observe that the highest values are found in the early stages. Finally, in relation to the size, companies in the Mature stage are smaller on average. As for the dichotomous variable revenue growth, we observe that almost 90% of companies in the Growth stage present positive variations in sales, whereas almost 60% of companies in the Decline stage present negative variations in sales. Thus, generally speaking, these values point to a variable behavior consistent with the formulated hypotheses which will be analyzed by multinomial logistic regression. To strengthen such understanding, we proceeded to a Variance Analysis – ANOVA, which sought to analyze whether there was a statistically significant difference of the accounting ratios between companies in different life cycle stages. In the case of differences being observed, we would have evidence that these indicators could have different behavior depending on the life cycle stage in which the company was. The p-values found for each ratio were the following: DIV (