Mar 26, 2013 - Abstract: In this paper we present TEXTGRIDTOOLS, a free Python .... fills this gap by providing three of the most popular measures: Cohen's.
In: Proceedings der 27. Konferenz zur Elektronischen Sprachsignalverarbeitung, pp. 152-157, March 26–28, 2013, Bielefeld, Germany
T EXT G RID T OOLS : A T EXT G RID P ROCESSING AND A NALYSIS T OOLKIT FOR P YTHON Hendrik Buschmeier, Marcin Włodarczak Bielefeld University {hbuschme, mwlodarczak}@uni-bielefeld.de
Abstract: In this paper we present T EXT G RID T OOLS, a free Python package for processing, querying and manipulating Praat’s TextGrid files. T EXT G RID T OOLS improves on many deficiencies of Praat’s embedded scripting language by providing a clean data model for TextGrid objects and their attributes, and offering functionality for common annotation-related tasks, for instance calculation of interannotator agreement measures. Owing to seamless integration with other Python tools, such as data analysis libraries and interactive interpreters, users gain access to a versatile and powerful computing environment without the need of repeated format conversions.
1
Introduction
Praat [1] has become a de-facto standard tool for phonetic analysis, transcription of speech, and classification of speech events. To this end, it provides an intuitive point-and-click user interface for selecting intervals or points in audio data and for labelling these with arbitrary text, which is then displayed time-aligned alongside the waveform. Praat supports annotation on multiple independent tiers, allowing for application of multidimensional annotation schemata, annotations with different degrees of granularity, or transcriptions of individual participants in a dialogue recording. Much of Praat’s usefulness comes from its programmability via a simple embedded scripting language, ‘Praat script,’ which provides full access to Praat’s functions and data structures, and can greatly help to automatise tedious and time consuming tasks. However, in spite of its many virtues and its ease of use, Praat script lacks basic features of modern programming languages, such as return statements in functions, iterators, or even basic data structures such as lists or hash tables. Additionally, not being a general-purpose language, it falls short of functionality which is not directly tied to Praat itself, such as plotting or statistical analysis. These limitations are particularly evident when Praat script is used to manipulate Praat’s native annotation objects, stored in plain text ‘TextGrid’ files. Such tasks often do not require any of Praat’s advanced audio analysis features but would greatly benefit from access to specialised text processing tools and simple integration with external data analysis libraries. Faced with lack of such functionality, Praat users wishing to carry out more complex analyses on their annotations are forced to first export their data into some intermediate format, such as comma-separated files, before importing them into a data analysis framework of their choice. To overcome these shortcomings, we have developed ‘T EXT G RID T OOLS,’ a Python package offering functions to parse, manipulate and query Praat annotations. T EXT G RID T OOLS implements all of TextGrid-related objects, such as interval and point tiers, as native Python classes and offers a clean API for accessing their attributes. Additional functions are available for performing more complex operations, such as calculation of inter-annotator agreement measures between several annotation tiers.
PREPRINT
TextGrid
1
1..n
Tier
1
0..n
1
PointTier
IntervalTier
1
Annotation
0..n
0..n
Point
Interval
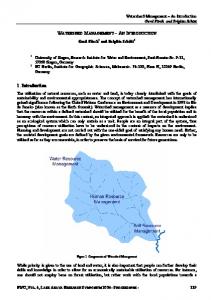
Figure 1 - Class diagram of T EXT G RID T OOLS’ data structures. TextGrid consists of an ordered list of Tiers, each of which consists of an ordered list of Annotations. Concrete tiers are either of type IntervalTier or PointTier, holding annotations of concrete types Interval or Point, respectively.
Coupled with Python’s expressive syntax, T EXT G RID T OOLS allows for more compact and human-readable program code than that of Praat script. Additionally, with access to a fullyfledged programming language, users are able to carry out their analyses in one step, without Praat script serving as a mere exporting tool. Using T EXT G RID T OOLS annotations can be accessed directly from a Python program and processed using one of Python’s many data analysis libraries (e.g., NumPy, SciPy, Matplotlib, RPy or pandas, cf. [4]). T EXT G RID T OOLS are released under the GNU General Public Licence v3.0, and hosted on GitHub1 , enabling users to contribute their changes and extend the existing functionality.
2
Data model
Praat natively stores labels and annotations in ‘TextGrid’ objects. A TextGrid object holds information about its tiers and their ordering. Each tier has a name, a type (i.e., whether it is an ‘interval tier’, or a ‘point tier’), and stores the labelled annotations (i.e., intervals or points). TextGrid objects are saved in plain text ‘TextGrid’ files. The data structures of T EXT G RID T OOLS mirror the structure of Praat’s TextGrid objects. The Python classes IntervalTier and PointTier implement Praat’s tiers types. These hold ordered lists of objects of the class Interval or Point respectively. Multiple tiers are grouped in objects of the class TextGrid. Shared structure and functionality between IntervalTier and PointTier as well as Interval and Point are inherited from parent classes Tier and Annotation. See Figure 1 for the class diagram of T EXT G RID T OOLS. T EXT G RID T OOLS’ data structures are lean, relying mostly on Python’s build-in data structures. An Annotation object consist of a start and an end time (their left and right boundary) and a variable for storing a text label. In a Point object, start and end times are by definition equal. A Tier object consists essentially of a list of Annotation objects, ordered by their time values. Consequently, adding a new annotation to a tier using the method add annotation inserts it at the correct position within the list (or fails with an exception if the required space is already occupied by an existing annotation). TextGrid objects also maintain a simple list of Tiers. 1
https://github.com/hbuschme/TextGridTools/
3
Using T EXT G RID T OOLS
In our experience, T EXT G RID T OOLS has three main use cases. Firstly, it can be used for loading existing TextGrid files into Python. Manually annotated speech data is then available in native Python objects and can be used for data analysis, agreement calculation, or training and evaluation of machine learning algorithms. Secondly, annotations can be created in Python and saved as TextGrid files. This is useful for automating simple – but tedious – annotation tasks in order to reduce the amount of human annotators’ work. It is also useful for incorporating data streams that are not compatible with Praat (i.e., non-audio data). Human annotators can then build on these automatically generated annotations for harder annotation tasks. The third use case consists in manipulating TextGrid files. Examples include extracting information from a TextGrid file (tier names, number of intervals, etc.), concatenating or merging two or more TextGrid files or correcting segmentations in a TextGrid file by shifting all boundaries by a specified amount of time. Below we outline some of the functionality used in common TextGrid processing tasks, and briefly discuss ways of incorporating T EXT G RID T OOLS into a Python-based scientific computing environment. 3.1
Searching and querying
Praat provides a number of basic functions for querying TextGrids and their tiers, mainly in the time domain, such as retrieving time stamps and durations of annotations. Additional functions exist for extracting labels of intervals and points and for counting the number of occurrences of a given label in a tier. However, some of these operations are fairly cumbersome. For instance, an interval label can be queried using an interval index but not a time stamp. The latter requires a separate call to function Get interval at time..., which returns an interval index given a time stamp argument. Similarly, tiers can only be accessed by their indices but not by their names. While a function Get tier name... exists, finding a tier with a specified name requires iterating over all tiers in a TextGrid. T EXT G RID T OOLS solves many of these problems, while at the same time extending Praat’s native functionality. For example, T EXT G RID T OOLS allows direct access to a tier of a TextGrid object: import tgt # Loading TextGridTools # Read a TextGrid file tg = tgt.read_textgrid(’32-V-NC-B.TextGrid’) # Access specific tiers by name ipu_tier = tg.get_tier_by_name(’IPU-speaker’) feedback_tier = tg.get_tier_by_name(’FB-listener’)
Within each tier, annotations can be accessed directly by specifying a time stamp (in IntervalTiers annotations can be searched by left or right boundary, or an arbitrary time value falling anywhere within an interval). Additionally, both Point and Interval objects lying the closest to some time stamp (but not necessarily coinciding with it) can be located. Given two time stamps, all annotations lying between them are returned: # Get all annotations from the first minute fb_1st_minute = feedback_tier.get_annotations_between_timepoints(0,60)
Since Tier objects are implemented as Python iterators, their elements can also be accessed similar to elements in a list using indexing and slicing. Additionally, interval and point labels
can be filtered by a specified string or a regular expression. It is thus easy to get a list of all annotations in a tier whose text labels match a certain pattern: # Get all annotations with a text label ’p2’ or ’P2’ fb_p2 = feedback_tier.get_annotations_with_regex(r’[pP]2’)
The get nearest annotation method is an example of the level of granularity which T EXT G RID T OOLS allows. In its simplest form the method searches for an annotation with a non-empty label whose boundary lies the closest to the specified time stamp. In more complex cases, however, the search can be limited to start or end boundaries, to the right or left-hand context, or to annotations with labels matching a specific regular expression whose boundaries do not overlap with the input time stamp. For example: # Find the interval with a non-empty label whose boundary # lies the closest to the right or to the left of 21.43 s feedback_tier.get_nearest_annotation(21.43) # Find the interval whose end time lies the closest # to the left of 21.43 s with a text label ’P1’ or ’P1A’ feedback_tier.get_nearest_annotation(21.43, regex=r’P1A*’, direction=’left’, boundary=’end’) # As above but exclude the interval actually coincinding with 21.43 s feedback_tier.get_nearest_annotation(21.43, regex=r’P1A*’, direction=’left’, boundary=’end’, exclude_overlapeed=True)
The tgt.util module provides high-level functions operating on multiple Tiers or whole TextGrid objects. As an example, overlaps between intervals matching a specified regular expression in two IntervalTiers can be conveniently calculated: # Overlaps between non-empty (the default) intervals in the first two tiers. ovlp_fb = tgt.util.get_overlapping_intervals(ipu_tier, feedback_tier) # Overlaps between empty intervals in the first two tiers. silences = tgt.util.get_overlapping_intervals(ipu_tier, feedback_tier, regex=’ˆ\s*$’, label=’sil’)
Further high-level functions exist for merging and concatenating TextGrid objects, as well as for shifting all timestamps in a Tier by the specified amount of time. Otherwise, modifying TextGrids, for instance batch replacement of annotations’ text labels, can be largely accomplished by means of native Python methods – such as looping – in combination with the basic methods provided by T EXT G RID T OOLS’ classes. 3.2
Calculating inter-annotator agreement
Since Praat is frequently used as an audio transcription tool, a common task which is at present not supported by Praat itself is calculating inter-rater or inter-annotator agreement measures. T EXT G RID T OOLS fills this gap by providing three of the most popular measures: Cohen’s kappa [2], Scott’s pi [6] and Fleiss’s kappa [3]. The maximum misalignment between the compared annotations as well as their labels can be set to custom values. An example of calculating all three agreement measures is presented in the code listing below. # Cohen’s kappa for the first two tiers cohen_kappa = tgt.agreement.agreement(tg.tiers[:2], method=’cohen-kappa’) # Scott’s pi for the first two tiers with the maximum # allowed time stamp mismatch of 10 ms
scott_pi = tgt.agreement.agreement(tg.tiers[:2], method=’scott-pi’, precision=0.01) # Fleiss’s kappa for annotations with non-empty labels in the first # three tiers which do not end with a question mark. fleiss_kappa = tgt.agreement.agreement(tg.tiers[:3], method=’fleiss-kappa’, regex=r’[ˆ?\s]\s*$’)
Since both Cohen’s kappa and Scott’s pi are only defined for two annotators, if more than two tiers are passed to these functions, pairwise agreement scores are calculated. Addition of further agreement measures is planned. 3.3
Writing TextGrid objects to disk
As expected, T EXT G RID T OOLS provides means to write TextGrid objects into Praat’s native TextGrid file format (both the long and the short flavours are supported). Furthermore, T EXTG RID T OOLS is currently able to export TextGrid objects as files in ELAN’s [7] XML-based EAF format and, using Python’s standard csv module, as tables in comma-separated form (CSV). Writing a TextGrid object to a file is done in the following way: # Writing the textgrid as a short TextGrid file tgt.write_to_file(tg, ’output.TextGrid’, format=’short’) # Writing the textgrid as an ELAN file, omitting all empty intervals # as well as point tiers tgt.write_to_file(tg, ’output.eaf’, format=’eaf’, include_empty_intervals=False, include_point_tiers=False)
3.4
Integrating T EXT G RID T OOLS into a Python-based data analysis environment
One of the goals behind T EXT G RID T OOLS has been integration of tools used in processing annotations produced with Praat. It is, therefore, desirable that data analysis and visualisation also be done with the same tools. In recent years a wide range of data analysis libraries have evolved and matured in the Python ecosystem [4]. They include, among others, tools for data analysis (pandas), numerical (NumPy) and scientific (SciPy) computing, data visualisation (Matplotlib), statistical modelling (Statsmodels) and natural language processing (NLTK). Interfaces to other data analysis tools (e.g. RPy) also exist. Coupled with an interactive shell such as IPython [5], which provides a web-based interface and in-line plotting capabilities, Python can serve as an extremely powerful integrated data analysis environment. As a pure Python package, T EXT G RID T OOLS can be easily integrated into that environment. A particularly convenient workflow consist of reading TextGrid files into an interactive webbased IPython notebook, extracting the relevant data with T EXT G RID T OOLS, converting the output to a pandas DataFrame object (a Python analogue of R’s data.frame) and carrying out all further analyses using the libraries mentioned above.
4
Conclusions
T EXT G RID T OOLS offers new ways of working with TextGrid files, freeing users from the limitations of Praat’s scripting language and multiple format conversions necessitated by an amalgam of incompatible processing and analysis toolkits. By integrating T EXT G RID T OOLS with other Python-based libraries, data analysis becomes more flexible and transparent, resulting in less time spent writing and debugging code.
T EXT G RID T OOLS is free software and can be extended collaboratively by the community at large. We are convinced that a single powerful library provides a much better solution to annotation-processing problems than a myriad of Praat scripts floating aimlessly around the Internet. Acknowledgements — This research is supported by the Deutsche Forschungsgemeinschaft (DFG) in the Center of Excellence EXC 277 in ‘Cognitive Interaction Technology’ (CITEC) and by the BMBF-funded ‘Professorinnenprogramm’ FKZ 01FP09105A.
References [1] P. Boersma and D. Weenink. Praat: Doing phonetics by computer. Computer program, 2013. http://www.praat.org/. [2] J. Cohen. A coefficient of agreement for nominal scales. Educational and Psychological Measurement, 20:37–46, 1960. [3] J. L. Fleiss. Measuring nominal scale agreement among many raters. Psychological Bulletin, 76:378–382, 1971. [4] W. McKinney. Python for Data Analysis: Agile Tools for Real World Data. O’Reilly, Sebastopol, CA, 2012. [5] F. P´erez and B. E. Granger. IPython: A system for interactive scientific computing. Computing in Science and Engineering, 9:21–29, 2007. [6] W. A. Scott. Reliability of content analysis: The case of nominal scale coding. Public Opinion Quarterly, 19:321–325, 1955. [7] P. Wittenburg, H. Brugman, A. Russel, A. Klassmann, and H. Sloetjes. ELAN: A professional framework for multimodality research. In Proceedings of the 5th International Conference on Language Resources and Evaluation (LREC), pages 1556–1559, Genoa, Italy, 2006.