1
MODELING MOTIVATIONS AND PERCEPTIONS OF PORTUGUESE TOURISTS
Antónia Correia, University of Algarve, Portugal Patricia Oom do Valle, University of Algarve, Portugal Cláudia Moço, University of Algarve, Portugal
Submission: July 2005 Revision: October 2005 Acceptance: November 2005
The authors acknowledge grant support from AIR LUXOR, SA for this study and the suggestions of Arch Woodside. Send correspondence to Antónia Correia, Faculty of Economics, University of Algarve, Campus de Gambelas, 8000-117 Faro, Portugal; Tel: +351 289 800 100 ext7426; Fax:+351 289862045 (Email address :
[email protected]). Patrícia Oom do Valle, the Faculty of Economics, University of Algarve, Campus de Gambelas, 8000-117 Faro, Portugal. (E-mail:
[email protected]).
2 MODELLING MOTIVATIONS AND PERCEPTIONS OF PORTUGUESE TOURISTS
Abstract The present paper focuses on the study of the Portuguese tourist demand motivations in exotic places. This study offers an integrated approach to understanding tourist motivation and attempts to extend the empirical evidence on the relationships between the push and pull motivations in order to determine to what extent these motivating factors will contribute to the overall perception of the destination. For this purpose, we use a detailed survey, conducted in 2004, on a sample of 1,097 individuals. The performed analyses find six motivators’ factors influencing the formation of the perceptions and the choice of a tourist destination.
Key words: Motivations, perceptions, multivariate statistical analysis.
MODELLING MOTIVATIONS AND PERCEPTIONS OF PORTUGUESE TOURISTS
INTRODUCTION Considering the motive model of Crompton (1979), this study offers an integrated approach to understanding tourism motivations in terms of the causal relationships among the push and pull motives and the way these constructs contribute to the overall perception of tourist destination. The proposed theoretical model is tested with a structural equation modeling procedure (Joreskog and Sorbom, 1986). The relationships among specific push motives, pull motives and perceptions are more deeply explored with the application of a categorical principal components (CATPCA). This study has clear implications for the definition of marketing strategies, compatible with the motivator factors that strongly contribute to the overall perception of a tourist destination. The paper has the following organization. The first section represents the theoretical framework of the study and briefly reviews the previous literature on the models and empirical results about the constructs of the proposed model. The following section defines the conceptual model and describes the methodology used. The final section presents the results and discusses some of their implications and limitations.
LITERATURE REVIEW “Motivation is the need that drives an individual to act in a certain way to achieve to the desired satisfaction” (Beerli and Martín, 2004, p. 626). People decide to travel for different reasons and motives, perceived as forces that reduce a state of tension. This state gives rise to a need that stimulates an attitude or behaviour (Fodness, 1994). In
4 practice, all human behaviours are motivated even though the choices to satisfy needs can depend of other psychological variables (Crompton, 1979). In the most cases, previous tourism research only focused on a single construct of motivations (cognitive or emotional) in order to explain the tourist decision (Gnoth, 1997; McCabe, 2000). Crompton (1979) identifies psychological or social motives (push motives) which support the wish to travel. On the other hand, pull motives are those that affect the option regarding the place to visit and are related to the attributes of the destination (Lundberg, 1990). According to Gnoth (1997), the need for holidays depends on wishes such as self actualization, self-esteem and social status. Based on intrinsic and extrinsic motivations, the tourist builds his/her own perceptions (Gartner, 1993; Dann, 1996; Baloglu, 1997). As Gnoth (1997) refers, perceptions about a destination can be reduced to a behavioural or cognitive perspective. The cognitive structures constitute the point at which the forming of the image represents the integration of the internal and external stimuli into the “awareness set” (Woodside and Lysonski, 1989; Crompton, 1979). In general, the conclusion that perceptions are determined by personal and interpersonal motives (push motives), and also by the way they perceive tourism destination attributes, (pull motives) could be drawn. On the other hand, tourist motivations should be perceived as a multidimensional concept in which different understandings about their constructs are determinants in the tourist decision (McCabe, 2000).
METHOD The model this article presents proposes the interaction between the constructs of motivations and perceptions. Figure 1 depicts the hypothetical causal model. The literature review provides the basis for the selection of each component of the model.
5 The model is based on the traditional breakdown between push and pull motives and this model’s contribution relies on the identification of relationships between the two constructs of motivations.
“Figure 1 here”
We test the model using data from a survey applied to a sample of 1,097 Portuguese tourists, who were flying to exotic places (such as, Brazil, Morocco, Egypt, Mexico, Sao Tome and Principe) during August and September, 2004. The flights were on Air Luxor, SA which has a significant market share in Portugal as a tour operator and as an air travel company. As proposed by Maio and Olson (1994), we used a seven point likert-type scale in order to assess the push and pull motives, as well as perceptions.
Statistical data analysis methodology Statistical data analysis in this study follows three main stages. In the first stage, we apply a principal components analysis (PCA) to the set of push and pull motives in order to reduce data. In the second stage, we estimate the structural equation model with the purpose of testing the underlined research hypotheses. The factors obtained with PCA are used as indicators of the constructs push and pull motives. The model is estimated with the software Analysis of Moment Structures (AMOS 5) (Arbuckle and Wothke, 1999) and the weighted least squares (WLS) estimation method is applied. In the last stage, the focus is on the relationship among each push factor, pull factor and perceptions. This analysis begins by recoding these variables in order to get categorical variables. Afterwards, we explore the nature of these relationships by the application of a CATPCA. The fact that this method allows the simultaneous relation of
6 one set of categorical variables, and the presentation of the results geometrically in a low-dimensional space, which is called perceptual map, is an important aspect.
RESULTS Push factors PCA allows the reduction of the initial fifteen push motives into three new factors. Considering the meaning of the motives with higher loadings, the push factors were labelled knowledge, leisure and socialization. The first factor, knowledge, is especially related with the need for doing and learning new things as well as exploring different cultures and places. The Leisure factor mainly includes motives related with personal well-being. The third factor, Socialization, put forward the need to go to places that friends have not been, sharing travel experiences and developing close friendships (Table 1).
“Table 1 here”
Pull factors Table 2 presents the results from the application of PCA to the nineteen pull motives. Pull factors were labelled facilities, core attractions and landscape features.
The
facilities factor encompasses the regional and tourism facilities of a destination, such as, lodging, weather, food, security, roads and hospitality. The second factor, core attractions, includes, for example, motives related to the social environment, night life, sports activities and shopping facilities. The last pull factor, landscape features, relates strongly to the natural and cultural environment of the tourist destination.
“Table 2 here”
7 According to Yoon and Uysal (2005), the destination attributes may stimulate and reinforce inherent push motivations. In turn, different combinations of push and pull factors are expected to give rise to different perception levels of a tourist destination.
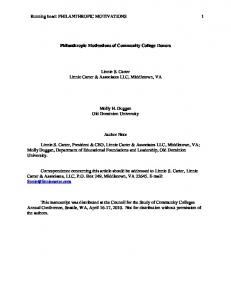
Structural equation model Figure 1 shows the structural equation model that we propose in order to examine the nature of the relationships among push and pull factors and overall perceptions of the destination. Figure 2 presents the estimated standardized path coefficients on the model itself. Table 3 reports the values for the selected overall fit measures.
“Figure 2 and Table 3 here”
Categorical principal components analysis Having transformed the pull and push factors into ordinal variables, we applied a CATPCA in order to complement the evaluation provided by the structural equation model Figure 3 is the perceptual map that combines categories of each pull factor with categories of each push factor. Socialization and knowledge are particularly related to facilities; Leisure is specially associated to core attractions.
“Figure 3 and 4 here”
The study includes a similar analysis regarding the relationships among each pull factor and perceptions (Figure 4). These relations are weaker than the previous ones, reported between pull and push factors. The perceptual map also suggests that Landscape features is the pull factor less related with perceptions and the existence of a
8 very similar association between perceptions and Facilities, on one hand, and perceptions and Core attractions, on the other hand.
CONCLUSIONS AND MANAGERIAL IMPLICATIONS The major findings of this study have significant managerial implications for destination marketing. Firstly, the exploratory analysis shows that the decision to travel to exotic places arises from the desire of knowledge, having social status and intellectual leisure and also that these factors determine the perceived pull motives: facilities, core attractions and landscape features. Since tourists were found to be more aware of facilities and core attractions, marketing of these destinations must be especially focused on these factors rather than on beautiful images of natural landscapes. These empirical results could be fundamental in order to conduct and target the destination marketing strategy to enhance the overall perception of these exotic places. Secondly, the structural model and CATPCA analyses reveal that the demand for exotic places is mainly determined by social and intellectual rewards and even to the tourists who just wants to relax, special attention must be given to the activities to be offered because tourists do not understand leisure as “doing nothing”. Knowing why people travel the way they do may lead to the offer of appropriated attractions and activities to the right tourist. These findings suggest that the destination marketing must be focus on push motives to enhance the destination’s competitiveness. Thirdly, CATPCA suggests two levels of awareness concerning the perception of an exotic destination: highly involved tourists and moderately involved tourists. Even though all tourists should receive attention from destination managers, special focus
9 should be given to the later in order to avoid the risk of dissatisfaction at the end of the trip. This study contributes to the understanding of why the tourists behave the way they do. Firstly, this was the first time that motivations and perceptions were combined in order to understand why people could be pushed to travel to exotic destinations and how they form their perceptions. Secondly, only now has the outbound Portuguese tourist market been studied at a more scientific level; lastly this was the first time that structural equation modelling and CATPCA are combined in order to explain consumer behaviour. The empirical evidences from this study are interesting and open path avenues for investigations. The study has, however, some limitations. The main one is the domain of study which can be considered quite restricted. The model should be generalized in order to better understand the tourist behaviour. A replication of the study for other destinations, with different attributes and for tourists of other nationalities with different motivations, would help to improve the model and discover more reliable constructs.
REFERENCES Arbuckle, J. L., & Wothke, W. (1999). AMOS 4.0 User’s Guide. Chicago, Small Waters Corporation, USA. Baloglu, S. (1997). The relationship between destination images and sociodemographic and trip characteristics of international travelers. Journal of Vacation Marketing, 3, 221-233. Beerli, A., & Martín, J. D. (2004). Tourists’ characteristics and the perceived image of tourist destinations: a quantitative analysis – a case study of Lanzarote, Spain. Tourism Management, 25 (5), 623-636.
10 Crompton, J. (1979). Motivations of pleasure vacations. Annals of Tourism Research, 6 (4), 408-424. Dann, G. M. S. (1996). Tourists’ images of a destination – an alternative analysis. Recent Advances and Tourism Marketing Research, 41-55. Fodness, D. (1994). Measuring tourist motivation. Annals of Tourism Research, 21 (3), 555-581. Gartner, W. C. (1993). Image formation process. In M. Uysal & D. R. Fesenmaier (Eds.), Communication and Channel Systems in Tourism Marketing (pp. 191-215). New York Haworth Press. Gnoth, J. (1997). Tourism motivation and expectation formation. Annals of Tourism Research, 24 (2), 283-304. Joreskog, K. G., & Sorbom, D. (1986). LISREL VII: Analysis of Linear Structural Relationship by Maximum Likelihood and Least Square Method, Mooresville. In: Scientific Software. Lundberg (1990). The tourist business (6th ed.). Van Nostrand Reinhold: New York. Maio, G. R., & Olson, J. M. (1994). Value-attitude-behaviour relations: the moderating role of attitude functions. British Journal of Social Psychology, 33, 301312. McCabe, A. S. (2000). Tourism motivation process. Annals of Tourism Research, 27 (4), 1049-1052. Woodside, A. G., & Lysonski, S. (1989). A general model of travel destination choice. Journal of Travel Research, 27 (4), 8-14. Yoon, Y., & Uysal, M. (2005). An examination of the effects of motivation and satisfaction on destination loyalty: a structural model. Tourism Management, 26 (1), 45-56.
11 Figure 1. Proposed hypothetical model
Push motives
Perceptions
H3 H1
H2 Pull motives
Figure 2. Standardized estimates of proposed model 0.50
Knowledge
0.96
Leisure
0.69(*) 0.02
0.34(*)
- 0.31
Push motives
H3 0.72
0.52 (*)
Socialization
0.81 (*)
Perceptions
Perceptions
0.80
H2
H1
0.80 (*) Pull motives
0.77(*) Facilities
0.36 (*)
0.41 (*)
Core attractions
Landscape features
0.40
0.87
0.78
(*) p < 0.01
Figure 3. Joint plot of category points for push and pull factors 1,2
L 0,9
H H
L
Knowledge Socialization Leisure Facilities
L
Dimension 2
0,6
Core attractions Landscape features
0,3
H LM
0,0
MM
-0,3
L - Low valorization M - Medium valorization H – High valorization
MMMH H
L L
-0,6 -1,5
-1,0
-0,5
0,0
Dimension 1
0,5
1,0
12 Figure 4. Joint plot of category points for pull factors and perceptions H
Perceptions
H H
Facilities Core attractions
0,5
Dimension 2
Landscape features
L
M
H 0,0
L - Low valorization M - Medium valorization H – High valorization
LM
LM
-0,5
L/M -1,0
-1,0
-0,5
0,0
Dimension 1
0,5
1,0
13 Table 1. Principal components of push motives (after varimax rotation), means and ranks Push motives and Factor
Loadings
Knowledge Do different things Stimulate emotions and sensations Be an adventurer Have fun Increase knowledge Know different cultures and lifestyles Enriching myself intellectually Know new places Find interesting people Leisure Relieving stress Escape from the routine Relaxing physically Socialization Developing close friendships Going places my friends have not been Talking with my friends about the trip
% Reliability Mean Rank Variance (Alpha Explained Cronbach)
0.7 0.6 0.6 0.7 0.8 0.8 0.8 0.8 0.6
1.0
5.9 5.4 5.2 6.0 5.9 5.1 5.8 6.0 5.4
7 10 11 4 6 13 8 3 9
33.4
0.8 0.8 0.8
18.7
0.9
6.1 6.1 5.9
2 1 5
0.6 0.9 0.9
16.3
0.8
5.1 3.7 4.1
12 15 14
Table 2. Principal components of pull motives items (after varimax rotation) Items and Principal Components Facilities Weather Lodging Beaches Hospitality Gastronomy Security Relaxing atmosphere Accessibilities Core Attractions Standard of living Different ethnics Distance Shopping facilities Sports equipment Social environment Night-life Transports Landscape features Landscape Natural environment Cultural attractions
Loadings
0.8 0.7 0.7 0.7 0.7 0.7 0.7 0.6 0.7 0.7 0.7 0.7 0.7 0.6 0.6 0.6 0.8 0.8 0.7
% Variance Explained
26.4
Reliability (Alpha Cronbach)
0.9
23.3
0.9
13.9
0.9
Mean
Rank
5.8 5.1 5.7 5.5 4.8 4.7 5.3 4.6
2 7 4 5 11 13 6 14
3.3 4.8 4.4 4.7 4.4 4.9 4.5 4.3
19 10 17 12 16 9 15 18
5.7 5.8 5.0
3 1 8
14 Table 3. Goodness-of-fit indices for the estimated structural model Absolute fit measures Chi-square = 22.23 (p = 0.008) RMSR = 0.038 RMSEA = 0.046
Incremental fit measures
Parsimonious fit measures
AGFI = 0.98 NFI = 0.97 TLI = 0.96 IFI = 0.98 RFI = 0.93 CFI = 0.98
Normed Chi-square = 2.47