Atmos. Chem. Phys. Discuss., https://doi.org/10.5194/acp-2018-564 Manuscript under review for journal Atmos. Chem. Phys. Discussion started: 16 July 2018 c Author(s) 2018. CC BY 4.0 License.
1
Multi-Satellite Retrieval of SSA using OMI-MODIS algorithm
2
Kruthika Eswaran1,2*, Sreedharan Krishnakumari Satheesh1, 2 and Jayaraman Srinivasan1, 2
3
1
Centre for Atmospheric and Oceanic Sciences, Indian Institute of Science, Bangalore, India
4
2
Divecha Centre for Climate Change, Indian Institute of Science, Bangalore, India
5
*Correspondence to: Kruthika Eswaran (
[email protected])
6
Abstract - Single scattering albedo (SSA) represents a unique identification of aerosol type and
7
aerosol radiative forcing. However, SSA retrievals are highly uncertain due cloud contamination
8
and aerosol composition. Recent improvement in the SSA retrieval algorithm has combined the
9
superior cloud masking technique of Moderate Resolution Imaging Spectroradiometer (MODIS)
10
and the better sensitivity of Ozone Monitoring Instrument (OMI) to aerosol absorption. The
11
combined OMI-MODIS algorithm has been validated over a small spatial and temporal scale
12
only. The present study validates the algorithm over global oceans for the period 2008-2012. The
13
geographical heterogeneity in the aerosol type and concentration over the Atlantic Ocean, the
14
Arabian Sea and the Bay of Bengal was useful to delineate the effect of aerosol type on the
15
retrieval algorithm. We also noted that OMI overestimates SSA when absorbing aerosols were
16
present closer to the surface. We attribute this overestimation to data discontinuity in the aerosol
17
height climatology derived from Cloud-Aerosol Lidar and Infrared Pathfinder Satellite
18
Observations (CALIPSO) satellite. OMI uses pre-defined aerosol heights over regions where
19
CALIPSO climatology is not present leading to overestimation of SSA. The importance of
20
aerosol height was also studied using the Santa Barbara DISORT radiative transfer (SBDART)
21
model. The results from the joint retrieval were validated with ground-based measurements and
22
it was seen that OMI-MODIS SSA retrievals were better constrained than OMI only retrieval.
1
Atmos. Chem. Phys. Discuss., https://doi.org/10.5194/acp-2018-564 Manuscript under review for journal Atmos. Chem. Phys. Discussion started: 16 July 2018 c Author(s) 2018. CC BY 4.0 License.
23
1.
Introduction
24
Aerosols of different types are spatially distributed heterogeneously and at different altitudes in
25
the atmosphere. Depending upon their properties, certain aerosols (biomass and carbon) warm
26
the atmosphere by absorbing radiation, while other aerosols (sea salts and sulphates) cool the
27
atmosphere by scattering radiation (Ramanathan et al., 2001). Due to the opposing effects on the
28
atmosphere aerosols can have either net warming or cooling effect on the global climate
29
depending upon the aerosol type, concentration and vertical distribution. Effect of aerosols on the
30
global climate is measured by 'aerosol radiative forcing' (the perturbation to the earth’s radiation
31
budget caused by the presence of aerosols). Positive forcing implies atmospheric warming and
32
vice-versa. (Liao and Seinfeld, 1998; Podgorny and Ramanathan, 2001; Satheesh, 2002; Johnson
33
et al., 2003; Kim et al., 2004; Moorthy et al., 2004; Meloni et al., 2005; Satheesh and Moorthy,
34
2005; Seinfeld and Pandis, 2006; Satheesh et al., 2008; Chand et al., 2009; Mishra et al., 2015).
35
According to the climate assessment report, the estimation of aerosol radiative forcing is a major
36
cause of uncertainty in the estimation of climate sensitivity and therefore presents a great
37
impediment to climate modeling (IPCC, 2013). The uncertainty is largely due to the lack of
38
accurate measurement of the scattering and absorbing properties of the aerosols (Cooke and
39
Wilson, 1996; Menon et al., 2002; Chung and Seinfeld, 2002; Bond and Sun, 2005).
40
The Single Scattering Albedo (SSA), (the fraction of radiation scattered out of total
41
extinction of radiation) is used to distinguish the scattering and absorbing properties of aerosols.
42
SSA represents a unique fingerprint of the type of aerosol and its radiative forcing (Hansen et al.,
43
1997; Haywood et al., 1997; Myhre et al., 1998). In general, purely scattering aerosols have SSA
44
value of approximately 1 while highly absorbing aerosols have SSA less than 0.7. However,
45
SSA values lack high certainty (Bond and Bergstrom, 2006; Bond et al., 2013). Uncertainties in
2
Atmos. Chem. Phys. Discuss., https://doi.org/10.5194/acp-2018-564 Manuscript under review for journal Atmos. Chem. Phys. Discussion started: 16 July 2018 c Author(s) 2018. CC BY 4.0 License.
46
SSA measurements are due to factors such as cloud contamination, instrumentation error and
47
aerosol modification due to atmospheric processes. Better SSA retrievals (both in-situ and
48
satellite-based) are required to reduce the uncertainty in SSA for a more accurate estimation of
49
aerosol forcing; particularly over regions influenced by a variety of air masses. There is also a
50
need for accurate spectral aerosol absorption measurements, which is required to validate SSA
51
derived from satellite measurements (Bergstrom et al., 2007).
52
Studies on the various direct measurements of SSA and their uncertainty evaluation have
53
been performed previously (Horvath, 1993, Heintzenberg et al., 1997; Moosmuller et al., 2009).
54
Along with ground-based retrievals of SSA, there have been other indirect methods to retrieve
55
the parameter using satellite images and observations (Table 1).
56
Though these previous studies on ground-based measurements have brought a fundamental
57
understanding to the estimation of amounts of aerosols / aerosol chemistry, their restricted spatial
58
and temporal extent is a major limitation. Moreover, these studies also have a reduced
59
availability of scenes for indirect retrievals. Some techniques are limited due to cloud
60
contamination while others operate only under specific conditions (e.g. presence of sun glint).
61
This presents a need for better SSA retrieval algorithms that overcome the present technical
62
limitations and that can be applied on a global scale. The global extent of observations from
63
satellites has increased the spatial extent of the observations (Kaufman et al., 2002a). Though the
64
satellite-based retrievals have been shown to be extremely successful over the majority of ocean
65
and land regions, they still have a limited success over deserts and ice sheets. Over deserts and
66
ice-sheets, high surface reflectance affects the satellite retrievals in visible spectrum. To counter
67
this, SSA is retrieved in UV spectrum (330 nm to 400 nm) over these regions (Torres et al., 1998,
68
2007). In UV spectrum, the upwelling radiances are highly sensitive to the aerosol absorption
3
Atmos. Chem. Phys. Discuss., https://doi.org/10.5194/acp-2018-564 Manuscript under review for journal Atmos. Chem. Phys. Discussion started: 16 July 2018 c Author(s) 2018. CC BY 4.0 License.
69
and also have a lower influence of surface albedo (Torres et al., 2007). SSA retrieval in UV
70
spectrum also avoids difficulties encountered in scenarios where there are large surface
71
reflectance contrasts.
72
The quality of OMI SSA retrievals is affected by sub-pixel cloud contamination and the
73
spectral surface albedo (Torres et al., 2007). To counter the problems and uncertainties in the
74
OMI SSA retrieval (Table 2), Satheesh et al. 2009 used retrieval from multiple satellites. They
75
used combined retrieval from OMI-MODIS since sensors on each of the satellites have their own
76
strengths and both fly within few minutes of each other in the A-train constellation (Stephens et
77
al., 2002). The better cloud-screened retrieval of AOD from MODIS (Levy et al., 2003) and the
78
high sensitivity of OMI to aerosol absorption were used to develop a hybrid algorithm to retrieve
79
SSA (Satheesh et al., 2009). The study was performed over Atlantic Ocean and Arabian Sea for
80
the year 2006. A comparison of the retrieved aerosol height with aircraft measurements showed
81
that OMI-MODIS was more accurate than OMI. Gasso and Torres (2016) performed a detailed
82
analysis of the OMI UV product retrievals over oceans and island sites. They compared the OMI
83
retrieved AOD with MODIS and AERONET AODs. This work used the OMI-MODIS algorithm
84
for only two particular cases over and near Africa to understand how the assumption of aerosol
85
height and shape affected AOD and SSA retrievals. It was found that when the actual height from
86
satellite Lidar was used instead of climatological values and when the shape of dust aerosols was
87
assumed to be non-spherical, the retrievals by OMI agreed better with other observations
88
including OMI-MODIS method. While the OMI-MODIS algorithm has been used in calculating
89
aerosol radiative forcing (Satheesh et al., 2010) over oceanic regions surrounding India and used
90
in retrieving SSA over land (Narasimhan and Satheesh, 2013) as well as used to understand the
91
retrievals of OMI UV products for two particular cases (Gasso and Torres, 2016), a detailed
4
Atmos. Chem. Phys. Discuss., https://doi.org/10.5194/acp-2018-564 Manuscript under review for journal Atmos. Chem. Phys. Discussion started: 16 July 2018 c Author(s) 2018. CC BY 4.0 License.
92
analysis of the algorithm on a larger spatial and temporal scale has not been done so far.
93
The current work applies the OMI-MODIS algorithm to retrieve SSA on a global scale. It is
94
applied over global oceans from 2008-2012. Regional analysis over the Atlantic, the Arabian Sea
95
and the Bay of Bengal has been done by incorporating the aerosol layer height and the type of
96
aerosols. A simulation study using Santa Barbara DISORT Radiative Transfer (SBDART) model
97
was performed to highlight the importance of aerosol layer height. After estimating SSA values
98
using the OMI-MODIS algorithm, the present study then uses cruise measurements of SSA from
99
the Integrated Campaign for Aerosols, Gases and Radiation Budget (ICARB) and winter ICARB
100
campaigns over Arabian Sea and Bay of Bengal in 2006 and 2009 to validate the same (Moorthy
101
et al., 2008, 2010).
102
2.
103
2.1. OMI
104
The Ozone Monitoring Instrument (OMI) on board the Aura satellite was launched in 2004. For
105
OMI measurements two aerosol inversion schemes are used- OMI near UV (OMAERUV)
106
algorithm and the multi-wavelength (OMAERO) algorithm (Torres et al., 2007). The OMAERO
107
algorithm uses 19 wavelengths in the range of 330-500 nm to retrieve corresponding aerosol
108
characteristics. For the present study we have used the OMAERUV algorithm which uses
109
measurements at two wavelengths 354 nm and 388 nm. The reason behind choosing these
110
wavelengths is the high sensitivity of upwelling radiances to aerosol absorption and the lower
111
influence of surface in measurements due to low reflectance values in the UV region. This gives
112
a unique advantage of retrieving aerosol properties over ocean and land including arid and semi-
113
arid regions (Torres et al., 1998; 2007).
114
Data
The products derived from the algorithm include AOD, absorption aerosol optical depth
5
Atmos. Chem. Phys. Discuss., https://doi.org/10.5194/acp-2018-564 Manuscript under review for journal Atmos. Chem. Phys. Discussion started: 16 July 2018 c Author(s) 2018. CC BY 4.0 License.
115
(AAOD) and single scattering albedo (SSA). These are derived from pre-computed reflectance
116
values for different aerosol models. Three major types of aerosols have been used - Desert dust,
117
carbonaceous aerosols from biomass burning and sulphate-based aerosols. Each type has seven
118
models of SSA. The retrieved products of OMAERUV are sensitive to the aerosol layer height
119
(Torres et al., 1998). The values are derived at surface and at 1.5, 3.0, 6.0 and 10.0 km above the
120
surface. The best estimate of the values of AOD, AAOD and SSA of a particular choice of
121
aerosol vertical distribution are evaluated.
122
Due to the high sensitivity of SSA retrieval to the assumption of aerosol height and aerosol
123
type, the OMI algorithm was improved (Collection 003-PGE V1.4.2, Torres et al., 2013) using
124
climatology of aerosol layer height from CALIPSO (Cloud-Aerosol Lidar and Infrared
125
Pathfinder Satellite Observations) along with carbon monoxide (CO) measurements from AIRS
126
(Atmospheric Infrared Sounder) for better identification of carbonaceous aerosols. Torres et al.
127
(2013) showed that the combined use of AIRS CO measurements and OMI Aerosol Index (AI)
128
retrievals, helped in identifying the type of absorbing aerosol. Thus smoke layers were identified
129
when values of AI and CO measurements were high and during events of high AI and low CO
130
values, the aerosols were identified as dust. The AIRS CO measurements were also used to
131
identify large aerosol loading which was otherwise represented as clouds by the OMAERUV
132
algorithm. Using collocated observations of OMI and CALIOP, Torres et al. (2013) estimated the
133
height of elevated absorbing aerosols for a 30-month period from July 2006 to December 2008.
134
An effective aerosol height was calculated from the attenuated backscatter weighted with
135
average height using the CALIOP 1064 nm measurements. The 30-month climatology of aerosol
136
height was used in the OMAERUV algorithm and validated with Aerosol Robotics Network
137
(AERONET) observations (Torres et al., 2013). The results showed that there was improvement
6
Atmos. Chem. Phys. Discuss., https://doi.org/10.5194/acp-2018-564 Manuscript under review for journal Atmos. Chem. Phys. Discussion started: 16 July 2018 c Author(s) 2018. CC BY 4.0 License.
138
in the retrievals. The original aerosol height assumptions were used in the algorithm over regions
139
where the climatology was unavailable. For the present study we have used the improved
140
OMAERUV algorithm along with AOD, SSA retrievals at different aerosol heights and as well
141
as the best estimates of AOD and SSA.
142
2.2. MODIS
143
The Moderate Resolution Imaging Spectrometer (MODIS) instrument in Aqua satellite was
144
launched in 2002. This instrument, with 36 spectral channels has a unique ability to retrieve
145
aerosol properties with better accuracy over both land and ocean (Remer et al., 2005; Levy et al.,
146
2003). Of these, seven channels (0.47-2.13 μm) are used to retrieve aerosol properties over ocean
147
(Tanre et al., 1997).
148
As described in Remer et al., (2005), before the retrieval algorithm, masking of sediments,
149
clouds and ocean glint is performed to separate valid pixels from bad ones. The retrieval
150
algorithm of MODIS (also called the inversion procedure) has been described in detail
151
previously (Tanre et al., 1997; Levy et al., 2003; Remer et al., 2005). The algorithm uses a ‘look-
152
up table’ (LUT) approach, i.e., for a set of aerosol and surface parameters, radiative transfer
153
calculations are performed. Spectral reflectance derived from the LUT is compared with
154
MODIS-measured spectral reflectance to find the ‘best’ (least-squares) fit. The resulting
155
combination of modes provides the aerosol model from which size distribution, properties
156
including spectral optical depth, effective radius etc. is derived. The product used from MODIS
157
is the Level 2 aerosol (MYD04, Collection 5.1) product. The parameter chosen is
158
'Effective_Optical_Depth_Average_Ocean' which provides the aerosol optical depth over ocean
159
at seven wavelengths. The value is the average of all the solutions in the inversion procedure
160
with the least-square error < 3%.
7
Atmos. Chem. Phys. Discuss., https://doi.org/10.5194/acp-2018-564 Manuscript under review for journal Atmos. Chem. Phys. Discussion started: 16 July 2018 c Author(s) 2018. CC BY 4.0 License.
161
A combination of OMI and MODIS helps indirectly in counteracting the cloud
162
contamination problem and also uses the strength of the individual sensors – OMI's sensitivity to
163
aerosol absorption combined with the better cloud screening of MODIS and accurate retrieval of
164
AOD, and aerosol size (Satheesh et al., 2009; Narasimhan and Satheesh, 2013).
165
3.
166
MODIS has high spatial pixel resolution of 10km x 10km at nadir (and a cloud mask at 500m
167
and 1km resolution) whereas OMI has a resolution of 13 km x 24 km. This results in a pixel
168
being prone to cloud contamination which overestimates AOD and underestimates single
169
scattering co-albedo (1-SSA) (Torres et al., 1998). However, AAOD can be retrieved in the
170
presence of small cloud contamination since there is cancellation of errors (Torres et al., 2007).
Algorithm
171
The higher accuracy in MODIS retrieval over ocean is due to the fact that it has large
172
number of channels in the Shortwave Infrared (SWIR) region (Tanre et al., 1997; Remer et al.,
173
2005; Levy et al., 2003). While OMI is highly sensitive to aerosol absorption in the near-UV
174
region, the accuracy in the retrieval of AAOD depends on the aerosol layer height assumption.
175
OMI provides AOD and AAOD at different heights as prescribed by various aerosol types
176
(Torres et al., 2007).
177
The assumption of aerosol layer height in the OMI algorithm restricts the retrieval of AOD
178
and AAOD. Using this as basis, the approach proposed in Satheesh et al. (2009) used MODIS
179
AOD as an input to the OMI retrieval algorithm, so that the inversion, now checked, can use the
180
information to infer the aerosol layer height and SSA. To know the SSA at 388 nm, the AOD
181
used should also be at the same wavelength. Satheesh et al. (2009) extrapolated MODIS AOD
182
and compared the estimated UV AOD with high quality ground-based AERONET observations.
183
The deviation between MODIS-extrapolated AOD and AERONET AOD was greater at higher
8
Atmos. Chem. Phys. Discuss., https://doi.org/10.5194/acp-2018-564 Manuscript under review for journal Atmos. Chem. Phys. Discussion started: 16 July 2018 c Author(s) 2018. CC BY 4.0 License.
184
AERONET AOD values. This was attributed to the presence of large number of fine-mode
185
aerosols which affected AOD at UV wavelengths. Hence to improve the linear extrapolation,
186
information on the aerosol spectral curvature was also included. This was achieved by using an
187
average regression equation to correct the MODIS AOD (Satheesh et al., 2009; Equation 3).
188
They showed that MODIS AOD can be linearly extrapolated to 388 nm and use the corrected
189
AOD as input to the OMI retrieval algorithm. The present work uses the same algorithm as
190
proposed by Satheesh et al. (2009) to retrieve SSA over the oceans for the region 60S-60N and
191
180W-180E from December 2007-November 2012. The methodology is described in detail in the
192
following section.
193
4.
194
The AOD for ocean obtained from the Level 2 aerosol product of MODIS (MYD04) was used.
195
Using linear extrapolation, AOD at 388 nm (hereafter, AOD388) was calculated from AOD at
196
seven wavelengths ranging from 0.47-2.13 μm, after the inclusion of aerosol spectral curvature
197
defined in Satheesh et al. (2009). OMI provides AOD and SSA for five different aerosol layer
198
heights starting from surface and at 1.5, 3.0, 6.0 and 10.0km (AODomi and SSA388). It also
199
provides the best estimate of SSA calculated for a particular aerosol vertical distribution
200
(SSAomi).
Methodology
201
For the present study, polar regions are not included and hence pixels from both OMI and
202
MODIS that are outside the 60S-60N and 180W-180E region are excluded. Pixels with invalid or
203
missing values are also excluded. To reduce computation time the various parameters extracted
204
from the data were re-gridded onto a uniform grid of 0.5˚ x 0.5˚ within the region of study. For
205
both the satellites, this procedure was repeated for each swath data which were then combined to
206
calculate the daily means.
9
Atmos. Chem. Phys. Discuss., https://doi.org/10.5194/acp-2018-564 Manuscript under review for journal Atmos. Chem. Phys. Discussion started: 16 July 2018 c Author(s) 2018. CC BY 4.0 License.
207
The daily data from collocated MODIS and OMI were utilised in the final algorithm. As
208
mentioned before OMI provides AOD and SSA for five different aerosol layer heights. Using
209
AOD388 as the reference, the corresponding aerosol layer height was calculated from the five
210
AODomi values through linear interpolation. This height is then used as a reference to find the
211
SSA using interpolation from the set of SSA388 values. Finally, this SSA (SSAomi-modis), and the
212
best estimate of SSA (SSAomi) were compared to each other.
213
5.
214
The spatial distribution of SSA retrieved using OMI is shown in Fig. 1a. The values are averaged
215
over five years and plotted seasonally.
Results
216
The SSA retrieved using OMI-MODIS algorithm is shown in Fig. 1b.
217
SSA over open oceans is close to 1 due to the presence of large amount of sea-salt and
218
sulphate. Closer to land, a variety of aerosols are present which results in SSA varying from 0.75
219
to ~1. Over the oceans, separating ocean colour effects and aerosol concentrations is difficult.
220
Hence the OMI algorithm retrieves only if there are enough absorbing aerosols present, i.e.AI
221
>=0.8 (Torres et al., 2013). Only pixels whose quality has been assigned as 0 or the highest
222
quality by OMI have been used. Since 2007, observations have been affected by a phenomenon
223
called the row anomaly which reduces the quality of radiance at all wavelengths. The points
224
flagged for row anomaly are not used in this study. Further information about row anomaly can
225
be found in Jethva et al. (2014). Thus, the retrievals did not cover the entire globe. From Fig.1a it
226
can be seen that majority of the valid SSA retrievals were over major aerosol sources in the
227
world and not over remote oceanic regions like central equatorial Pacific or Antarctic ocean. The
228
major sources include the vast biomass outflow over Atlantic Ocean from the west coast of
229
Africa, the dust over Arabian Sea from the arid areas of Arabia & Africa and the dust blown over
10
Atmos. Chem. Phys. Discuss., https://doi.org/10.5194/acp-2018-564 Manuscript under review for journal Atmos. Chem. Phys. Discussion started: 16 July 2018 c Author(s) 2018. CC BY 4.0 License.
230
Atlantic Ocean from Sahara. Other regions like the east coast of China, Bay of Bengal are
231
influenced by a variety of anthropogenic aerosols during different seasons. Both the algorithms
232
capture the major oceanic regions which are influenced by large number of aerosols.
233
Two important regions over oceans influenced by a variety of aerosols are the Atlantic
234
Ocean and the oceans around the Indian subcontinent. The new approach was used over these
235
regions- Atlantic (5N-30N; 60W-20W) (ATL) and Arabian Sea and Bay of Bengal (0-25N; 55E-
236
100E) (ARBOB).
237
5.1. Difference in SSA retrieval algorithms during different seasons
238
To understand how the OMI-MODIS algorithm compared with the retrieval using existing OMI
239
algorithm, the difference between SSAomi-modis and SSAomi (ΔSSA) averaged over five years for
240
different seasons is shown in Fig. 2.
241
During March-April May (MAM) and June-July-August (JJA), there is a longitudinal
242
gradient in ΔSSA from the coast of Sahara towards the open Atlantic Ocean. Kaufman et al.
243
(2002a) showed that closer to the coast of Africa, aerosols are more absorbing than those away
244
from the coast. The difference in the type of aerosols as we move away from the coast could be
245
one of the reasons for the gradient in ΔSSA. The ΔSSA changes sign with season. This was
246
attributed to the dominating presence of either natural aerosols (JJA) or anthropogenic aerosols
247
(DJF).
248
Both ATL and ARBOB regions are influenced by the type of aerosols which result in a
249
complex mixture and eventually resulting in the variation in SSA distribution over each season.
250
While the spatial plot of ΔSSA in Fig. 2 represents the regions where maximum and minimum
251
differences are located around the globe, a distribution plot provides the ranges of ΔSSA which
252
dominate and which do not. The distribution of ΔSSA for different seasons averaged over five 11
Atmos. Chem. Phys. Discuss., https://doi.org/10.5194/acp-2018-564 Manuscript under review for journal Atmos. Chem. Phys. Discussion started: 16 July 2018 c Author(s) 2018. CC BY 4.0 License.
253
years (2008-2012) is plotted in Fig. 3a and 3b for the regions- ATL and ARBOB respectively.
254
DJF shows a strong positive bias in both the regions, JJA shows a negative bias and the
255
other two seasons show negligible bias. While dust outflows dominate over ATL, over ARBOB –
256
Arabian Sea is affected by dust at higher altitudes and sea-salt near the surface whereas the Bay
257
of Bengal is influenced mainly by continental and marine aerosols. The change in the sign of
258
difference could either be due to the difference in type of aerosol or the assumption in aerosol
259
layer height (ALH). To understand what type of aerosols affect these water bodies, trajectory
260
analysis is done. This helps in identifying major sources of aerosols during each season.
261
5.2. Trajectory analysis
262
5.2.1. Atlantic (ATL)
263
The region in the tropical Atlantic is surrounded by the Sahara Desert in the east and the
264
North America in the west. The transport of dust from Sahara over Atlantic Ocean is a regular
265
occurrence (Prospero and Carlson, 1972). Aerosol distribution over Atlantic is also affected by
266
the African Easterly Waves and other atmospheric dynamics in Africa (Zuluaga, 2012). The
267
Atlantic region is influenced by not only dust from Sahara, but also by aerosols from biomass
268
burning off the coast of Africa and aerosols from industries and pollution from America. Thus,
269
there is a complex mixture of aerosols over the Atlantic Ocean during any season. A 7-day back
270
trajectory analysis was performed at a location in the box (15N; 45W) using the online Hybrid
271
Single-Particle Lagrangian Integrated Trajectory (HYSPLIT) model for the years 2009-2010.
272
The trajectory was computed for different seasons at 3 heights – 500m, 1500m and 2500m above
273
mean sea level (MSL). The Atlantic Ocean was divided into four quadrants representing the
274
regions of possible sources of aerosols 1) North America, 2) Central/South America, 3) North
275
Africa and 4) Southern Africa (Fig. 4). The influence of these aerosol sources over Atlantic
12
Atmos. Chem. Phys. Discuss., https://doi.org/10.5194/acp-2018-564 Manuscript under review for journal Atmos. Chem. Phys. Discussion started: 16 July 2018 c Author(s) 2018. CC BY 4.0 License.
276
Ocean is estimated as the percentage of trajectories that start from each region respectively. The
277
maximum influence is given in bold (Table 2).
278
From Table 2 it can be seen that the major source of aerosols over the Atlantic Ocean is the
279
dust outflow from the Sahara Desert (Prospero, 1996). Extreme heating over Sahara creates a
280
layer of instability (Saharan Air Layer) which lifts the dust particles enabling long-range
281
transport. Far off the coast the warm dust layer encounters a cooler, wetter air layer causing
282
inversion. This results in the dust layer being intact over Atlantic Ocean (Prospero and Carlson,
283
1972). Field experiments like the trans-Atlantic Aerosol and Ocean Science Expeditions
284
(AEROSE I and II) showed the outflow of dust during spring and summer along with other trace
285
gases and biomass aerosols (Morris et al., 2006). However, dust is not the only aerosol present in
286
the region of study. Using an airborne differential absorption LIDAR (DIAL) system, Harriss et
287
al. (1984), found that there is advection of anthropogenic pollutants from North America to the
288
North Atlantic Ocean. Advanced very high-resolution radiometer (AVHRR) instrument on the
289
National Oceanic and Atmospheric Administration (NOAA) 11 satellite provides global aerosol
290
information. From that data it was found that large plumes over Atlantic Ocean were attributed to
291
the pollution from North America and Europe. During spring and summer, the large outflow was
292
due to the dust outbreak from Sahara and Sahel. Biomass burning from southern Africa, South
293
America and anthropogenic emissions from North and Central America dominated the aerosol
294
loading over Atlantic Ocean during winter (Husar et al., 1997). The MODIS instrument onboard
295
the Terra satellite was first used to study the transport and deposition over Atlantic Ocean. It was
296
found that during winter, the dust which was present was mixed with the biomass aerosols from
297
Sahel and closer to the coast of North America the dust was influenced by the pollution and
298
smoke from the continent. Pure dust was present over the ocean during summer months
13
Atmos. Chem. Phys. Discuss., https://doi.org/10.5194/acp-2018-564 Manuscript under review for journal Atmos. Chem. Phys. Discussion started: 16 July 2018 c Author(s) 2018. CC BY 4.0 License.
299
(Kaufman et al., 2005). From Table 2 it is also seen that the dust dominated at all heights except
300
during winter when the pollution from North America dominated at higher altitudes.
301
5.2.2. Arabian Sea and Bay of Bengal (ARBOB)
302
The Arabian Sea and the Bay of Bengal are oceanic regions on the west and east coast of
303
India respectively. Both regions are influenced by various types of aerosols during different
304
seasons. The Arabian Sea has been dominated by dust aerosols and is influenced by high levels
305
of dust during certain seasons as seen from satellite images (Sirocko and Sarnthein, 1989). Pease
306
et al. (1998) studied the geochemistry and the transport of various dust samples during different
307
cruises in different seasons. During winter and summer, the pattern of aerosol transport was
308
similar to that of the Indian monsoon pattern – northeasterly (winter) and southwesterly
309
(summer). Thus, the major sources of aerosols were the Arabian Peninsula (including Saharan
310
dust and Middle East) and Indian sub-continent in summer and winter respectively. The mean 7-
311
day back trajectory using HYSPLIT model from a point over Arabian Sea (15N; 65E) was
312
performed for each season of 2010 and at three different heights (500m, 1500m and 2500m
313
above MSL). Only one year is performed since the trajectory analysis over Atlantic Ocean
314
showed that the aerosol pathways did not vary much between years. The Arabian Sea region was
315
divided into four quadrants – 1) Arabian Peninsula and North Africa, 2) Southern Africa, 3)
316
Indian sub-continent and 4) Indian Ocean and Southeast Asia (Fig. 5). Similar to Table 2,
317
influence of different aerosol source regions over the Arabian Sea is given in Table 3.
318
Similar to Pease et al. (1998), Tindale and Pease (1999) found that transport of aerosols near
319
the surface followed the surface wind currents. The dust content was low near the surface during
320
summer due to the presence of Findlater jet, but the general dust concentrations were higher than
321
other oceanic regions. During winter, the winds are predominantly north and north easterly and
14
Atmos. Chem. Phys. Discuss., https://doi.org/10.5194/acp-2018-564 Manuscript under review for journal Atmos. Chem. Phys. Discussion started: 16 July 2018 c Author(s) 2018. CC BY 4.0 License.
322
hence results in transport of aerosols from India/Pakistan/Afghanistan onto Arabian Sea.
323
However, the presence of anticyclonic circulation over Arabia (20N; 60E) results in north
324
westerly winds transporting dust over Arabian Sea (Rajeev et al., 2000). The spring time (March-
325
April-May) is the transition between northeast and southwest monsoon. The winds become south
326
westerlies which result in the advection of aerosols from open Indian Ocean or near Somalia. At
327
higher altitudes (above the Findlater jet) dust transport occurs from Arabia. During summer, the
328
southwest monsoon wind patterns carry aerosols all the way from southeast/east Indian Ocean
329
(mainly sea-salt). As the altitude increases, the wind patterns change a little due to aerosols
330
coming from southwest Indian Ocean/Somalia. Above the Findlater jet, as explained by Tindale
331
and Pease (1999), dust transport occurs from Arabian Peninsula (Table 3).
332
Being an integral part in the Indian Summer Monsoon, studies over Bay of Bengal is
333
important especially the role of aerosols in the local climate change. While Arabian Sea is
334
dominated by dust and oceanic aerosols and only anthropogenic aerosols during SON, studies
335
have shown that Bay of Bengal is influenced by various air masses associated with Asian
336
monsoon system (Krishnamurti et al., 1998). The synoptic meteorological conditions over Bay of
337
Bengal have been studied in detail by Moorthy et al. (2003) and Satheesh et al. (2006). Similar to
338
the other two regions, mean 7-day back trajectory analysis from a point over (15N; 90N) was
339
performed for each season of 2010 and at three different heights (500m, 1500m and 2500m
340
above MSL). The four quadrants representing the various aerosol source regions are 1)
341
India/Arabian Peninsula, 2) Indian Ocean, 3) North/Northeast India and East Asia and 4)
342
Southeast Asia (Fig. 6). Table 4 represents the influence of aerosol source regions over Bay of
343
Bengal.
344
The north westerly winds occur from west to east in the Indo-Gangetic Plain (IGP) and due
15
Atmos. Chem. Phys. Discuss., https://doi.org/10.5194/acp-2018-564 Manuscript under review for journal Atmos. Chem. Phys. Discussion started: 16 July 2018 c Author(s) 2018. CC BY 4.0 License.
345
to subsidence, the aerosols are trapped in the east during winter (Dey and Di Girolamo, 2010; Di
346
Girolamo et al., 2004). The IGP with its heavy population and large number of industries acts as
347
a source for anthropogenic aerosols which are transported to Bay of Bengal during winter
348
(Kumar et al., 2013). Along with mineral dust from Arabian Peninsula, biomass aerosols from
349
Southeast Asia are also transported to the bay. Field experiments like ICARB (Moorthy et al.,
350
2008) during the spring time (pre-monsoon) showed transports of aerosols from the Arabian
351
Peninsula and also presence of elevated aerosols (anthropogenic and natural) over Bay of Bengal
352
(Satheesh et al., 2008). The post monsoon season acts as a transition from the summer to winter
353
monsoon. The winds during September are still south westerlies and during October weak
354
westerlies are present (Lawrence and Lelieveld, 2010). This results in transportation of aerosols
355
from Indian Ocean and Arabian Sea. Thus, from Table 4 it can be seen that both anthropogenic
356
aerosols (from IGP, Southeast Asia) and natural aerosols (marine and dust) are present over Bay
357
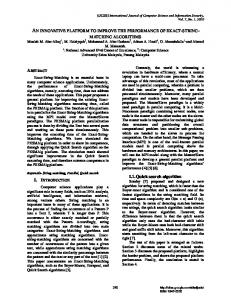
of Bengal during different seasons.
358
5.3. Role of Aerosol Layer Height in SSA retrieval
359
Satheesh et al. (2009) devised a new algorithm to improve the retrieval of SSA using
360
combined OMI and MODIS data. They used MODIS-predicted UV AOD as the input to improve
361
the original OMI algorithm, which was constrained by the assumption of aerosol layer height.
362
Over the Atlantic, the values retrieved from both algorithms showed reasonably good agreement.
363
However, over the Arabian Sea only when there was considerable loading of dust, the OMI AOD
364
and MODIS AOD had agreement suggesting that during other seasons, the assumption of aerosol
365
height could be wrong. Satheesh et al. (2009) also found that over Arabian Sea the aerosol layer
366
height (ALH) derived from OMI-MODIS algorithm agreed well with aircraft measurements
367
when compared to OMI SSA retrieval. In the current work, the aerosol layer height (ALH) was
16
Atmos. Chem. Phys. Discuss., https://doi.org/10.5194/acp-2018-564 Manuscript under review for journal Atmos. Chem. Phys. Discussion started: 16 July 2018 c Author(s) 2018. CC BY 4.0 License.
368
calculated for OMI, using the best estimate of SSA retrieved from OMI. The difference in
369
aerosol layer height between OMI-MODIS and OMI was plotted with the difference in SSA (Fig.
370
7a and 7b). The colorbar in the figure represents height estimated using the OMI-MODIS
371
algorithm.
372
Most important observation from this analysis is that OMI overestimates SSA at lower ALH
373
(retrieved by OMI-MODIS algorithm) and underestimates SSA at higher ALH. The latest version
374
of OMI algorithm uses CALIPSO climatology of aerosol layer height for better accuracy.
375
However, over regions where this is not available, pre-defined aerosol height has been used
376
based on the type of aerosol assumed. For industrial sulphate aerosols exponential profile with
377
2km scale height is assumed with a similar profile with 1.5km scale height for oceanic aerosols.
378
For biomass type aerosols, a Gaussian distribution with peak at 3km is used. Dust aerosols are
379
assumed to have two-single Gaussian distributions with maximum at heights 3 and 5km. It has
380
been shown by Gasso and Torres (2016) that when the actual aerosol height was 1.5km more
381
than climatological or assumed height, OMI retrieved higher SSA.
382
It can be seen from Figs. 7a and 7b, the blue coloured circles represent height between
383
surface to ~ 2km. In this range it is seen that the height assumed by OMI is > 1.5km compared to
384
the one estimated by OMI-MODIS. Thus, OMI overestimates SSA compared to the OMI-
385
MODIS retrieval. This overestimation is due to the predefined vertical profiles. Thus, there are
386
errors with regard to both the aerosol layer height as well as the type of aerosol in the OMI
387
algorithm. In the OMI algorithm, the highest uncertainty in retrieving SSA is due to aerosol layer
388
height and aerosol type (Torres et al., 2002). Using ground-based LIDAR measurements,
389
Satheesh et al. (2009) concluded that OMI-MODIS retrieved height agreed better with
390
observations than OMI.
17
Atmos. Chem. Phys. Discuss., https://doi.org/10.5194/acp-2018-564 Manuscript under review for journal Atmos. Chem. Phys. Discussion started: 16 July 2018 c Author(s) 2018. CC BY 4.0 License.
391
The importance of ALH and SSA in the calculation of TOA flux is studied using Santa
392
Barbara DISORT (SBDART) model (Ricchiazzi et al., 1998). For the same tropical environment
393
variables and surface albedo of 0.06, the SSA was varied from 0.8 to 1 and aerosol height from 0
394
to 10 km at 1 km interval. The simulations were done for a narrow band in UV (300-400nm). For
395
a constant AOD, AE (Angstrom Exponent) and asymmetry factor (0.4, 1 and 0.7 respectively),
396
TOA flux was calculated (Fig. 8). It can be seen that at any ALH, TOA flux varied with SSA in.
397
The role of ALH is important in the UV region due to the phenomena of Rayleigh scattering (van
398
de Hulst, 1981). The importance of Rayleigh scattering on the role of ALH is further shown in
399
Fig. 9. In this particular set of simulations, the Rayleigh scattering is completely removed and all
400
other parameters are kept same as in Fig. 8.
401
It can be seen that once molecular scattering is removed, the effect of ALH is also removed
402
and TOA flux depends only on SSA and other aerosol properties. This set of SBDART
403
simulations shows us how for a particular value of TOA flux, assuming different aerosol height
404
gives us different SSA values reiterating the important role of aerosol height on SSA retrievals.
405
5.4. Validation
406
To validate the new retrieval method of SSA using OMI and MODIS, both SSA values from
407
OMI and OMI-MODIS were compared with ground-based measurements (SSA at 450nm)
408
during Cruises in the period 2006 and 2009 in Arabian Sea and Bay of Bengal. These cruises
409
were part of the Integrated Campaign for Aerosols, gases and Radiation Budget (ICARB)
410
performed during the months of March to May 2006 and once during winter (W-ICARB) from
411
27 December 2008 to 30 January 2009 (Moorthy et al., 2008 and 2010). Since the spatial
412
coverage of OMI-MODIS and cruise measurements is less, the SSA values for both the
413
algorithms were averaged over the region of study and compared with observed SSA (Fig. 10).
18
Atmos. Chem. Phys. Discuss., https://doi.org/10.5194/acp-2018-564 Manuscript under review for journal Atmos. Chem. Phys. Discussion started: 16 July 2018 c Author(s) 2018. CC BY 4.0 License.
414
However, the cruise measurements showed that SSA varied a lot spatially especially over Bay of
415
Bengal. Hence instead of a spatial average, the SSA values were temporally averaged for the
416
months when the cruise was performed. This was done under the assumption that during the
417
cruise period, the SSA over each location did not vary with time. For better coverage, a 1.5 o box
418
was used around each location within which the mean SSA was calculated.
419
The mean SSA of OMI, OMI-MODIS and cruise measurements are calculated and the
420
difference between mean satellite SSA and mean SSA from cruise measurements are calculated
421
for OMI and OMI-MODIS algorithms separately. A statistical t-test is performed comparing the
422
respective SSA means of OMI and OMI-MODIS with SSA. The null hypothesis assumes the
423
mean SSA of OMI/OMI-MODIS is equal to the mean SSA calculated from the cruise
424
measurements. The values from Table 5 show that despite the mean difference of OMI SSA and
425
cruise SSA being ~ 0.013, it was statistically significant at 95% significance level. On the other
426
hand the SSA retrieved using OMI-MODIS algorithm was better constrained and was closer to
427
the mean value of SSA from cruise measurements. The distribution of SSA from both the
428
satellite algorithms as well as from cruise measurements is shown in Fig. 11.
429
Using five years (2008-2012) of OMI and OMI-MODIS data for the region of Arabian Sea
430
and Bay of Bengal, SSA was retrieved and the difference between the two methods was
431
calculated and plotted against SSA from the OMI-MODIS algorithm (Fig. 12). For absorbing
432
aerosols detected by OMI-MODIS the SSA is overestimated by OMI.
433
The OMI-MODIS approach in SSA retrieval is one of the many combinations of sensors that
434
can be used in retrieving aerosol properties. A more complete approach involving better vertical
435
distribution of aerosols either from space or ground-based observations is required to reduce the
436
uncertainty further. However, with few ground-based measurements in the UV regime, validation
19
Atmos. Chem. Phys. Discuss., https://doi.org/10.5194/acp-2018-564 Manuscript under review for journal Atmos. Chem. Phys. Discussion started: 16 July 2018 c Author(s) 2018. CC BY 4.0 License.
437
of new algorithms is still in the nascent stage.
438
6.
Summary and Conclusions
439
Aerosol forcing depends on aerosol properties like aerosol optical depth (AOD) and single
440
scattering albedo (SSA). SSA is highly sensitive to the aerosol composition and size and as well
441
as the wavelength at which the aerosol interacts with radiation. A slight change in SSA value can
442
alter the sign of the forcing. Hence it is important to have an accurate measurement of SSA
443
globally. Ozone Monitoring Instrument (OMI) retrieves SSA in the UV spectrum. However,
444
these retrievals are affected by cloud contamination and are sensitive to aerosol layer height. To
445
resolve the issue of sub-pixel cloud contamination, Satheesh et al (2009) developed a method
446
using the combination of OMI and the Moderate Resolution Imaging Spectroradiometer
447
(MODIS) at a local scale. In the present study, we use the method developed by Satheesh et al
448
(2009) to retrieve SSA at a much larger spatial and temporal scale. The main findings from our
449
study are listed below:
450
1. Both OMI and OMI-MODIS algorithms retrieved SSA over regions influenced by large
451
amounts of aerosols (e.g. Atlantic Ocean – ATL; Arabian Sea and Bay of Bengal –
452
ARBOB)
453
2. Difference in SSA retrievals of OMI-MODIS and OMI for both regions ATL and
454
ARBOB fluctuates between positive and negative values during different seasons which
455
could be due to the difference in either the type of aerosol or aerosol height assumed. In
456
addition, a longitudinal gradient of difference in SSA retrievals is present from the coast
457
of Sahara to the open ocean during the JJA season. This could be due the difference in
458
type of aerosols near the coast and in the open ocean
459
3. OMI overestimates SSA at lower ALH and underestimates at higher values of ALH. Over
20
Atmos. Chem. Phys. Discuss., https://doi.org/10.5194/acp-2018-564 Manuscript under review for journal Atmos. Chem. Phys. Discussion started: 16 July 2018 c Author(s) 2018. CC BY 4.0 License.
460
regions where CALIPSO climatology is not present, OMI uses pre-defined aerosol
461
heights based on the aerosol present. From Fig. 4 it is also seen that OMI is unable to
462
retrieve absorbing aerosols present at very low heights (< 2km) due to the already defined
463
vertical profiles.
464
4. In the UV spectrum, ALH plays a more dominant role than in the visible region due to
465
the major effect of Rayleigh scattering in UV. When Rayleigh scattering was removed,
466
ALH had no effect in both the UV and visible regions of the spectrum.
467
5. OMI-MODIS method was validated using cruise data from the ICARB and W-ICARB
468
campaigns in the Arabian Sea and Bay of Bengal. The difference between OMI SSA and
469
SSA from cruise measurements despite being small is statistically significant. OMI-
470
MODIS SSA is better constrained and is closer to the cruise measurements
471 472
6. It is seen that the OMI overestimates SSA when absorbing aerosols were detected by OMI-MODIS and the cruise measurements.
473
Aerosol type and aerosol layer height play a very important role in the retrieval of aerosol
474
properties. Without the assumption of aerosol type or height, OMI-MODIS is able to detect
475
absorbing aerosols much better than OMI. Hence this algorithm is useful over regions dominated
476
by absorbing aerosols like Bay of Bengal during winter. The importance of aerosol height is
477
clearly demonstrated by SBDART model and the validation with ground-based measurements
478
highlighted the role of aerosol type. However, an accurate comparison and validation of such
479
retrieval algorithms can be possible only when there are more ground-based observations
480
available in the UV spectrum on a larger spatial and temporal scale.
481
Acknowledgements
482
The authors gratefully acknowledge the NOAA Air Resources Laboratory (ARL) for the
21
Atmos. Chem. Phys. Discuss., https://doi.org/10.5194/acp-2018-564 Manuscript under review for journal Atmos. Chem. Phys. Discussion started: 16 July 2018 c Author(s) 2018. CC BY 4.0 License.
483
provision of the HYSPLIT transport and dispersion model used in this publication. The authors
484
are grateful to NASA data and services centre.
485
References
486
Bergstrom, R.W., Pilewskie, P., Russell, P.B., Redemann, J., Bond, T.C., Quinn, P.K., and Sierau,
487
B.: Spectral absorption properties of atmospheric aerosols, Atmos. Chem. Phys., 7, 5937-
488
5943, 2007.
489 490 491 492
Bond, T.C., and Sun, H.: Can reducing black carbon emissions counteract global warming?, Environ. Sci. Technol., 39(16), 5921-5926, 2005. Bond, T.C., and Bergstrom, R.W.: Light absorption by carbonaceous particles: An investigative review, Aerosol Sci. Tech., 40(1), 27-67, doi:10.1080/02786820500421521, 2006.
493
Bond, T.C., Doherty, S.J., Fahey, D.W., Forster, P.M., Bernsten, T., De Angelo, B.J., Flanner,
494
M.G., Ghan, S., Karcher, B., Koch, D., Kinne, S., Kondo, Y., Quinn, P.K., Sarofim, M.C.,
495
Schultz, M., Venkataraman, C., Zhang, H., Zhang, S., Bellouin, N., Guttikunda, S.K.,
496
Hopke, P.K., Jacobson, M.Z., Kaiser, J.W., Klimont, Z., Lohmann, U., Schwarz, J.P.,
497
Shindell, D., Storelvmo, T., Warren, S.G., and Zender, C.S.: Bounding the role of black
498
carbon in the climate system: A scientific assessment, J. Geophys. Res., 118(11), 5380-
499
5552, doi:10.1002/jgrd.50171, 2013.
500
Chand, D., Wood, R., Anderson, T.L., Satheesh, S.K., and Charlson, R.J.: Satellite-derived direct
501
radiative effect of aerosols dependent on cloud cover, Nat. Geosci., 2, 181–184,
502
doi:10.1038/ngeo437, 2009.
503 504 505
Chung, S.H., and Seinfeld, J.H.: Global distribution and climate forcing of carbonaceous aerosols, J. Geophys. Res., 107(D19), 4407, doi:10.1029/2001JD001397, 2002. Cooke, W.F., and Wilson, J.J.N.: A global black carbon aerosol model, J. Geophys. Res., 101,
22
Atmos. Chem. Phys. Discuss., https://doi.org/10.5194/acp-2018-564 Manuscript under review for journal Atmos. Chem. Phys. Discussion started: 16 July 2018 c Author(s) 2018. CC BY 4.0 License.
506 507
19395-19410, doi:10.1029/96JD00671, 1996. Dey, S., and Di Girolamo, L.: A climatology of aerosol optical and microphysical properties over
508
the
Indian
subcontinent
from
509
Spectroradiometer
510
doi:10.1029/2009JD013395, 2010.
(MISR)
9
years
data,
(2000–2008)
J.
Geophys.
of
Multiangle
Res.,
115,
Imaging D15204,
511
Di Girolamo, L., Bond, T.C., Bramer, D., Diner, D.J., Fettinger, F., Kahn, R.A., Mrtonchik, J.V.,
512
Ramana, M.V., Ramanathan, V., and Rasch, P.J.: Analysis of Multi-angle Imaging
513
SpectroRadiometer (MISR) aerosol optical depths over greater India during winter 2001-
514
2004, Geophys. Res. Lett., 31(23), L23115, doi:10.1029/2004GL021273, 2004.
515
Diner, D.J., Beckert, J.C., Reilly, T.H., Bruegge, C.J., Conel, J.E., Kahn, R.A., Martonchik, J.V.,
516
Ackerman, T.P., Davies, R., Gerstl, S.A.W., Gordon, H.R., Muller, J.-P., Myneni, R.B.,
517
Sellers, P.J., Pinty, B., and Verstraete, M.M.: Multi-angle Imaging SpectroRadiometer
518
(MISR) instrument description and experiment overview, IEEE T GEOSCI REMOTE,
519
36(4), 1072-1087, doi:10.1109/36.700992, 1998.
520
Dubovik, O., and King, M.D.: A flexible inversion algorithm for retrieval of aerosol optical
521
properties from Sun and sky radiance measurements, J. Geophys. Res., 105(D16), 20673-
522
20696, doi:10.1029/2000JD900282, 2000.
523
Dubovik, O., Holben, B.N., Eck, F.T., Smirnov, A., Kaufman, Y.J., King, M.D., Tanre, D., and
524
Slutsker, I.: Variability of absorption and optical properties of key aerosol types observed
525
in
526
0469(2002)0592.0.CO;2, 2002.
worldwide
locations,
J.
Atmos.
Sci.,
59(3),
590-608,
doi:10.1175/1520-
527
Eck, T.F., Holben, B.N., Slutsker, I., and Setzer, A.: Measurements of irradiance attenuation and
528
estimation of aerosol single scattering albedo for biomass burning aerosols in Amazonia, J.
23
Atmos. Chem. Phys. Discuss., https://doi.org/10.5194/acp-2018-564 Manuscript under review for journal Atmos. Chem. Phys. Discussion started: 16 July 2018 c Author(s) 2018. CC BY 4.0 License.
529
Geophys. Res., 103(D24), 31865-31878, doi:10.1029/98JD00399, 1998.
530
Gasso, S., and Torres, O.: The role of cloud contamination, aerosol layer height and aerosol
531
model in the assessment of the OMI near-UV retrievals over the ocean, Atmos. Meas.
532
Tech., 9, 3031-3052, doi:10.5194/amt-9-3031-2016, 2016.
533 534
Hansen, J., Sato, M., and Ruedy, R.: Radiative forcing and climate response, J. Geophys. Res.Atmos., 102(D6), 6831-6864, doi:10.1029/96JD03436, 1997.
535
Harriss, R.C., Browell, E.V., Sebacher, D.I., Gregory, G.L., Hinton, R.R., Beck, S.M., McDougal,
536
D.S., and Shipley, S.T.: Atmospheric transport of pollutants from North America to the
537
North Atlantic Ocean, Nature, 308, 722-724, doi:10.1038/308722a0, 1984.
538
Haywood, J.M., Roberts, D.L., Slingo, A., Edwards, J.M., and Shine, K.P.: General circulation
539
model calculations of the direct radiative forcing by anthropogenic sulphate and fossil-fuel
540
soot
541
0442(1997)0102.0.CO;2, 1997.
aerosol,
J.
Clim.,
10,
1562-1577,
doi:10.1175/1520-
542
Heintzenberg, J., Charlson, R.J., Clarke, A. D., Liousse, C., Ramaswamy, V., Shine, K.P.,
543
Wendish, M., and Helas, G.: Measurements and modelling of aerosol single-scattering
544
albedo: Progress, problems and prospects, Contrib. Atmos. Phys., 70(4), 249– 263, 1997.
545
Herman, B.M., Browning, R.S., and De Luisi, J.J.: Determination of the effective imaginary term
546
of the complex refractive index of atmospheric dust by remote sensing: the diffuse-direct
547
radiation
548
0469(1975)0322.0.CO;2, 1975.
method,
J.
Atmos.
Sci.,
32,
918-925,
doi:10.1175/1520-
549
Herman, J.R., Bhartia, P.K., Torres, O., Hsu, C., Seftor, C., and Celarier, E.: Global distribution
550
of UV-absorbing aerosols from Nimbus 7/TOMS data, J. Geophys. Res.-Atmos., 102(D14),
551
16911-16922, doi:10.1029/96JD03680, 1997.
24
Atmos. Chem. Phys. Discuss., https://doi.org/10.5194/acp-2018-564 Manuscript under review for journal Atmos. Chem. Phys. Discussion started: 16 July 2018 c Author(s) 2018. CC BY 4.0 License.
552 553
Horvath, H.: Atmospheric light absorption- a review, Atmos. Environ. A-Gen., 27(3), 293-317, doi:10.1016/0960-1686(93)90104-7, 1993.
554
Intergovernmental Panel on Climate Change (IPCC) (2013), The physical science basis:
555
Contribution of Working Group I to the Fifth Assessment Report of the Intergovernmental
556
Panel on Climate Change, In: Climate Change (2013), Stocker, T.F., D. Qin, G.K. Plattner,
557
M. Tignor, S.K. Allen, J. Boschung, A. Nauels, Y. Xia, V. Bex, and P.M. Midgley (eds),
558
Cambridge University, Press: Cambridge, United Kingdom and New York, NY, USA 1535
559
pp, doi:10.1017/CBO9781107415324.
560
Jethva, H., Torres O., and Ahn C.: Global assessment of OMI aerosol single-scattering albedo
561
using ground-based AERONET inversion, J. Geophys. Res.-Atmos., 119(14), 9020-9040,
562
doi:10.1002/2014JD021672, 2014.
563
Johnson, B.T., Shine, K.P., and Forster, P.M.: The semi-direct aerosol effect: Impact of absorbing
564
aerosols on marine stratocumulus, Q. J. Roy. Meteor. Soc., 130, 1407-1422,
565
doi:10.1256/qj.03.61, 2003.
566 567 568 569
Kaufman, Y.J.: Satellite sensing of aerosol absorption, J. Geophys. Res., 92, 4307-4317, doi:10.1029/JD092iD04p04307, 1987. Kaufman, Y.J., Tanre, D., and Boucher, O.: A satellite view of aerosols in the climate system, Nature, 419, 215-223, doi:10.1038/nature01091, 2002a.
570
Kaufman, Y.J., Martins, J.V., Remer, L.A., Schoeberl, M.R., and Yamasoe, M.A.: Satellite
571
retrieval of aerosol absorption over the oceans using sunglint, Geophys. Res. Lett., 29(19),
572
34-1 – 34-4, doi:10.1029/2002GL015403, 2002b.
573
Kaufman, Y.J., Koren, I., Remer, L.A., Tanre, D., Ginoux, P., and Fan, S.: Dust transport and
574
deposition observed from the Terra-Moderate Resolution Imaging Spectroradiometer
25
Atmos. Chem. Phys. Discuss., https://doi.org/10.5194/acp-2018-564 Manuscript under review for journal Atmos. Chem. Phys. Discussion started: 16 July 2018 c Author(s) 2018. CC BY 4.0 License.
575
(MODIS) spacecraft over the Atlantic Ocean, J. Geophys. Res., 110, D10S12,
576
doi:10.1029/2003JD004436, 2005.
577
Kim, S-W., Yoon, S-C., Jefferson, A., Won, J-G., Dutton, E.G., Ogren, J.A., and Anderson T.L.:
578
Observation of enhanced water vapour in Asian dust layer and its effect on atmospheric
579
radiative heating rates, Geophys. Res. Lett., 31(18), doi:10.1029/2004GL020024, 2004.
580
King, M.D.: Determination of the ground albedo and the index of absorption of atmospheric
581
particulates by remote sensing. Part II: Application, J. Atmos. Sci., 36, 1072-1083,
582
doi:10.1175/1520-0469(1979)0362.0.CO;2, 1979.
583
Krishnamurti, T.N., Jha, B., Prospero J., Jayaraman, A., and Ramanathan, V.: Aerosol and
584
pollutant transport and their impact on radiative forcing over the tropical Indian Ocean
585
during the January – February 1996 pre-INDOEX cruise, Tellus B, 50(5): 521–542,
586
doi:10.1034/j.1600-0889.1998.00009.x, 1998.
587
Kumar, K.R., Sivakumar, Reddy, R.R., and Gopal, K.R.: Ship-borne measurements of columnar
588
and surface aerosol loading over the Bay of Bengal during W-ICARB campaign: role of
589
airmass transport. Latitudinal and Longitudinal Gradients, Aerosol Air Qual Res., 13, 818–
590
837, doi:10.4209/aaqr.2012.08.0225, 2013.
591
Lawrence, M.G., and Lelieveld, J.: Atmospheric pollutant outflow from southern Asia: a review,
592
Atmospheric Chemistry and Physics, 10, 11017-11096, doi:10.5194/acp-10-11017-2010,
593
2010.
594
Levy, R.C., Remer, L.A., Tanre, D., Kaufman, Y.J., Ichoku, C., Holben, B.N., Livingston, J.M.,
595
Russell, P.B., and Maring, H.: Evaluation of the Moderate-Resolution Imaging
596
Spectroradiometer (MODIS) retrievals of dust aerosol over the ocean during PRIDE, J.
597
Geophys. Res., 108(D19), 8594, doi:10.1029/2002JD002460, 2003.
26
Atmos. Chem. Phys. Discuss., https://doi.org/10.5194/acp-2018-564 Manuscript under review for journal Atmos. Chem. Phys. Discussion started: 16 July 2018 c Author(s) 2018. CC BY 4.0 License.
598
Liao, H., and Seinfeld, J.H.: Radiative forcing by mineral dust aerosols: Sensitivity to key
599
variables, J. Geophys. Res.-Atmos., 103(D24), 31637-31645, doi:10.1029/1998JD200036,
600
1998.
601
Meloni, D., di Sarra, A., di Lorio, T., and Fiocco, G.: Influence of the vertical profile of Saharan
602
dust on the visible direct radiative forcing, J. Quant. Spectrosc. Ra., 93(4), 397-413,
603
doi:10.1016/j.jqsrt.2004.08.035, 2005.
604
Menon, S., Hansen, J., Nazarenko, L., and Luo, Y.: Climate effects of black carbon aerosols in
605
China and India, Science, 297(5590), 2250-2253, doi:10.1126/science.1075159, 2002.
606
Mishra, A.K., Koren, I., and Rudich, Y.: Effect of aerosol vertical distribution on aerosol-
607
radiation
interaction:
A
theoretical
608
doi:10.1016/j.heliyon.2015.e00036, 2015.
prospect,
Heliyon,
e00036,
609
Moorthy, K.K., Babu, S.S., and Satheesh, S.K.: Aerosol spectral optical depths over the Bay of
610
Bengal: role of transport, Geophys. Res. Lett., 30(5): 1249, doi:10.1029/2002GL016520,
611
2003.
612
Moorthy, K.K., Babu, S.S., Sunilkumar, S.V., Gupta, P.K., and Gera, B.S.: Altitude profiles of
613
aerosol BC, derived from aircraft measurements over an inland urban location in India,
614
Geophys. Res. Lett., 31(22), 10.1029/2004GL021336, 2004.
615
Moorthy, K.K., Satheesh, S.K., Babu, S.S., and Dutt, C.B.S.: Integrated campaign for aerosols,
616
gases and radiation budget (ICARB): an overview, J. Earth. Syst. Sci., 117(1), 243-262,
617
doi:10.1007/s12040-008-0029-7, 2008.
618
Moorthy, K.K., Beegum, S.N., Babu, S.S., Smirnov, A., John, S.R., Kumar, K.R., Narasimhulu,
619
K., Dutt, C.B.S., and Nair, V.S.: Optical and physical characteristics of Bay of Bengal
620
aerosols during W-ICARB: spatial and vertical heterogeneities in the marine atmospheric
27
Atmos. Chem. Phys. Discuss., https://doi.org/10.5194/acp-2018-564 Manuscript under review for journal Atmos. Chem. Phys. Discussion started: 16 July 2018 c Author(s) 2018. CC BY 4.0 License.
621
boundary layer and in the vertical column, J. Geophys. Res., 115(D24): D24213,
622
doi:10.1029/2010JD014094, 2010.
623
Moosmuller, H., Chakrabarty, R.K., and Arnott, W.P.: Aerosol light absorption and its
624
measurement:
A
review,
J.
625
doi:10.1016/j.jqsrt.2009.02.035, 2009.
Quant.
Spectrosc.
Ra.,
110(11),
844-878,
626
Morris, V., Colon, P.C., Nalli, N.R., Joseph, E., Armstrong, R.A., Detres, Y., Goldberg, M.D.,
627
Minnett, P.J., and Lumpkin, R.: Measuring Trans-Atlantic aerosol transport from Africa,
628
EOS Trans. AGU, 87(50), 565-571, doi:10.1029/2006EO500001, 2006.
629 630 631 632
Myhre, G., Stordal, F., Restad, K., and Isaksen, I.S.A.: Estimation of the direct radiative forcing due to sulphate and soot aerosols, Tellus, 50B, 463-477, 1998. Narasimhan, D., and Satheesh, S.K.: Estimates of aerosol absorption over India using multisatellite retrieval, Ann. Geophys., 31, 1773-1778, doi:10.5194/angeo-31-1773-2013, 2013.
633
Pease, P.P., Tchakerian, V.P., and Tindale, N.W.: Aerosols over the Arabian Sea: geochemistry
634
and source areas for Aeolian desert dust, J. Arid Environ., 39(3), 477-496,
635
doi:10.1006/jare.1997.0368, 1998.
636
Podgorny, I.A., and Ramanathan, V.: A modeling study of the direct effect of aerosols over the
637
tropical
Indian
Ocean,
J.
638
doi:10.1029/2001JD900214, 2001.
Geophys.
Res.,
106(D20):
24097–24105,
639
Prospero, J.M., and Carlson, T.N.: Vertical and areal distribution of Saharan dust over the
640
western equatorial north Atlantic Ocean, J. Geophys. Res., 77(27), 5255-5265,
641
doi:10.1029/JC077i027p05255, 1972.
642
Prospero, J.M.: Saharan dust transport over the North Atlantic Ocean and Mediterranean: An
643
overview, In: The Impact of Desert Dust Across the Mediterranean, Guerzoni S., Chester
28
Atmos. Chem. Phys. Discuss., https://doi.org/10.5194/acp-2018-564 Manuscript under review for journal Atmos. Chem. Phys. Discussion started: 16 July 2018 c Author(s) 2018. CC BY 4.0 License.
644
R. (Eds.), 133-151, doi:10.1007/978-94-017-3354-0_13, 1996.
645
Rajeev, K., Ramanathan, V., and Meywerk, J.: Regional aerosol distribution and its long-range
646
transport over the Indian Ocean, J. Geophys. Res.-Atmos., 105(D2), 2029-2043,
647
doi:10.1029/1999JD900414, 2000.
648 649
Ramanathan, V., Crutzen, P.J., Kiehl, J.T., and Rosenfield, D.: Aerosols, climate and the hydrological cycle, Science, 294(5549): 2119–2124, doi:10.1126/science.1064034, 2001.
650
Remer, L. A., Kaufman, Y. J., Tanre, D., Mattoo, S., Chu, D. A., Martins, J. V., Li, R. R., Ichoku,
651
C., Levy, R. C., Kleidman, R. G., Eck, T. F., Vermote, E., and Holben, B. N.: The MODIS
652
aerosol
653
doi:10.1175/JAS3385.1, 2005.
algorithm,
products,
and
validation,
J.
Atmos.
Sci.,
62,
947–973,
654
Ricchiazzi, P., Yang, S., Gautier, C., and Sowle, D.: SBDART: a research and teaching software
655
tool for plane-parallel radiative transfer in the earth’s atmosphere, B. Am. Meteorol. Soc.
656
79(10): 2101–2114, doi:10.1175/1520-0477(1998)0792.0.CO;2, 1998.
657
Satheesh, S.K.: Aerosols and climate, Resonance, 7(4), 48-59, doi:10.1007/BF02836138, 2002.
658
Satheesh, S.K., and Moorthy, K.K.: Radiative effects of natural aerosols: a review, Atmos.
659
Environ., 39(11): 2089–2110, doi:10.1016/j.atmosenv.2004.12.029, 2005.
660
Satheesh, S.K., Srinivasan, J., and Moorthy, K.K.: Spatial and temporal heterogeneity in aerosol
661
properties and radiative forcing over Bay of Bengal: Sources and role of aerosol transport,
662
J. Geophys. Res., 111(D8): D08202, doi:10.1029/2005JD006374, 2006.
663
Satheesh, S.K., Moorthy, K.K., Babu, S.S., Vinoj, V., and Dutt, C.B.S.: Climate implications of
664
large warming by elevated aerosol over India, Geophys. Res. Lett., 35(19),
665
doi:10.1029/2008GL034944, 2008.
666
Satheesh, S.K., Torres, O., Remer, L.A., Babu, S.S., Vinoj, V., Eck, T.F., Kleidman, R.G., and
29
Atmos. Chem. Phys. Discuss., https://doi.org/10.5194/acp-2018-564 Manuscript under review for journal Atmos. Chem. Phys. Discussion started: 16 July 2018 c Author(s) 2018. CC BY 4.0 License.
667
Holben, B.N.: Improved assessment of aerosol absorption using OMI-MODIS joint
668
retrieval, J. Geophys. Res., 114, D05209, doi:10.1029/2008JD011024, 2009.
669
Satheesh, S.K., Vinoj, V., and Moorthy, K.K.: Assessment of aerosol radiative impact over
670
oceanic regions adjacent to Indian subcontinent using multi-satellite analysis, Adv.
671
Meteorol., 2010, Article ID 139186, pp 13., doi:10.1155/2010/139186, 2010.
672 673 674
Seinfeld, J.H., and Pandis, S.N.: Atmospheric Chemistry and Physics: From air pollution to climate change, 2nd Ed., 1232 pp, John Wiley & Sons, Inc., Hobkoben, New Jersey, 2006. Sirocko, F., and Sarnthein, M.: Wind-borne deposits in the northwestern Indian Ocean: Record of
675
Holocene
sediments
versus
modern
satellite
data,
In:
Paleoclimatology
and
676
Paleometeorology: modern and past patterns of global atmospheric transport, Leinen M.,
677
Sarnthein M. (Eds), 401-433, Amsterdam: Kluwer Academic Publishers, 1989.
678
Stephens, G.L., Vane, D.G., Boain, R.J., Mace, G.G., Sassen, K., Wang, Z., Illingworth, A.J.,
679
O’Connor, E.J., Rossow, W.B., Durden, S.L., Miller, S.D., Austin, R.T., Benedetti, A.,
680
Mitrescu, C., and CloudSat Science Team: The CloudSat mission and the A-Train: A new
681
dimension of space-based observations of clouds, precipitation, B. Am. Meteorol. Soc., 83,
682
1771-1790, doi:10.1175/BAMS-83-12-1771, 2002.
683
Tanre, D., Kaufman, Y.J., Herman, M., and Mattoo, S.: Remote sensing of aerosol properties
684
over oceans using the MODIS/EOS spectral radiances, J. Geophys. Res., 102(D14),
685
16971–16988, 1997.
686
Tindale, N.W., and Pease, P.P.: Aerosols over the Arabian Sea: Atmospheric transport pathways
687
and concentrations of dust and sea salt, Deep-Sea Res. Pt. II, 46(8-9), 1577-1595,
688
doi:10.1016/S0967-0645(99)00036-3, 1999.
689
Torres, O., Bhartia, P. K., Herman, J. R., and Ahmad, Z.: Derivation of aerosol properties from
30
Atmos. Chem. Phys. Discuss., https://doi.org/10.5194/acp-2018-564 Manuscript under review for journal Atmos. Chem. Phys. Discussion started: 16 July 2018 c Author(s) 2018. CC BY 4.0 License.
690
satellite measurements of backscattered ultraviolet radiation. Theoretical Basis, J.
691
Geophys. Res., 103(D14), 17099–17110, 1998.
692
Torres, O., Decae, R., Veefkind, J.P., and de Leeuw, G.: OMI aerosol retrieval algorithm, in OMI
693
Algorithm Theoretical Basis Document: Clouds, Aerosols, and Surface UV Irradiance, 3,
694
V2, OMIATBD- 03, edited by P. Stammes, pp. 47 – 71, NASA Goddard Space Flight
695
Cent., Greenbelt, Md, 2002.
696
(http://eospso.gsfc.nasa.gov/eos_homepage/for_scientists/atbd/docs/OMI/ATBD-OMI-
697
03.pdf)
698
Torres, O., Bhartia, P.K., Sinyuk, A., Welton, E.J., and Holben, B.: Total Ozone Mapping
699
Spectrometer measurements of aerosol absorption from space: Comparison to SAFARI
700
2000 ground-based observations, J. Geophys. Res., 110(D10), doi:10.1029/2004JD004611,
701
2005.
702
Torres, O., Tanskanen, A., Veihelmann, B., Ahn, C., Braak, R., Bhartia, P.K., Veefkind, P., and
703
Levelt, P.: Aerosols and surface UV products from Ozone Monitoring Instrument
704
observations: An overview, J. Geophys. Res., 112, D24S47, doi:10.1029/2007JD008809,
705
2007.
706
Torres, O., Ahn, C., and Chen, Z.: Improvements to the OMI near-UV aerosol algorithm using A-
707
train
708
doi:10.5194/amt-6-3257-2013, 2013.
709 710
CALIOP and AIRS
observations, Atmos.
Meas.
Tech.,
6,
3257-3270,
Van de Hulst, H.C.: Light scattering by small particles, 496 pp., Dover publications, New York, 1981.
711
Wells, K.C., Martins, J.V., Remer, L.A., Kreidenweis, S.M., and Stephens, G.L.: Critical
712
reflectance derived from MODIS: Application for the retrieval of aerosol absorption over
31
Atmos. Chem. Phys. Discuss., https://doi.org/10.5194/acp-2018-564 Manuscript under review for journal Atmos. Chem. Phys. Discussion started: 16 July 2018 c Author(s) 2018. CC BY 4.0 License.
713 714
desert regions, J. Geophys. Res., 117(D3), doi:10.1029/2011JD016891, 2012. Zhu, L., Martins, J.V., and Remer, L.A.: Biomass burning aerosol absorption measurements with
715
MODIS
using
the
critical
reflectance
716
doi:10.1029/2010JD015187, 2011.
method,
J.
Geophys.
Res.,
116(D7),
717
Zuluaga, M.D., Webster, P.J., and Hoyos, C.D.: Variability of aerosols in the tropical Atlantic
718
Ocean relative to African Easterly Waves and their relationship with atmospheric and
719
oceanic environments, J. Geophys. Res., 117(D16), doi:10.1029/2011JD017181, 2012.
720 721 722 723 724 725 726 727 728 729 730 731 732
32
Atmos. Chem. Phys. Discuss., https://doi.org/10.5194/acp-2018-564 Manuscript under review for journal Atmos. Chem. Phys. Discussion started: 16 July 2018 c Author(s) 2018. CC BY 4.0 License.
733 734
Figure 1a. Spatial distribution of SSA retrieved by OMI
735 736
Figure 1b. Spatial distribution of SSA retrieved by OMI-MODIS
33
Atmos. Chem. Phys. Discuss., https://doi.org/10.5194/acp-2018-564 Manuscript under review for journal Atmos. Chem. Phys. Discussion started: 16 July 2018 c Author(s) 2018. CC BY 4.0 License.
737 738
Figure 2. Spatial distribution of difference in SSA retrievals
739 740 741 742 743 744
34
Atmos. Chem. Phys. Discuss., https://doi.org/10.5194/acp-2018-564 Manuscript under review for journal Atmos. Chem. Phys. Discussion started: 16 July 2018 c Author(s) 2018. CC BY 4.0 License.
745
746 747
Figure 3. Distribution of difference in SSA for all seasons averaged over 2008-2012 over a)
748
Atlantic and b) Arabian Sea and Bay of Bengal 35
Atmos. Chem. Phys. Discuss., https://doi.org/10.5194/acp-2018-564 Manuscript under review for journal Atmos. Chem. Phys. Discussion started: 16 July 2018 c Author(s) 2018. CC BY 4.0 License.
749 750
Figure 4. Regions representing the various aerosol sources over Atlantic Ocean. 1) North
751
America, 2) Central/South America, 3) North Africa and 4) Southern Africa.
752 753
Figure 5. Regions representing the various aerosol sources over Arabian Sea. 1) Arabian
754
Peninsula and North Africa, 2) Southern Africa, 3) Indian sub-continent and 4) Indian Ocean and
755
Southeast Asia.
36
Atmos. Chem. Phys. Discuss., https://doi.org/10.5194/acp-2018-564 Manuscript under review for journal Atmos. Chem. Phys. Discussion started: 16 July 2018 c Author(s) 2018. CC BY 4.0 License.
756 757
Figure 6. Regions representing the various aerosol sources over Bay of Bengal. 1) India/Arabian
758
Peninsula, 2) Indian Ocean, 3) North/Northeast India and East Asia and 4) Southeast Asia.
759
37
Atmos. Chem. Phys. Discuss., https://doi.org/10.5194/acp-2018-564 Manuscript under review for journal Atmos. Chem. Phys. Discussion started: 16 July 2018 c Author(s) 2018. CC BY 4.0 License.
760 761
Figure 7. Difference in aerosol layer height (ALH) between OMI-MODIS and OMI vs.
762
difference in SSA over a) Atlantic and b) Arabian Sea and Bay of Bengal. The colorbar
763
represents ALH estimated by OMI-MODIS algorithm. At lower height (dark blue circles) OMI
764
assumes ALH greater than that of OMI-MODIS and results in overestimation of SSA.
765 38
Atmos. Chem. Phys. Discuss., https://doi.org/10.5194/acp-2018-564 Manuscript under review for journal Atmos. Chem. Phys. Discussion started: 16 July 2018 c Author(s) 2018. CC BY 4.0 License.
766
Figure 8. TOA flux calculated from SBDART for different SSA and ALH for UV (300-400nm)
767 768
Figure 9. TOA flux calculated from SBDART for different SSA and ALH with Rayleigh
769
scattering removed for UV (300-400nm)
770 39
Atmos. Chem. Phys. Discuss., https://doi.org/10.5194/acp-2018-564 Manuscript under review for journal Atmos. Chem. Phys. Discussion started: 16 July 2018 c Author(s) 2018. CC BY 4.0 License.
771
Figure 10. Comparison of SSAOMI, SSAOMI-MODIS with cruise measurements spatially averaged
772 773
Figure 11. Distribution of SSA from OMI-MODIS, OMI and cruise measurements.
774 775
Figure 12. Difference in SSA from OMI-MODIS and OMI Vs SSA from OMI-MODIS. OMI 40
Atmos. Chem. Phys. Discuss., https://doi.org/10.5194/acp-2018-564 Manuscript under review for journal Atmos. Chem. Phys. Discussion started: 16 July 2018 c Author(s) 2018. CC BY 4.0 License.
776
overestimates SSA when absorbing aerosols are detected by OMI-MODIS.
777 778 779 780 781 References
Method
Technique
Limitation
Herman et al.,
Ground-based
Inverse methods
Measurements are
1975; King,
observations
measurements of solar
spatially and
1979; Eck et al.,
radiances and/or aerosol
temporally
1998; Dubovik
properties along with
constrained
and King, 2000;
radiative transfer
Torres et al.,
calculations
2005 Dubovik et al.,
Global network –
Inverse technique using
Only land-based, low
2002
Aerosols Robotic
near-real time measured
coverage over remote
Network (AERONET)
direct and diffuse
oceanic regions
radiation
41
Atmos. Chem. Phys. Discuss., https://doi.org/10.5194/acp-2018-564 Manuscript under review for journal Atmos. Chem. Phys. Discussion started: 16 July 2018 c Author(s) 2018. CC BY 4.0 License.
Kaufman, 1987;
Critical surface
Over varying surface
Limited spatial
Zhu et al., 2011;
reflectance - where the
reflectance, the
variability of surface
Wells et al., 2012
net role of aerosol
radiance difference
reflectance. Works
absorption and
between clear and hazy
only for few cases
scattering becomes
skies is measured using
where there are large
independent of aerosol
satellite images
amount absorbing
optical thickness and is
aerosols present
affected only by SSA Kaufman et al.,
Retrieve SSA in visible
Sun-glint is used as a
Only limited scenarios
2002b
wavelengths
bright background to
present and does not
differentiate role of
work on land when
scattering from aerosol
absorbing aerosols are
absorption
present (Torres et al., 2005).
Diner et al.,
Multi Angle Imaging
Retrieves AOD and
Surface reflectance
1998; Remer et
Spectroradiometer
SSA in the visible and
influences the
al., 2005
(MISR) and Moderate
infrared region of solar
retrievals
Resolution Imaging
spectrum
Spectroradiometer (MODIS)
42
Atmos. Chem. Phys. Discuss., https://doi.org/10.5194/acp-2018-564 Manuscript under review for journal Atmos. Chem. Phys. Discussion started: 16 July 2018 c Author(s) 2018. CC BY 4.0 License.
Herman et al.,
Total Ozone Mapping
Aerosol index
Large pixel size prone
1997; Torres et
Spectrometer (TOMS)
parameter is highly
to cloud
sensitive to the
contamination
al., 1998
Rayleigh scattering thus acting as a bright background in the UV regime Torres et al.,
Ozone Monitoring
Similar technique as
Sensitive to aerosol
2002
Instrument (OMI)
TOMS. Pre-defined
layer height and still
aerosol models used.
prone to cloud contamination
782 783
Table 1. Ground-based and Satellite-based indirect methods to retrieve SSA
784 1 Seasons
DJF
MAM
2
3
4
Regions 2009
2010 2009
2010
2009
2010
2009
2010
500m
38%
40%
0%
0%
57%
45%
5%
15%
1500m
43%
45% 0%
0%
24%
20%
33%
35%
2500m
52%
50% 10%
10%
5%
15%
33%
25%
500m
9%
19%
0%
0%
86%
62%
5%
19%
1500m
33%
38% 0%
4%
53%
29%
14%
29%
2500m
38%
24% 19%
0%
29%
33%
14%
43%
43
Atmos. Chem. Phys. Discuss., https://doi.org/10.5194/acp-2018-564 Manuscript under review for journal Atmos. Chem. Phys. Discussion started: 16 July 2018 c Author(s) 2018. CC BY 4.0 License.
JJA
SON
500m
5%
5%
0%
0%
90%
90%
5%
5%
1500m
9%
5%
0%
0%
67%
76%
24%
19%
2500m
0%
5%
0%
0%
76%
76%
24%
19%
500m
5%
5%
0%
0%
86%
71%
9%
24%
1500m
0%
10%
0%
0%
81%
71%
19%
19%
2500m
10%
14%
0%
0%
71%
57%
19%
29%
785 786
Table 2. Influence of various aerosol sources over Atlantic Ocean given as percentage of
787
trajectories originating from each source respectively. The maximum influence is given in black
788
bold. The different source regions are explained in text and Fig. 4.
789
Seasons
DJF
MAM
JJA
Regions
1
2
3
4
500m
57%
0%
38%
5%
1500m
62%
10%
19%
9%
2500m
81%
14%
0%
5%
500m
19%
43%
19%
19%
1500m
29%
29%
23%
19%
2500m
57%
14%
24%
5%
500m
0%
24%
0%
76%
1500m
19%
67%
0%
14%
2500m
62%
33%
5%
0%
44
Atmos. Chem. Phys. Discuss., https://doi.org/10.5194/acp-2018-564 Manuscript under review for journal Atmos. Chem. Phys. Discussion started: 16 July 2018 c Author(s) 2018. CC BY 4.0 License.
SON
500m
5%
24%
47%
24%
1500m
14%
19%
48%
19%
2500m
38%
10%
19%
33%
790 791
Table 3. Influence of various aerosol sources over Arabian Sea given as percentage of
792
trajectories originating from each source respectively. The maximum influence is given in black
793
bold. The different source regions are explained in text and Fig. 5.
794
Seasons
DJF
MAM
JJA
SON
Regions
1
2
3
4
500m
72%
0%
14%
14%
1500m
48%
14%
10%
28%
2500m
29%
33%
0%
38%
500m
19%
48%
0%
33%
1500m
57%
29%
20%
14%
2500m
71%
24%
0%
5%
500m
0%
100%
0%
0%
1500m
5%
95%
0%
0%
2500m
14%
81%
0%
5%
500m
5%
52%
33%
10%
1500m
5%
43%
43%
9%
2500m
5%
33%
29%
33%
45
Atmos. Chem. Phys. Discuss., https://doi.org/10.5194/acp-2018-564 Manuscript under review for journal Atmos. Chem. Phys. Discussion started: 16 July 2018 c Author(s) 2018. CC BY 4.0 License.
795 796
Table 4. Influence of various aerosol sources over Bay of Bengal given as percentage of
797
trajectories originating from each source respectively. The maximum influence is given in black
798
bold. The different source regions are explained in text and Fig. 6.
799 OMI
OMI-MODIS
Mean SSA (Cruise – 0.923)
0.936
0.923
Std. Dev. (Cruise – 0.04)
0.021
0.021
p- value
0.046
0.981
Confidence Interval
[0.0002, 0.027]
[-0.013,0.013]
800 801
Table 5. Comparison of SSA between both the satellite algorithms and cruise measurements
802
46