The Prague Bulletin of Mathematical Linguistics
NUMBER 106
OCTOBER 2016
31–44
Predicting the Performance of Parsing with Referential Translation Machines Ergun Biçici ADAPT Research Center, School of Computing, Dublin City University, Ireland
Abstract Referential translation machine (RTM) is a prediction engine used for predicting the performance of natural language processing tasks including parsing, machine translation, and semantic similarity pioneering language, task, and domain independence. RTM results for predicting the performance of parsing (PPP) in out-of-domain or in-domain settings with different training sets and types of features present results independent of language or parser. RTM PPP models can be used without parsing using only text input and without any parser or language dependent information. Our results detail prediction performance, top selected features, and lower bound on the prediction error of PPP.
1. Predicting Parsing Performance with Referential Translation Machines Training parsers and parsing can be computationally costly and labeled data scarce or expensive to obtain. Predicting the performance of parsing (PPP) can be useful for parsing technology, for filtering sentences in noisy domains such as informal text or speech, for estimating the effort for understanding text, for determining whether a sentence is well-formed and meaningful enough to send to other natural language processing (NLP) tasks such as machine translation in an NLP pipeline. PPP involves finding a function f: f(MP , Dtrain , S [, SP ′ ]) where
≈
eval(SP
′
, SP )
(1)
• MP is a parsing model built using Dtrain for training, • Dtrain is the set of training sentences and Dtest is test data,
© 2016 PBML. Distributed under CC BY-NC-ND. Corresponding author:
[email protected] Cite as: Ergun Biçici. Predicting the Performance of Parsing with Referential Translation Machines. The Prague Bulletin of Mathematical Linguistics No. 106, 2016, pp. 31–44. doi: 10.1515/pralin-2016-0010.
Unauthenticated Download Date | 10/18/16 2:52 PM
PBML 106
OCTOBER 2016
• SP ′ refers to parsing output obtained on S ∈ Dtest and its reference is SP , • eval returns the bracketing F1 score by EVALB (Sekine and Collins, 1997) implementing the PARSEVAL F1 measure, • the performance of MP , which use Dtrain , is being predicted for input S, • f predicts the value of the eval function to approximate the performance without the reference SP given a training set and a test set not necessarily after training a parsing model or parsing. Ravi et al. (2008) predict the performance of Charniak and Johnson (CJ) parser (Charniak and Johnson, 2005) using text-based and parser-based features, and additional parser output (Bikel parser (Bikel, 2002)). Additional parser output is used as a reference to obtain a feature with bracketing F1 score. In Section 3.3, we achieve better results using only textual features and obtain similar results without any parser or label dependent information or without an additional parser or its output. Each referential translation machine (RTM) (Biçici and Way, 2015) model is a data translation prediction model between the instances in the training set and the test set, and translation acts are indicators of the data transformation and translation. RTM effectively judges monolingual and bilingual similarity while identifying translation acts between any two data sets with respect to a reference corpus. RTM allows development of prediction models specially prepared for a given training and test set pair. RTM PPP models are built for each task emerging from training set, test set, and label set obtained from a parser. RTMs achieve top results in machine translation performance prediction (MTPP) in quality estimation task (Biçici et al., 2015b; Biçici, 2016), can achieve better results than open-source MTPP tool QuEst (Shah et al., 2013; Biçici and Specia, 2015), and can achieve top results in semantic similarity prediction tasks (Biçici and Way, 2015). We provide a current picture on PPP detailing prediction performance, top selected features, and lower bound on prediction error of PPP. RTMs judge the quality or the semantic similarity of texts by using relevant retrieved data close to the task instances as interpretants, selected preferably from the same domain. RTM PPP use parallel and monolingual sentences as interpretants, which provide context and data for MTPP system (MTPPS) (Biçici and Way, 2015) to derive features measuring the closeness of the test sentences to the training data, the difficulty of translating them, and the presence of the acts of translation for building prediction models. RTMs present an accurate and language-independent model for NLP performance prediction and provide a parser-independent model, which enables the prediction of the performance of any parser in any language. Figure 1 depicts the workflow for a general RTM model and explains the model building process. Given a training set train, a test set test, and some corpus C, preferably in the same domain, the RTM steps are: 1. select(train, test, C) → I 4. learn(M, Ftrain ) → M ˆ 2. MTPP(I, train) → Ftrain 5. predict(M, Ftest ) → y 3. MTPP(I, test) → Ftest 32 Unauthenticated Download Date | 10/18/16 2:52 PM
Ergun Biçici
Predicting the Performance of Parsing with RTM (31–44)
Figure 1. RTM workflow: ParFDA selects interpretants close to the training and test data using parallel corpus in bilingual settings and monolingual corpus in the target language or just the monolingual target corpus in monolingual settings; an MTPPS use interpretants and training data to generate training features and another use interpretants and test data to generate test features in the same feature space; learning and prediction takes place taking these features as input.
RTM PPP models use MTPPS to generate features and parallel feature decay algorithms (ParFDA) (Biçici et al., 2015a) for instance selection. The modularity of RTM enables additional knowledge sources to be retrieved by ParFDA, which can be used for deriving additional features to be included before learning and prediction.
2. Statistical Lower Bound on Prediction Error We evaluate the prediction performance with correlation (r), root mean squared error (RMSE), mean absolute error (MAE), and relative absolute error (RAE). Given ˆ, y ∈ Rn are the prediction of F1 and the target F1 respectively: that y n ∑
MAE(ˆ y, y) =
n ∑
|yˆi − yi |
i=1 n
RAE(ˆ y, y) =
|yˆi − yi |
i=1 n ∑
(2) |¯ y − yi |
i=1
33 Unauthenticated Download Date | 10/18/16 2:52 PM
PBML 106
OCTOBER 2016
n µ s d RAE 1% 5% 10% 20% 30% 40% 50% 75% 80% 85% Table 1. Estimated
WSJ24 1346 0.7095 0.1636 0.0087 ˆ ˆ d n 0.0013 57335 0.0067 2296 0.0134 576 0.0268 146 0.0402 66 0.0536 38 0.0670 25 0.1004 13 0.1071 12 0.1138 11
WSJ02-21 6960 0.7145 0.1633 0.0038 ˆ ˆ d n 0.0013 58164 0.0066 2329 0.0133 584 0.0265 148 0.0398 67 0.0531 39 0.0664 26 0.0995 13 0.1062 12 0.1128 11
ˆ and n ˆ required for the noise levels based on RAE for PPP with d and d bracketing F1 .
We also use relative MAE (MAER) and RAE (MRAER) (Equation (3)) (Biçici and Way, 2015). We use MAER and MRAER for easier replication and comparability with relative errors for each instance. Evaluation with MRAER can help identify which tasks and subtasks require more work by design and RTM PPP results reaching 0.75 MRAER in Section 3 are in line with performance in semantic textual similarity in English and easier than MTPP (Biçici and Way, 2015). MAE treats errors equally whereas RMSE is giving more weight to larger errors and can become dominated by the largest error. Therefore, MAE and RAE and their relative versions MAER and MRAER are better metrics to evaluate the performance. n ∑ |yˆi − yi |
MAER(ˆ y, y) =
i=1
⌊|yi |⌋ϵ n
MRAER(ˆ y, y) =
n ∑ |yˆi − yi | ⌊|¯ y − yi |⌋ϵ
(3)
i=1
n
We obtain expected lower bound on the prediction performance and the number of instances needed given a RAE level. Let y = (y1 , . . . , yn )T represent the target sampled from a distribution with mean µ and standard deviation σ, then the vari∑n 2 ¯, is σn with the standard deviation ance of i=1 yi is nσ2 and of the sample mean, y becoming √σn . From a statistical perspective, we can predict the number of training instances we need for learning to increase the signal to noise ratio, SNR = µ σ , or the ratio of the mean to the standard deviation. Increasing the number of instances leads 34 Unauthenticated Download Date | 10/18/16 2:52 PM
Ergun Biçici
Predicting the Performance of Parsing with RTM (31–44)
to decrease in the noise and increase SNR. We want to find a confidence interval, ¯ + t √sn ], where t is found by the Student’s t-distribution for n − 1 degrees [¯ y − t √sn , y of freedom with confidence level α and s is sample standard deviation. True score lies in the interval with probability 1 − α:1 s s ¯ + t √ ) = 1 − α. P(¯ y − t√ ≤ µ ≤ y n n
(4)
The absolute distance to the true mean or the width of the interval, d, is empirically equal to MAE and the relationship between RAE and MAE is as follows: nMAE RAE = ∑n y − yi | i=1 |¯
(5)
ts t 2 s2 d= √ ⇒n= 2 d n
(6)
ˆ for a given RAE as an estimate of d. Using Equation 5, we can derive the MAE or d ˆ and the corresponding n ˆ to With α = 0.05 and p = 0.95, we confidently estimate d reach the required noise level for the prediction tasks given a possible RAE level using Equation 6. Statistical lower bound on PPP error lists how many training instances to use for PPP (Table 1). Table 1 presents the d possible for the bracketing F1 score distribution and the training set sizes required for reaching a specified noise level based on RAE. We achieved top results in MTPP using RTMs (Biçici et al., 2015b) with a RAE level of 0.84 when predicting HTER, which is a score in the range [0, 1]. We also achieved good results in MTPP with RTMs as Biçici (2016) presents with a RAE level of 0.82 when predicting HTER. Table 4 from Section 3.3 presents similar RAE levels in in-domain PPP and with only 12 labeled instances for PPP, we can reach the top prediction performance, which achieves 0.84 RAE. Figure 2 samples from normal n-gram F1 (Biçici, 2011) distributions with µ = 0.2316 from MTPPDAT (Biçici, 2014) for different σ and shows that prediction error decrease by: (i) increasing n; (ii) decreasing s.2
3. Experiments We use the Wall Street Journal (WSJ) and Brown corpora distributed with Penn Treebank version 3 (Marcus et al., 1993, 1999). WSJ02-21 refers to WSJ sections in range 2–21, WSJ24 refers to section 24, WSJ23 refer to section 23, and WSJ0-1-22-24 refer to 1 This
forms the basis for many statistical significance tests in machine translation (Biçici, 2011).
2 MTPPDAT contains document and sentence translation experiments collected from 4 different settings:
tuning, no tuning, multiple perspective learning, and adaptation (Biçici, 2015).
35 Unauthenticated Download Date | 10/18/16 2:52 PM
PBML 106
OCTOBER 2016
Figure 2.
ˆ decrease by: (i) increasing n; (ii) decreasing s. d
sections 00, 01, 22, and 24 combined. BTest refers to the test set formed by selecting every 10th sentence from the Brown corpus (Ravi et al., 2008). WSJ02-21 contains 39832 sentences in total and WSJ0-1-22-24 contains 6960 sentences. We obtain the raw format for the Penn Treebank starting from the parse annotated sentences. 3.1. Parsers CCL: CCL (Seginer, 2007) is an unsupervised parsing algorithm, which allows equivalent classes with reciprocal links between words (link structures). PCFG: Plain PCFG (probabilistic context free grammar) parser uses the Stanford supervised parser (Klein and Manning, 2003). PCFG model is unlexicalized; it has context-free rules conditioned on only the parent nodes; it does not have language dependent heuristics for unknown word processing; and it selects the leftmost category as the head of the right hand side of a rule. CJ: Charniak and Johnson (Charniak and Johnson, 2005) develop a parser achieving the highest performance by reranking 50 best parses with a maximum entropy reranker.
36 Unauthenticated Download Date | 10/18/16 2:52 PM
Ergun Biçici
Predicting the Performance of Parsing with RTM (31–44)
train PPP test
Test WSJ0-1-22-24 WSJ24 WSJ23 BTest
# sents 6960 1346 2416 2425
CCL 0.5508 0.5489 0.5501 0.5646
PCFG 0.6978 0.6915 0.6933 0.6773
CJ 0.9139 0.9057 0.9141 0.8561
Table 2. Baseline performance in terms of bracketing F1 .
Corpus WSJ02-21 WSJ23 SPCCL ′ SPPCFG ′ SPCJ ′ BTest SPCCL ′ SPPCFG ′ SPCJ ′
numB 46.4 45.6 38.6 41.6 42.6 38.1 31.8 35.1 35.6
depthB 11.1 11.0 9.3 10.0 11.0 9.6 8.8 9.1 9.7
avg depthB 0.2678 0.2728 0.2829 0.2735 0.2887 0.3060 0.3551 0.3165 0.3248
R/L 6.46 6.36 6.14 6.11 5.96 6.09 6.77 7.05 6.63
avg R/L 6.68 6.66 6.14 5.72 6.27 5.50 6.04 5.25 5.50
Table 3. Tree structure statistics: number of brackets (numB), depth (depthB), average depth per node (avg depthB), numB on the right branches over the numB on the left (R/L), and average right to left branching over all internal tree nodes (avg R/L).
All parsers use WSJ02-21 for training and Table 2 lists the baseline performances of the parsers in terms of bracketing F1 over all sentences in the test sets along with the number of sentences in each.3 3.2. Features and Learning Settings We use WSJ24 or WSJ0-1-22-24 and WMT datasets (Bojar et al., 2015) and LDC English Gigaword (Parker et al., 2011) for building RTM PPP models. We use features from three categories where detailed feature descriptions can be found in (Biçici and Way, 2015): (i) Textual features (Text), which contain coverage and diversity features 3 The number of instances are the same as in (Bacchiani et al., 2006) and in (Kummerfeld et al., 2012) for WSJ23. The number of sentences reported in (Ravi et al., 2008) are lower. CCL lowercases input text and outputs lowercased trees; hence its performance is independent of casing. The output CCL tree is composed of text without labels and to be able to use the EVALB bracketing scores, we label each node with ’NP’ and enclose them with brackets. We could use any tag instead of NP since we are not calculating tag accuracy.
37 Unauthenticated Download Date | 10/18/16 2:52 PM
PBML 106
OCTOBER 2016
about how well test features are found in the training set, language model features, distributional similarity features, translation features, information retrieval related features, character n-grams, and sentence length related features; (ii) link structure based (+CCL), which contain Text features over CCL from CCL parser, which can be used in all learning settings since CCL is unsupervised; (iii) tree structure based (+Tree) features, which contain the number of brackets used (numB), depth (depthB), average depth per node (avg depthB), number of brackets on the right branches over the number of brackets on the left (R/L),4 and average right to left branching over all internal tree nodes (avg R/L). We select up to 100 features from the most frequent parse tree structures and add 10 base tree statistical features for source and target. This feature set is called TreeF in (Biçici and Way, 2015). Parse tree branching statistics for WSJ2-21, WSJ23, and BTest together with the parser outputs obtained with different parsers are in Table 3. CCL output parse trees tend to have fewer branches and less depth. However, CCL outputs trees with closer R/L and avg R/L to the test set than PCFG. CJ outputs trees with closest numB and depthB to the test sets. PCFG achieves the closest avg depthB. Table 3 indicates that right branching dominates English. We observe that CCL’s performance slightly increases on BTest whereas supervised parsers perform worse. We present RTM PPP model results for in-domain (WSJ23) and out-of-domain (BTest) test sets in three different feature settings (Text, Text+CCL, Text+CCL+Tree). For each combination of training set, test set, and training and test labels obtained from a parser, we build an RTM model; thus the total number of RTM models we build is 12. Training set is used for optimizing parameters of the predictor with kfold cross validation. The learning model is selected based on the performance on the training set and it is either bayesian ridge regression (BR) (Tan et al., 2015) or support vector regression (SVR) after feature selection (FS), partial least squares (PLS), or PLS after FS (Biçici et al., 2015b). 3.3. In-domain Results In-domain PPP results are in Table 4 where dim is the actual number of features used for each row (e.g. after removing non-informative features, after FS, after PLS). Using more training data improves the performance and we need only 15 feature dimensions for reaching top MRAER performance with SVR model with FS+PLS in setting Text. Previous work (Ravi et al., 2008) obtains 0.42 for r and 0.098 for RMSE when predicting the performance of CJ on in-domain PPP. We obtain lower r and close RMSE values however, we do not use any parser or label dependent information or a top performing reference parser whose performance is close to CJ’s. Ravi et al. (Ravi et al., 2008) also do not present separate results with the feature sets they use. The top
4 For nodes with uneven number of children, the nodes in the odd child contribute to the right branches.
38 Unauthenticated Download Date | 10/18/16 2:52 PM
Ergun Biçici
WSJ0-1-22-24
WSJ24
Train Setting
Text Text Text Text+CCL Text+CCL Text+CCL Text+CCL+Tree Text+CCL+Tree Text+CCL+Tree Text Text Text Text+CCL Text+CCL Text+CCL Text+CCL+Tree Text+CCL+Tree Text+CCL+Tree
Predicting the Performance of Parsing with RTM (31–44)
Parser
Model
dim r
RMSE MAE
RAE MAER MRAER
CCL PCFG CJ CCL PCFG CJ CCL PCFG CJ CCL PCFG CJ CCL PCFG CJ CCL PCFG CJ
SVR FS+PLS-BR FS-SVR FS-BR SVR FS-SVR SVR FS+PLS-SVR SVR SVR SVR FS+PLS-SVR SVR SVR PLS-SVR SVR FS-SVR PLS-SVR
305 5 16 16 331 16 384 15 386 310 310 15 336 336 90 387 248 80
0.135 0.162 0.104 0.135 0.163 0.104 0.135 0.17 0.103 0.133 0.16 0.108 0.133 0.16 0.107 0.132 0.159 0.106
0.87 0.95 0.88 0.88 0.93 0.88 0.87 0.97 0.88 0.85 0.91 0.85 0.85 0.91 0.85 0.84 0.91 0.85
0.47 0.31 0.26 0.47 0.3 0.27 0.47 0.26 0.27 0.49 0.37 0.25 0.49 0.37 0.26 0.5 0.38 0.27
0.1074 0.1265 0.0699 0.1084 0.1241 0.0698 0.1071 0.1295 0.0699 0.1052 0.1224 0.0675 0.1052 0.1222 0.0678 0.1041 0.122 0.0677
0.226 0.275 0.107 0.223 0.292 0.107 0.225 0.291 0.107 0.221 0.272 0.106 0.221 0.271 0.106 0.219 0.271 0.105
0.83 0.88 0.78 0.84 0.85 0.78 0.83 0.95 0.78 0.82 0.88 0.75 0.82 0.87 0.75 0.82 0.87 0.75
Table 4. RTM top predictor results with in-domain test set WSJ23. Using more training data improves the performance. Text reach top MRAER performance with only 15 dimensions. Best result for each metric is in bold.
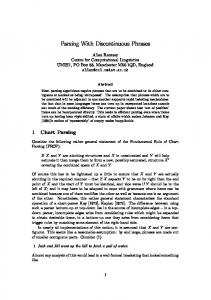
r they obtain with their text-based features is 0.19, which is lower than our results in setting Text. A high RAE indicates that PPP is hard and currently, we can only reduce the error with respect to knowing and predicting the mean by about 16%. CJ parsing output is the easiest to predict as we see from the MRAER results. The MAE we achieve for PPP of CJ is 0.0675 and it is about 7.4% of the 0.9141 overall F1 score for CJ on WSJ23. This error percentage is 17.6% and 18.9% for PCFG and CCL respectively. Figure 3 lists plots about the top RTM PPP predictor’s performance in terms of absolute error and absolute error relative to the magnitude of the target in WSJ23 where instances are sorted according to the magnitude of the target F1 scores. 3.4. Out-of-domain Results Out-of-domain parsing decreases the performance of supervised parsers (Table 2) but not the the performance of CCL, which is unsupervised, since it uses limited domain dependent information and CCL’s performance is actually slightly increased. RTM results in out-of-domain PPP are lower than in in-domain (Table 5). Adding Tree features in out-of-domain improves the performance more compared with the improvement in in-domain. Previous work (Ravi et al., 2008) obtains 0.129 RMSE for 39 Unauthenticated Download Date | 10/18/16 2:52 PM
PBML 106
OCTOBER 2016
CCL
PCFG SVR absolute error 0.8
0.8
0.6
0.6
0.6
0.4
0.2
500
1000 1500 Test CCL instances
0.0 0
2000
Test scores
2.0
class_target SVR AER
class_target
AER
500
1000 1500 Test PCFG instances
0.5
Test scores
1000 1500 Test CCL instances
2000
1000 1500 Test CJ instances
2000
Test scores class_target PLS-SVR AER
1.5
1.0
0.00
500
2.0
class_target FS-SVR AER
0.5
500
0.4
0.0 0
2000
1.5
1.0
PLS-SVR absolute error
0.2
2.0
1.5
0.00
0.4
class_target
0.0 0
class_target
0.8
0.2
class_target
CJ 1.0
FS-SVR absolute error
class_target
class_target
absolute error
1.0
1.0
0.5
500
1000 1500 Test PCFG instances
2000
0.00
500
1000 1500 Test CJ instances
2000
Figure 3. RTM top predictor performance using WSJ0-1-22-24 training set, WSJ23 test set, and Text+CCL+Tree setting. At the top are plots with prediction vs. the absolute error (distribution below) and at the bottom are plots with prediction vs. AER or absolute error relative to the magnitude of the target (distribution below).
CJ in out-of-domain PPP. RTM obtains about 36% larger RMSE but without using an additional parser output or parser specific features. We also note that the number of sentences reported in (Ravi et al., 2008) for datasets WSJ23, WSJ24, and BTest is less than the official datasets released as part of Penn Treebank (Marcus et al., 1993). RTM for CJ achieves better MRAER than top sentence MTPP with 0.84 MRAER (Biçici et al., 2015b). Figure 4 lists plots from the top RTM predictor’s performance in BTest. 3.5. Feature Selection Results We select features with recursive feature elimination (RFE) (Guyon et al., 2002; Pedregosa et al., 2011), which iteratively removes least informative features according to their weights provided by a learning model and this removal process provides their ranking. We use the following abbreviations: GM is the geometric mean between the precision and recall and T is used for target; ⟨P(T |S), b1⟩ is the backward 1-gram log probability of the translation probability of target translation T given source sentence S and ⟨P(S, T ), 2, 5⟩ is the average joint logprob of the joint translation probability over 2-grams among top 5 selected instances; avgD20 is a relative entropy distance measure over the top 20 instances; and bpw is the bits per word. We observe that translation 40 Unauthenticated Download Date | 10/18/16 2:52 PM
Ergun Biçici
WSJ0-1-22-24
WSJ24
Train Setting
Text Text Text Text+CCL Text+CCL Text+CCL Text+CCL+Tree Text+CCL+Tree Text+CCL+Tree Text Text Text Text+CCL Text+CCL Text+CCL Text+CCL+Tree Text+CCL+Tree Text+CCL+Tree
Predicting the Performance of Parsing with RTM (31–44)
Parser
Model
dim r
RMSE MAE
RAE MAER MRAER
CCL PCFG CJ CCL PCFG CJ CCL PCFG CJ CCL PCFG CJ CCL PCFG CJ CCL PCFG CJ
SVR FS+PLS-BR SVR FS-SVR FS+PLS-BR FS+PLS-SVR SVR SVR SVR SVR PLS-SVR PLS-SVR SVR SVR FS-SVR SVR SVR FS-SVR
305 8 305 16 7 3 383 386 386 310 70 35 336 336 21 386 394 22
0.144 0.182 0.168 0.145 0.177 0.167 0.143 0.183 0.168 0.143 0.182 0.174 0.142 0.177 0.175 0.142 0.181 0.175
0.91 0.95 0.87 0.91 0.94 0.86 0.91 0.93 0.87 0.9 0.93 0.88 0.9 0.91 0.88 0.89 0.92 0.88
0.45 0.25 0.23 0.44 0.31 0.25 0.45 0.27 0.23 0.45 0.29 0.24 0.46 0.35 0.24 0.46 0.32 0.24
0.1153 0.1414 0.1043 0.1161 0.1388 0.1031 0.115 0.1376 0.1042 0.1143 0.1376 0.1045 0.1138 0.1351 0.105 0.1135 0.1359 0.1048
0.221 0.342 0.244 0.223 0.329 0.242 0.221 0.352 0.244 0.22 0.344 0.248 0.219 0.335 0.249 0.219 0.344 0.249
0.9 0.87 0.77 0.92 0.87 0.76 0.91 0.85 0.77 0.9 0.87 0.79 0.9 0.85 0.8 0.9 0.86 0.8
Table 5. RTM top predictor results with out-of-domain test set BTest. Text+CCL reach top MRAER performance with only 3 dimensions. Best result for each metric is in bold.
features dominate in the ranking of the top 2 features after FS for each PPP setting (Table 6) with only 7 out of 36 entries are not translation features.
4. Contributions RTM PPP models work without training a parser or without parsing with it or without any parser dependent information by using only text input. We have contributed to the state-of-the-art in prediction science with results for PPP with RTM system and with expected lower bound on the prediction performance and the number of instances needed for prediction given a RAE level. RTM results on PPP allow better setting of expectations for each task and domain. Our results show that to obtain the top performance we only need 12 labeled instances and we can reach the top performance in a 15 dimensional space. Ability to predict outcomes enables preparation and savings in computational effort and can reduce costs in industrial settings.
Acknowledgments This work was supported in part by SFI for the “Monolingual and Bilingual Text Quality Judgments with Translation Performance Prediction” (13/TIDA/I2740) project and in part by the ADAPT research center (www.adaptcentre.ie, 07/CE/I1142) at Dublin 41 Unauthenticated Download Date | 10/18/16 2:52 PM
PBML 106
OCTOBER 2016
CCL
PCFG 1.0
SVR absolute error
0.8
0.6
0.6
0.6
0.4
0.2
500
1000 1500 Test CCL instances
0.0 0
2000
Test scores
2.0
class_target SVR AER
class_target
AER
500
1000 1500 Test CCL instances
0.5
Test scores
1000 1500 Test CCL instances
2000
1000 1500 Test CJ instances
2000
Test scores class_target FS-SVR AER
1.5
1.0
0.00
500
2.0
class_target SVR AER
0.5
500
0.4
0.0 0
2000
1.5
1.0
FS-SVR absolute error
0.2
2.0
1.5
0.00
0.4
class_target
0.0 0
class_target
0.8
0.2
class_target
CJ 1.0
SVR absolute error
0.8
class_target
class_target
absolute error
1.0
1.0
0.5
500
1000 1500 Test CCL instances
2000
0.00
500
1000 1500 Test CJ instances
2000
Figure 4. RTM top predictor performance using WSJ0-1-22-24 training set, BTest test set, and Text+CCL+Tree setting. At the top are plots with prediction vs. the absolute error (distribution below) and at the bottom are plots with prediction vs. AER or absolute error relative to the magnitude of the target (distribution below).
City University. We also thank the SFI/HEA Irish Centre for High-End Computing (ICHEC, www.ichec.ie) for the provision of computational facilities and support.
Bibliography Bacchiani, Michiel, Michael Riley, Brian Roark, and Richard Sproat. MAP adaptation of stochastic grammars. Computer Speech & Language, 20(1):41–68, 2006. doi: 10.1016/ j.csl.2004.12.001. Biçici, Ergun. The Regression Model of Machine Translation. PhD thesis, Koç University, 2011. Supervisor: Deniz Yuret. Biçici, Ergun. MTPPDAT: Machine Translation Performance Prediction Dataset, 2014. URL https://github.com/bicici/MTPPDAT. Biçici, Ergun. Domain Adaptation for Machine Translation with Instance Selection. The Prague Bulletin of Mathematical Linguistics, 103:5–20, 2015. ISSN 1804-0462. doi: 10.1515/pralin2015-0001. Biçici, Ergun. Referential Translation Machines for Predicting Translation Quality and Related Statistics. In Proc. of the First Conference on Statistical Machine Translation (WMT16), Berlin, Germany, 8 2016. Association for Computational Linguistics. 42 Unauthenticated Download Date | 10/18/16 2:52 PM
Ergun Biçici
Test Parser WSJ23
CCL PCFG CJ
BTest
CCL PCFG CJ
Predicting the Performance of Parsing with RTM (31–44)
Text ⟨P(S, T ), 2, 2⟩ bpw ⟨P(S, T ), 2, 5⟩ bpw ⟨P(S, T ), 2, 5⟩ bpw ⟨P(S, T ), 2, 2⟩ bpw ⟨P(S, T ), 1, 5⟩ bpw ⟨P(S, T ), 1, 1⟩ bpw ⟨P(T |S), 2, 5⟩ bpw ⟨P(T |S), 2, 10⟩ bpw T 1&2gram GM 1&2gram GM ⟨P(S, T ), 1, 1⟩ bpw ⟨P(T |S), 3, 10⟩ bpw
-0.007 -0.006 -0.082 -0.089 -0.001 -0.001 -0.218 -0.183 -0.142 -0.142 -0.048 -0.074
Table 6. RTM PPP model top
+CCL ⟨P(S, T ), 1, 10⟩ ⟨P(S, T ), 1, 3⟩ ⟨P(S, T ), 2, 5⟩ bpw ⟨P(S, T ), 2, 2⟩ bpw ⟨P(S, T ), 1, 1⟩ bpw ⟨P(T |S), 1, 2⟩ bpw ⟨P(T |S), 2, 10⟩ bpw ⟨P(T |S), 1, 2⟩ bpw ⟨P(T |S), b2⟩ T ⟨P(T |S), b2⟩ ⟨P(S, T ), 1, 1⟩ bpw 1&2gram prec
0.372 0.372 -0.082 -0.089 -0.001 -0.095 -0.183 -0.3 0.181 0.181 -0.048 -0.205
+Tree ⟨P(T |S), 2, 2⟩ bpw ⟨P(T |S), 2, 1⟩ bpw avgD20 T tree num ⟨P(T |S), 1, 2⟩ bpw ⟨P(S, T ), 1, 1⟩ bpw ⟨P(T |S), 2, 5⟩ bpw ⟨P(T |S), 2, 10⟩ bpw avgD20 coverscore ⟨P(S, T ), 1, 1⟩ bpw ⟨P(T |S), 1, 2⟩ bpw
-0.203 -0.222 -0.176 -0.162 -0.095 -0.001 -0.218 -0.183 -0.036 0.14 -0.048 -0.107
2 features for SVR with training set WSJ0-1-22-24.
Biçici, Ergun and Lucia Specia. QuEst for High Quality Machine Translation. The Prague Bulletin of Mathematical Linguistics, 103:43–64, 2015. ISSN 1804-0462. doi: 10.1515/pralin-20150003. Biçici, Ergun and Andy Way. Referential translation machines for predicting semantic similarity. Language Resources and Evaluation, pages 1–27, 2015. ISSN 1574-020X. doi: 10.1007/s10579-015-9322-7. Biçici, Ergun, Qun Liu, and Andy Way. ParFDA for Fast Deployment of Accurate Statistical Machine Translation Systems, Benchmarks, and Statistics. In Proc. of the EMNLP 2015 Tenth Workshop on Statistical Machine Translation, Lisbon, Portugal, 9 2015a. Association for Computational Linguistics. URL http://aclanthology.info/papers/parfda-for-fastdeployment-of-accurate-statistical-machine-translation-systems-benchmarks-andstatistics.
Biçici, Ergun, Qun Liu, and Andy Way. Referential Translation Machines for Predicting Translation Quality and Related Statistics. In Proc. of the EMNLP 2015 Tenth Workshop on Statistical Machine Translation, Lisbon, Portugal, 9 2015b. Association for Computational Linguistics. URL http://aclanthology.info/papers/referential-translation-machinesfor-predicting-translation-quality-and-related-statistics. Bikel, Daniel M. Design of a multi-lingual, parallel-processing statistical parsing engine. In Proc. of the second international conference on Human Language Technology Research, HLT ’02, pages 178–182, San Francisco, CA, USA, 2002. URL http://dl.acm.org/citation.cfm?id= 1289189.1289191. Bojar, Ondrej, Rajan Chatterjee, Christian Federmann, Barry Haddow, Chris Hokamp, Matthias Huck, Pavel Pecina, Philipp Koehn, Christof Monz, Matteo Negri, Matt Post, Carolina Scarton, Lucia Specia, and Marco Turchi. Findings of the 2015 Workshop on Statistical Machine Translation. In Proc. of the Tenth Workshop on Statistical Machine Translation, Lisbon, Portugal, September 2015. 43 Unauthenticated Download Date | 10/18/16 2:52 PM
PBML 106
OCTOBER 2016
Charniak, Eugene and Mark Johnson. Coarse-to-Fine n-Best Parsing and MaxEnt Discriminative Reranking. In Proc. of the 43rd Annual Meeting of the Association for Computational Linguistics (ACL’05), pages 173–180, Ann Arbor, Michigan, June 2005. doi: 10.3115/ 1219840.1219862. Guyon, Isabelle, Jason Weston, Stephen Barnhill, and Vladimir Vapnik. Gene Selection for Cancer Classification using Support Vector Machines. Machine Learning, 46(1-3):389–422, 2002. doi: 10.1023/A:1012487302797. Klein, Dan and Christopher D. Manning. Accurate unlexicalized parsing. In Proc. of the 41st Annual Meeting on Association for Computational Linguistics - Volume 1, ACL ’03, pages 423– 430, Stroudsburg, PA, USA, 2003. doi: 10.3115/1075096.1075150. Kummerfeld, Jonathan K., David Leo Wright Hall, James R. Curran, and Dan Klein. Parser Showdown at the Wall Street Corral: An Empirical Investigation of Error Types in Parser Output. In EMNLP-CoNLL, pages 1048–1059, 2012. Marcus, Mitchell P., Beatrice Santorini, and Mary Ann Marcinkiewicz. Building a Large Annotated Corpus of English: The Penn Treebank. Computational Linguistics, 19(2):313–330, 1993. Marcus, Mitchell P., Beatrice Santorini, Mary Ann Marcinkiewicz, and Ann Taylor. Treebank-3, Linguistic Data Consortium, 1999. Parker, Robert, David Graff, Junbo Kong, Ke Chen, and Kazuaki Maeda. English Gigaword Fifth edition, Linguistic Data Consortium, 2011. Pedregosa, F., G. Varoquaux, A. Gramfort, V. Michel, B. Thirion, O. Grisel, M. Blondel, P. Prettenhofer, R. Weiss, V. Dubourg, J. Vanderplas, A. Passos, D. Cournapeau, M. Brucher, M. Perrot, and E. Duchesnay. Scikit-learn: Machine Learning in Python. Journal of Machine Learning Research, 12:2825–2830, 2011. Ravi, Sujith, Kevin Knight, and Radu Soricut. Automatic prediction of parser accuracy. In Proc. of the Conference on Empirical Methods in Natural Language Processing, EMNLP ’08, pages 887–896, Stroudsburg, PA, USA, 2008. URL http://dl.acm.org/citation.cfm?id= 1613715.1613829. Seginer, Yoav. Learning Syntactic Structure. PhD thesis, Universiteit van Amsterdam, 2007. Sekine, Satoshi and Michael J. Collins. Evalb – Bracket Scoring Program, 1997. URL http: //cs.nyu.edu/cs/projects/proteus/evalb. Shah, Kashif, Eleftherios Avramidis, Ergun Biçici, and Lucia Specia. QuEst - Design, Implementation and Extensions of a Framework for Machine Translation Quality Estimation. The Prague Bulletin of Mathematical Linguistics, 100:19–30, 2013. doi: 10.2478/pralin-2013-0008. Tan, Liling, Carolina Scarton, Lucia Specia, and Josef van Genabith. USAAR-SHEFFIELD: Semantic Textual Similarity with Deep Regression and Machine Translation Evaluation Metrics. In Proc. of the 9th International Workshop on Semantic Evaluation (SemEval 2015), pages 85–89, 2015. URL http://aclweb.org/anthology/S15-2015.
Address for correspondence: Ergun Biçici
[email protected]
ADAPT Research Center, School of Computing, Dublin City University, Ireland 44 Unauthenticated Download Date | 10/18/16 2:52 PM