MCP Papers in Press. Published on December 3, 2015 as Manuscript O115.052266
Quantitative Profiling of Post-translational Modifications by Immunoaffinity Enrichment and LC-MS/MS in Cancer Serum without Immunodepletion
Hongbo Gu**, Jian Min Ren, Xiaoying Jia, Tyler Levy, Klarisa Rikova, Vicky Yang,
Kimberly A. Lee, Matthew P. Stokes, Jeffrey C. Silva
Cell Signaling Technology, 3 Trask Lane, Danvers, MA 01923 ** To whom correspondence should be addressed: Hongbo Gu, Proteomics Service Group, phone: (978) 867-2211; fax: (978) 867-2400; Email:
[email protected] Abbreviations: PTM: post-translational modification AML: acute myeloid leukemia BC: breast cancer
NSCLC: non-small cell lung cancer AcK: lysine acetylation
Rme: arginine mono-methylation pY: phospho-tyrosine
IMAC: immobilized metal ion affinity chromatography
Copyright 2015 by The American Society for Biochemistry and Molecular Biology, Inc.
1
Abstract
A robust method was developed and optimized for enrichment and quantitative
analysis of post-translational modifications (PTMs) in serum/plasma samples by combining immunoaffinity purification and LC-MS/MS without depletion of
abundant proteins. The method was used to survey serum samples of patients with acute myeloid leukemia (AML), breast cancer (BC), and non-small cell lung cancer
(NSCLC). Peptides were identified from serum samples containing phosphorylation, acetylation, lysine methylation, and arginine methylation. Of the PTMs identified, lysine acetylation (AcK) and arginine mono-methylation (Rme) were more
prevalent than other PTMs. Label-free quantitative analysis of AcK and Rme peptides was performed for sera from AML, BC and NSCLC patients. Several AcK and
Rme sites showed distinct abundance distribution patterns across the three cancer
types. The identification and quantification of post-translationally modified peptides
in serum samples reported here can be used for patient profiling and biomarker discovery research. Introduction
Biomarker identification is a key step for illustration of disease mechanisms, drug
development and diagnostics. Diagnostics research has focused on identifying
biomarkers from viable biofluids including serum/plasma, saliva, cerebrospinal fluid (CSF) and urine. Due to ease of collection and richness in proteins and metabolites, serum/plasma has been the preferred choice for diagnostic studies (1-
2
3). Advancement of mass spectrometry-based proteomic technologies has allowed
identification and quantification of thousands proteins in serum/plasma samples. Typically, these methods combine isotopic labeling, offline fractionation, and LCMS/MS analysis. Facilitated by high throughput proteomics analysis, researchers
have collected vast amounts of comparative information about protein abundance in serum/plasma of patients of various types of diseases that accelerated the identification of potential biomarkers (4).
To date, the majority of serum/plasma proteomic work has been conducted to
analyze total protein level abundance, with only a few studies to analyze post-
translational modifications (PTMs), usually glycosylation (5, 6). As one of the most
important
mechanisms
for
regulating
protein
function,
PTMs
including
phosphorylation, acetylation, ubiquitination, and methylation have been identified and validated as critical for signaling transduction, protein degradation and transcriptional regulation (7, 8). Currently, there exists very limited data about
PTMs in serum/plasma beyond glycosylation. The abundant serum protein albumin
has long been known to be acetylated by aspirin, and this reaction can occur in vitro without the presence of any acetyltransferase (9). Fibrinogen, another abundant
serum protein is also acetylated by aspirin both in vivo and in vitro (10, 11). These previous findings and the known importance of PTMs in cellular signaling provided
the impetus for a large-scale survey of PTMs other than glycosylation by immunoaffinity enrichment of PTM-containing peptides.
3
One challenge for proteomic analysis of serum/plasma is the broad dynamic range
of the serum/plasma proteome (12), including a high percentage of the total protein
content of serum/plasma represented by only twelve proteins. This limitation can
be partially overcome by immunodepletion of abundant proteins prior to enzymatic
digestion (4, 13), however, generation of the large quantities of materials necessary
for PTM enrichment with an immunodepletion workflow could be cost-prohibitive. It was therefore of interest to develop a PTM enrichment workflow from
serum/plasma without the need for depletion of the abundant proteins. This method allows PTM profiling from a reasonable volume of serum (~250μL for
multiple PTM enrichment) followed by LC-MS/MS analysis. Among the PTMs
surveyed, lysine acetylation (AcK) and arginine mono-methylation (Rme) were
identified as the more prevalent PTMs in cancer patients’ sera. These PTMs were
profiled in sera from patients with acute myelogenous leukemia (AML), breast cancer (BC) and non-small cell lung cancer (NSCLC). At 1% FDR, we have identified 796 unique AcK sites and 808 unique Rme sites in the sera of 12 cancer patients.
The abundant serum protein human albumin was identified acetylated at 59
different sites, while other abundant proteins were also found to be acetylated, including A2M and serotransferrin. About 25% of the identified AcK sites (190 out
of 796) were from the twelve most abundant serum proteins. In contrast, the Rme
sites identified were from a more diverse complement of proteins including
transcriptional regulators and RNA processing proteins. Quantitative analysis
identified a subset of peptides in each enrichment with differential abundance 4
across the three cancer types surveyed. For example, the abundance of a K155containing peptide from the Complement Component 3 protein (C3) was higher in the sera of NSCLC patients compared to AML and BC patients. Conversely, the
abundance of an R1593 mono-methylated peptide from protein ARID1A was lower
in the sera of NSCLC than the other two cancer types. Clustering of the quantitative
data for the AcK and Rme enrichments revealed patterns of modification specific to cancer type as well as patient pathology. Together, these data demonstrate the utility of PTM profiling of human serum samples for disease characterization and the potential for biomarker discovery. Experimental Procedures
Cancer patient serum- Serum samples of 4 patients of AML, BC and NSCLC were
purchased from Proteogenex (Culver City, CA). Patient information and the
concentration of total protein of each serum sample are provided in Supplemental Table S1.
Sample preparation- Serum samples were processed using the PTMScan method as previously described (14). Equal volumes of serum (250μL for individual sample) were mixed with urea lysis buffer (9M sequanol grade Urea, 20mM HEPES pH 8.0,
1mM β-glycerophosphate, 1mM sodium vanadate, 2.5mM sodium pyrophosphate)
to a final concentration of 6M urea. For technical triplicate experiment, 150μL
serum from four non-small cell lung cancer patients was pooled together and split 5
into three aliquots for independent processing. The samples were centrifuged at 16,000 x g for 15 min at 4°C. Supernatants were collected and reduced with 4.5mM
DTT for 30 min at 55OC. Reduced lysates were alkylated with iodoacetimide (0.095g
per 5mL H2O) for 15 min at room temperature in the dark. Samples were diluted
1:4 with 20mM HEPES pH 8.0 and digested overnight with 10μg/mL trypsin-TPCK (Worthington, #LS003740). Digested peptide lysates were acidified with 1% TFA
and peptides were desalted over 360mg SEP PAK Classic C18 columns (Waters, #WAT051910). Peptides were eluted with 40% acetonitrile in 0.1% TFA, dried under vacuum, and stored at -80OC.
Immunoprecipitation – Enrichment of post-translationally modified peptides was
performed using the antibodies listed in Table 1 following protocols described
previously (14, 15). Briefly, saturating amounts of the indicated antibodies were bound to 30µL packed Protein A agarose beads (Roche) overnight at 4OC.
Lyophilized serum peptides were resuspended in MOPS IAP buffer (50mM MOPS pH
7.2, 10mM KH2PO4, 50mM NaCl) and centrifuged 5 min at 10,000 x g. Supernatants
were mixed with antibody bead slurries for 2 hours at 4OC. Beads were pelleted by
centrifugation 30 seconds at 2,000 x g at 4OC. Beads were washed three times with 1.5 mL IAP buffer containing 1% NP-40 and three times with 1mL water (Burdick
and Jackson). Peptides were eluted from beads with 0.15% TFA (sequential elutions of 40µL followed by 35µL, 10 min each at room temperature). Eluted peptides were desalted over tips packed with Empore C18 (Sigma) and eluted with 40%
acetonitrile in 0.1% TFA. Eluted peptides were dried under vacuum and subject to a 6
second, in-solution trypsin digest using 250ng of sequencing grade trypsin
(Promega) in 50mM ammonium bicarbonate/5% acetonitrile for 2 hours at 37OC to
minimize mis-cleavage and digest any antibody remaining in the sample. Samples were acidified with TFA and re-purified over C18 tips as before.
IMAC – IMAC enrichment was performed as previously described (16). Nickel-
agarose magnetic beads (Qiagen) were treated with EDTA to remove the Nickel, washed 3X with H2O, loaded with aqueous FeCl3 for 30 min, and washed. For
phosphopeptide enrichment 10µl Fe3+-agarose slurry was added to peptide digested
from 10µl of serum in 1mL 0.1% TFA / 80% acetonitrile for 30 min at room
temperature. Unbound peptides were removed by washing 3X with 0.1% TFA/ 80% MeCN.
Bound peptides were eluted with 2X 50µL of 2.5% ammonia / 50%
acetonitrile solution for 5 min. The eluent was immediately acidified by 20% TFA
and dried in a speed-vac. Samples were resuspended in 50 µL 0.15% TFA, desalted over C18 tips and re-dried in a speed vac.
LC-MS/MS Analysis - Immunoprecipitated peptides were resuspended in 0.125%
formic acid and separated on a reversed-phase C18 column (75µm ID x 10cm)
packed into a PicoTip emitter (~8µm ID) with Magic C18 AQ (100Å x 5µm). Each
sample was split and analytical replicate injections were run to increase the number
of identifications and provide metrics for analytical reproducibility of the method. A standard peptide mix (MassPREPTM Protein Digestion Standard Mix 1, Waters) was
spiked in each sample vial in a total quantity of 100fmol (33fmol per injection) prior 7
to LC-MS/MS analysis. For antibody enrichment, peptides from 120µL serum were
run per injection, for IMAC peptides from 5µL serum were run per injection. Replicate injections were run non-sequentially to reduce artificial changes in
peptide abundance due to changes in instrument performance over time. One replicate of each sample was injected, then the second replicate in reverse order.
Peptides were eluted using a 120-minute or 150-minute linear gradient of
acetonitrile in 0.125% formic acid delivered at 280nL/min from 3% to 30%
acetonitrile. Tandem mass spectra were collected in a data-dependent manner with
an LTQ-Orbitrap ELITE mass spectrometer running XCalibur 2.0.7 SP1 using a toptwenty MS/MS method, a dynamic repeat count of one, and a repeat duration of 30 seconds. The isolation window was set at 1.0Da with a normalized collision energy
of 35%. Real time recalibration of mass error was performed using lock mass (17)
with a singly charged polysiloxane ion m/z = 371.101237. The data associated with this manuscript including labeled MS2 spectra in Skyline library format may be
downloaded from the ProteomeXchange Consortium via PRIDE with project accession numbers: PXD002931 [username:
[email protected]; password: wpPsK3wN] and PXD002932 [username:
[email protected]; password: qT4I4DrS].
MS/MS spectra were evaluated using SEQUEST and the Core platform from Harvard
University (18-20). Files were searched against the NCBI homo sapiens FASTA database updated on June 27, 2011 containing 34,899 forward and 34,899 reverse
sequences. A mass accuracy of +/-5 ppm was used for precursor ions and 1 Da for 8
product ions. Enzyme specificity was limited to trypsin, with at least one tryptic (Kor R-containing) terminus required per peptide and up to four mis-cleavages allowed. Cysteine carboxamidomethylation was specified as a static modification,
oxidation of methionine residue and the appropriate PTM were allowed as variable modifications for each enrichment sample set.
Reverse decoy databases were
included for all searches to estimate false discovery rates, and filtered using a 1% FDR in the Linear Discriminant module of Core.
All quantitative results were generated using Progenesis V4.1 (Waters Cooperation) and Skyline Version 3.1 to extract the integrated peak area of the corresponding
peptide assignments according to previously published protocols (21, 22). Extracted
ion chromatograms for peptide ions that changed in abundance between samples
were manually reviewed to ensure accurate quantitation in Skyline. Statistical analysis of the quantitative data was done using a two-tailed t-test between two cancer groups. The maximum negative log-p value from three comparison pairs was
used to indicate significance for abundance changes of a certain peptide between two cancer groups. False discovery rate for each binary comparison was further
controlled by applying the Benjamini-Hochberg procedure. Heat maps of the quantitative data were generated and clustered in Spotfire DecisionSite (TIBCO Software AB) version 9.1.2.
Western blotting – Equal volumes of serum samples were mixed with SDS-PAGE
sample buffer (Cell Signaling Technology, #7723,) and run on 4-20% gradient tris9
glycine gels (Invitrogen). For pan-AcK and pan-Rme western blots, serum was diluted 10-fold and 20μL was loaded. For albumin, serum was diluted 10,000- fold
and 20μL was loaded. Proteins were transferred to nitrocellulose (Millipore) and
blocked for 1 hour in 5% nonfat dry milk (Sigma) in TBS. Primary antibodies (pan-
AcK (#13420), pan-Rme (#8015/#8711) and albumin (#4929)) were incubated in 5%
BSA in TBS plus 0.1% Tween-20 (TBS-T) overnight at 4OC.
Membranes were
washed 3 times with TBS-T, incubated with anti-rabbit secondary antibody (#5366)
for 1 hour at room temperature in 5% milk TBS-T, washed 3 times with TBS-T, dried, and developed on the Odyssey near-infrared imaging system (LI-COR). antibodies were from Cell Signaling Technology.
All
Results
Enrichment workflow for PTM peptide identification- To demonstrate an optimal workflow for analysis of post-translational modifications in serum samples, we first tested enrichment using various PTM antibodies and IMAC-Fe3+ with pooled serum
samples as outlined in Table 1. Serum samples were directly processed for PTM
enrichment without any prior depletion of abundant serum proteins. The enrichments performed included IMAC-Fe3+, phosphotyrosine enrichment (pY),
phosphotyrosine enrichment followed by IMAC-Fe3+, acetyl-lysine enrichment (AcK),
arginine mono-methylation (Rme), and lysine pan-methylation (Kme). Of these
enrichments, acetyl-lysine and mono-methyl-arginine showed the most promising results, with the highest number of peptides per sample (Table 1). The number of 10
identifications for the phospho-enrichment was low, and failed to identify proteins/sites known to be important disease drivers or substrates for the cancer types profiled (data not shown).
PTM profiling from individual patient samples- Having established the ability to profile PTMs directly from serum samples, we then applied the immunoaffinity
enrichment method to profile lysine acetylation and arginine mono-methylation in
patient sera of acute myeloid leukemia (AML), breast cancer (BC) and non-small cell lung cancer (NSCLC), respectively (n=4 for each type of cancer, 12 samples total). As different PTMs were being profiled, PTM enrichment was performed sequentially on
the same sample as previously described (23). To minimize interference from factors such as sex, age and ethnic background, the study included only female
patients of Caucasian background (Supplemental Table S1). The general workflow of
the sequential enrichment is outlined in Figure 1. Prior to immunoaffinity enrichment, western blots using pan-AcK and Rme motif antibodies were performed
on the 12 patient samples (Supplemental Figure S1). Most of the AcK signal in the western blot fell into a molecular weight range between 58-80kDa, corresponding
to human albumin (MW = 69kDa), with other lower intensity bands visible
throughout the MW range. In the Rme blot, the strong signal from albumin was not
observed, with other bands detected at various molecular weights.
Enrichment for AcK generated a range of 214 to 486 unique AcK peptides from each
serum sample, while enrichment for Rme generated a range of 199 to 257 unique
11
Rme peptides from each serum sample (Supplemental Tables S2 and S3, Details Tab). Many AcK and Rme sites identified were represented by multiple peptides due to methionine oxidation, mis-cleavage, and different charge states. Tables were
made non-redundant by unique protein-site (Supplemental Tables S2 and S3,
Summary Tab) using the peptide with largest number of MS/MS identifications
(Count in Details Column, Summary Tab, Supplemental Table S2 and S3) as the best representative for a particular PTM site. In total, 796 and 808 unique sites were
identified for AcK and Rme, respectively. Of these, 672 AcK sites and 619 Rme sites
were previously unidentified and will be curated into the PhosphoSitePlus database as public resource (24).
Classification of proteins with identified PTMs- This study identified 520 and 688
unique proteins from AcK and Rme enrichment, respectively (Supplemental Table
S4). The top ten protein classes represented in each enrichment are shown in the pie charts in Figure 2A (AcK) and 2B (Rme). For AcK sites, the top five protein
categories were secreted protein, receptor/channel/transporter/cell surface protein, adhesion/extracellular protein, chromatin/DNA-binding/DNA repair/DNA
replication protein and transcriptional regulator. Peptides from albumin were identified acetylated at a total of 59 unique AcK sites, which is consistent with the
western blot signal shown in Supplemental Figure S1A. High numbers of acetylation sites were also identified on other serum abundant proteins including alpha-2-
macroglobulin and serotransferrin with a total number of 35 and 29 unique AcK sites identified, respectively. Overall, about 25% of all AcK sites identified (190 out
12
of 796) were from the top 12 abundant serum proteins. Conversely, for Rme, only 4
out of 808 unique Rme sites from top 12 abundant serum proteins were identified.
The top five protein categories for Rme were receptor/channel/transporter/cell surface protein, RNA processing, transcriptional regulator, adhesion/extracellular
protein and adaptor/scaffold. A large number of unique Rme sites were identified from various heterogeneous nuclear ribonucleoprotein (hnRNP) isoforms, most of
which have been identified before in a previous study (14). The presence of these
post-translationally modified hnRNP peptides in serum/plasma has not been previously reported. The data for the two enrichments was largely complementary,
with only 35 proteins identified in common (Supplemental Table S4, Supplemental Figure S2). There was also a low degree of overlap between these results and a recent large-scale plasma proteome study using iTRAQ labeling and offline
fractionation prior to LC-MS/MS analysis, which identified over 5300 proteins with
high confidence (4), with 226 out of 520 proteins in common for AcK, and 212 out of 688 for Rme (Supplemental Figure S2).
Reproducibility assessment of the method by technical triplicate analysis- A pooled mixture of NSCLC patient serum was split into three aliquots and subject to
parallel, independent trypsin digestion, sequential immuno-enrichment for AcK and
Rme, and LC-MS/MS analysis. We have identified 555, 502 and 515 unique AcK
peptides, and 373, 357 and 377 unique Rme peptides from the three independent samples, respectively. A total of 778 unique AcK peptides and 564 unique Rme
peptides were identified across the triplicate runs, of which, 361 (46%) AcK peptide 13
identifications and 226 (40%) Rme peptide identifications were shared by all three
samples (Supplemental Figure S3). Of the unique peptides identified, 380 AcK and 356
Rme
were
quantified
using
the
label-free
quantification
approach
(Supplemental Tables S5 and S6). The distributions of %CV between technical triplicates for the two PTMs are shown in Supplemental Figure S4. The
median %CVs were 23% and 17% for lysine acetylation and arginine monomethylation, respectively. About 78% of acetyl-lysine peptides and 94% of mono
methyl-arginine peptides had %CVs lower than 40%, indicating good technical reproducibility of the method (Supplemental Figure S4).
Quantitative analysis of AcK and Rme peptides across three cancer types- A
label-free quantification strategy was applied to analyze PTM site-specific abundance changes across the three cancer types profiled. Analytical replicates of
each enriched peptide mixture were run to allow greater opportunity for identification of unique peptides and to provide data on analytical reproducibility of
the method. To monitor the stability of the LC, ionization efficiency, and sensitivity, a standard peptide mix of HPLC purified peptides from four proteins was added to each sample prior to LC-MS/MS. Sequences of the four standard proteins were
added to the human database to allow identification of these peptides in each LCMS/MS run. Standard peptides with retention times spanning entire gradient range
were chosen to monitor instrument performance. Standard peptide retention times and integrated MS1 peak areas across all 48 LC-MS/MS runs were consistent,
14
indicating good performance of the instrument throughout the analysis. (Supplemental Figure S5).
Both Skyline and Progenesis were used for the label-free quantification of post-
translationally modified peptides across all samples. Both programs perform
retention time alignment across LC-MS/MS runs by either common MS2 identifications (Skyline) or common ion features (Progenesis) so that a narrow and accurate precursor window can be applied to each unique peptide or ion feature
(21). This methodology allows determination of peptide peak intensities across all samples even if a particular peptide was not MS/MS identified in every sample run (14, 21, 25).
Other important quality control metrics for label-free quantification include
coefficients of variation (%CV) between analytical replicates and chromatographic
shape of the extracted ion chromatograms (EIC), both of which were monitored in Skyline. In total, we have quantified 612 and 621 unique sites for AcK and Rme,
respectively (Summary Tab of Supplemental Tables S2 and S3). The median %CV
was 14% for AcK out of 6,983 analytical replicate measurements across all samples; and 15% for Rme out of 7,200 analytical replicate measurements across all samples.
Histograms plotting the distribution of %CVs for AcK and Rme data are shown in Supplemental Figure S6.
15
The fold change of each unique PTM site across three cancer types were calculated by comparing the average intensity of the chosen modified peptide across all four
patients of each cancer type. Statistical analysis of each binary comparison was
performed using a two-tailed t-test (Summary Tab of Supplemental Tables S2 and S3). Those PTM sites with any fold change greater than 2.5 or less than -2.5, and a
corresponding p-value less than 0.01 were manually examined in Skyline, and are indicated with bold intensity values in the Summary Tabs of Supplemental Tables S2 and S3.
Peptide intensities in the 12 individual patient samples were compared to the
median intensity across all samples to generate log2 ratios. Log2 ratios were used to
generate heat maps in Spotfire and hierarchically clustered. For Rme data, samples from the same cancer type clustered together, with higher correlation between breast cancer and acute myeloid leukemia than with non-small cell lung cancer
(Figure 3B). For AcK data, not all patients of the same type of cancer were clustered in the same group. Specifically, patients #1, #2 and #3 of non-small cell lung cancer
were clustered together, while patient #4 was an obvious outlier that exhibited a significantly different pattern of abundance for most unique AcK sites (Figure 3A).
Consistent with the clustering results of Rme data, the correlation between breast cancer group and acute myeloid leukemia is closer than those with non-small cell lung cancer.
16
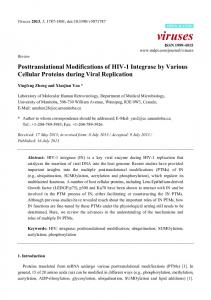
Specific examples of differential relative abundance between cancer types included a Complement Component 3 (C3) peptide acetylated at K155 (Figure 4A). This peptide was 4.4- and 8.1-fold higher intensity in NSCLC samples than the average intensity in breast cancer and AML samples, respectively (Figure 4B). An R1593-
monomethylated peptide from the protein ARID1A was identified (Figure 4C) and
its abundance was 4.3- and 5.4-fold lower in NSCLC samples than the average intensity in breast cancer and AML samples, respectively (Figure 4D). Some
peptides showed an inconsistent intensity pattern even within the same cancer type, such as a peptide acetylated at K298 of albumin (Figure 5A). This peptide was of higher abundance in NSCLC patients #1, #2 and #3 with 2.9- and 9.7-fold increase compared to the other two cancer types, whereas NSCLC patient #4 showed similar intensity to breast cancer and AML samples (Figure 5B). Although there were
differences in relative abundance for several acetylated peptides derived from albumin, the overall protein level of albumin was not changed (Figure 5C). The
histological diagnosis of NSCLC patient #4 (with 35 years of smoking history) was
squamous cell carcinoma; while the histological diagnosis of #1, #2 and #3 patients (non-smokers) of NSCLC was adenocarcinoma (Supplemental Table S1). Discussion
Extensive effort has been expended on method development for analyzing the serum/plasma proteome to identify potential biomarkers (1, 3, 26, 27). In the
current study, we have developed a robust workflow combining PTM motif antibody 17
enrichment and LC-MS/MS analysis for profiling different PTMs. The workflow has
proven successful to analyze both plasma (data not shown) and serum samples for
many commonly studied PTMs including phosphorylation, acetylation, arginine methylation, and lysine methylation, with lysine acetylation and arginine mono-
methylation yielding the highest number of unique peptide identifications.
Another important feature of the workflow is its compatibility with both label-free
and isobaric labeling quantification strategies. For this study, we employed labelfree quantification based on MS1 precursor intensities for each identified PTM peptide (14, 22). The key factor for successful label-free quantification is the
consistency of instrument performance during the entire data collection period. To
validate the reproducibility of the method, we have performed a technical triplicate experiment using pooled NSCLC serum. At the MS2 identification level, 46% (361
out of 778 unique AcK peptides) and 40% (226 out of 564 unique Rme peptides) of
peptides were identified across all three LC-MS/MS (Supplemental Figure S3). The
MS1 integrated peak areas of identified modified peptides showed a tight distribution of %CV across technical triplicate samples (Supplemental Figure S4),
with the median %CV for AcK and Rme peptides were 23% and 17%, respectively
(Supplemental Tables S5 and S6). This quantitative data demonstrates the
robustness of the method as well as the accuracy of label-free quantification for peptides with PTMs. This data is consistent with previous studies showing the
reproducibility of label-free quantification, and label-free quantification followed by
affinity purification has been broadly adopted for quantifying changes of various
18
PTMs (14, 21, 28-33). Various software solutions, both academic and commercial, have been developed for label-free quantitative approaches, including MaxLFQ,
Skyline, Ideal-Q and OpenMS. These software packages have been extensively tested and validated in the literature (25, 34-36). Additionally, data from the spiked-in
standard peptides showed reproducible retention time and integrated peak areas across all 48 LC-MS/MS runs that spanned over a week of continuous instrument
operation (Supplemental Figure S5). The accuracy of the quantitative data was also ensured by manual review of integrated peaks for those peptides with significant abundance changes across different cancer groups. The quantitative data from this
study showed a distinct pattern for both AcK and Rme in which NSCLC patient
samples were significantly different than AML and BC (Figure 3). The hierarchical clustering based on the quantitative data also identified patient #4 of NSCLC as an outlier in the group for both modifications. Patient #4 was diagnosed as adenocarcinoma while the other three NSCLC patients were diagnosed as squamous
cell carcinoma, raising the possibility that serum PTMs could also serve as
biomarkers for histological classification of NSCLC. The small number of samples for
each cancer type profiled in this study precludes definitive conclusions on this point, but serves as an area worthy of further investigation. Therefore, it should be noted that this study is largely technical in nature, and further work on a larger cohort of samples would be necessary to more fully validate candidate disease biomarkers identified herein.
19
In order to achieve deeper proteome coverage of serum/plasma, recent studies have
employed immunodepletion of abundant proteins followed by offline fractionation prior to LC-MS/MS analysis (4, 37). Combined with multiplex isotopic labeling,
Keshishian et. al. confidently identified over 5,300 proteins from plasma samples of four patients (4). In the current study, we identified a total of 1,173 unique proteins by combining the results of both AcK and Rme enrichments. Of these, there were
422 proteins overlapping between the two studies (Supplemental Table S4, Supplemental Figure S2). It should be noted that two unique peptides were required
for protein identification in the study by Keshishian et. al., while in this study we
reported all proteins with at least one unique modified peptide that passed 1% FDR
filtering. We also compared our results with identified plasma proteins deposited in the Plasma Proteome Database (38). Roughly half of the proteins identified in our
study (428 out of 1173) are absent from the repository database (Supplemental Table S4). We believe the complementarity of the results at the protein level is due
to the specific enrichment by PTM motif antibodies that unveiled a large group of
low abundance proteins including transcriptional regulators, RNA processing
proteins and receptors. Interestingly, in the AcK enrichment samples, we identified
several serum-abundant proteins including albumin, APOA1, serotransferrin, alpha2-macroglobulin, and most were acetylated at multiple lysine sites. We have observed differential patterns of acetylation in NSCLC patients #1, #2 and #3
(histological diagnosis of adenocarcinoma) for these proteins compared to the NSCLC patient #4 (histological diagnosis of squamous cell carcinoma) (Figure 3).
The protein group showing higher abundance of acetylated peptides in NSCLC 20
included albumin, with several lysine acetylation sites showing similar patterns as exemplified by K298 (Figure 5B). The differential abundance of acetylated albumin peptides was in contrast to the total protein level of albumin, which showed
minimal changes across all 12 cancer patients (Figure 5C). As the most abundant protein in blood, albumin had previously been considered as an interfering protein
rather than a potential biomarker when performing serum/plasma proteome
profiling studies. However, the findings in this study of differential acetylation sites on albumin such as K160, K161 and K298 in different cancer types suggest that the
potential exists for biomarker discovery even among abundant serum proteins.
Histone proteins, including H1, H3 and H4 were identified in the study heavily
acetylated at a number of lysine sites. Hyper-acetylation of core histone tails is believed to neutralize the positive charge of these domains and weaken histone-
DNA and nucleosome-nucleosome interactions. This weakening destabilizes
chromatin structure and increases the accessibility of DNA to various DNA-binding
proteins (39-41). Peptides from histone H3.3 acetylated at Lys15, Lys 19 and H4 Lys 6, Lys 13, Lys17 showed significant abundance differences between cancer groups that may serve as indicators of the status of nucleosomes.
In contrast to the lysine acetylation results, in which many peptides were identified from abundant serum proteins, arginine mono-methylated peptides identified were
distributed into diverse protein groups with few assignments to abundant serum
proteins. The abundance differences of Rme sites were also generally less dramatic 21
than AcK sites between the NSCLC group and the other two cancer groups (Figure 3). Although there were not as many dramatic intensity changes of Rme sites across the
three cancer groups, the four patients belonging to each cancer group clustered together indicating more direct correlation between cancer type and arginine mono-
methylation levels in serum than lysine acetylation levels. Consistent with the
hierarchical clustering showing a closer relationship between AML and BC as cancer
groups (Figure 3), none of the p-values derived from methyl-arginine quantitative
data for site AML and BC samples passed Benjamini-Hochberg critical value analysis
(Supplemental Table S3), which indicates similar levels of arginine monomethylation levels between AML and BC. There were, however, significant
differences in site abundance between NSCLC serum samples compared to AML or BC including heterogeneous nuclear ribonucleoproteins, well studied RNA
processing proteins involved in post-transcriptional modification of pre-mRNA (42).
Methylation of hnRNP family members containing the RGG motif promotes import into the nucleus (43). Therefore, changes in the levels of identified arginine methylation level in hnRNPs such as R291 of hnRNP A0, R206 of hnRNP A1, R203 of
hnRNP A2/B1 and R272 of hnRNP D0 may help estimate their nucleo-cytoplasmic
shuttling as well as post-transcriptional regulation in different cancers.
There have been few studies that detail post-translational modification of
serum/plasma proteins, so it was not clear whether the acetylation and arginine methylation identified from our study was regulated by well-known enzymatic
catalysis or in an enzyme-independent manner. For example, we have identified 22
several well-studied lysine acetylation sites on histones including H3 and H4
(Supplemental Table S2). This finding is supported by the presence of several types of histone acetyltransferases as well as histones in the bloodstream even though
they are nuclear proteins (44-46). Acetylation of albumin and hemoglobin by
circulating aspirin has been previously shown in blood, providing one possible
explanation for enzyme-independent lysine acetylation of serum abundant proteins (47). The identification of most arginine methylation sites on low abundance proteins such as transcriptional regulators and RNA processing proteins in our study makes it less likely that there was a concentration-dependent, enzyme-
independent reaction for methylation in blood. In fact, numerous protein arginine methyltransferases have been identified in plasma in previous studies (44, 48).
Therefore, arginine methylation could occur either in intracellular compartments followed by release to the bloodstream or be catalyzed in the bloodstream directly.
In summary, we have completed a large-scale PTM profiling study in serum that
identified many different types of PTMs in bloodstream. To our knowledge, this is the first study that systematically identified and quantified PTMs in serum. The
workflow we have developed and optimized successfully provided accurate quantitative information for lysine acetylation and arginine mono-methylation in
the serum samples of three cancer types. The successful identification of Rme
modification of low abundance proteins demonstrated the specificity and sensitivity of PTM motif antibody based enrichment for serum samples. In addition, the
identification of multiple lysine acetylation sites in abundant serum proteins such as 23
albumin, some of which showed differential abundance patterns across cancer types proved that immunodepletion of top abundant proteins in serum is unnecessary and
potentially undesirable for serum PTM profiling studies. Together, these results provide novel identification data of post-translational modifications of serum
proteins and define a workflow that is suitable for large-scale quantitative proteomic studies of clinical serum/plasma samples for biomarker identification.
24
Table 1: Summary of post-translationally modified peptides identified using various enrichments from pooled sera of cancer patients. Exp. #
Sample
Enrichment Method
PTM type
Raw file
Unique modified peptide
2
BC
IMAC-Fe3+
pSTY
23169
184
1
AML
3
NSCLC
5
BC
4
IMAC-Fe3+ IMAC-Fe3+
AML
pY motif antibody
6
NSCLC
pY motif antibody
8
BC
7
AML
9
NSCLC
11
BC
10
pY motif antibody pY → IMAC-Fe3+ pY → IMAC-Fe3+ pY → IMAC-Fe3+
pSTY pSTY pY pY pY pY pY pY
AML
AcK motif antibody
AcK
12
NSCLC
AcK motif antibody
AcK
14
BC
13
AcK motif antibody
AcK
AML
Rme motif antibody
Rme
15
NSCLC
Rme motif antibody
Rme
17
BC
16 18
AML
NSCLC
Rme motif antibody
Rme
Pan-Kme antibody
Kme (mono, di, tri)
Pan-Kme antibody
Kme (mono, di, tri)
Pan-Kme antibody
Kme (mono, di, tri)
23168 23170 23231 23232 23233 23234 23235 23236
148 145 39 39 44 19 26 25
23171
355
23173
431
23172 23238 23239 23240 23241 23242 23243
359 206 172 138 117 142 148
25
References: 1. Galasko, D., and Golde, T. E. (2013) Biomarkers for Alzheimer's disease in plasma, serum and blood - conceptual and practical problems. Alzheimer's research & therapy 5, 10 2. Ahn, J. M., Sung, H. J., Yoon, Y. H., Kim, B. G., Yang, W. S., Lee, C., Park, H. M., Kim, B. J., Kim, B. G., Lee, S. Y., An, H. J., and Cho, J. Y. (2014) Integrated glycoproteomics demonstrates fucosylated serum paraoxonase 1 alterations in small cell lung cancer. Molecular & cellular proteomics : MCP 13, 30-48 3. Yotsukura, S., and Mamitsuka, H. (2015) Evaluation of serum-based cancer biomarkers: a brief review from a clinical and computational viewpoint. Critical reviews in oncology/hematology 93, 103-115 4. Keshishian, H., Burgess, M. W., Gillette, M. A., Mertins, P., Clauser, K. R., Mani, D. R., Kuhn, E. W., Farrell, L. A., Gerszten, R. E., and Carr, S. A. (2015) Multiplexed, Quantitative Workflow for Sensitive Biomarker Discovery in Plasma Yields Novel Candidates for Early Myocardial Injury. Molecular & cellular proteomics : MCP 5. Berven, F. S., Ahmad, R., Clauser, K. R., and Carr, S. A. (2010) Optimizing performance of glycopeptide capture for plasma proteomics. Journal of proteome research 9, 1706-1715 6. Chen, S., Lu, C., Gu, H., Mehta, A., Li, J., Romano, P. B., Horn, D., Hooper, D. C., Bazemore-Walker, C. R., and Block, T. (2012) Aleuria Aurantia Lectin (AAL)-reactive immunoglobulin G rapidly appears in sera of animals following antigen exposure. PloS one 7, e44422 7. Prabakaran, S., Lippens, G., Steen, H., and Gunawardena, J. (2012) Posttranslational modification: nature's escape from genetic imprisonment and the basis for dynamic information encoding. Wiley interdisciplinary reviews. Systems biology and medicine 4, 565-583 8. Huang, H., Lin, S., Garcia, B. A., and Zhao, Y. (2015) Quantitative proteomic analysis of histone modifications. Chemical reviews 115, 2376-2418 9. Liyasova, M. S., Schopfer, L. M., and Lockridge, O. (2010) Reaction of human albumin with aspirin in vitro: mass spectrometric identification of acetylated lysines 199, 402, 519, and 545. Biochemical pharmacology 79, 784-791 10. Bjornsson, T. D., Schneider, D. E., and Berger, H., Jr. (1989) Aspirin acetylates fibrinogen and enhances fibrinolysis. Fibrinolytic effect is independent of changes in plasminogen activator levels. The Journal of pharmacology and experimental therapeutics 250, 154-161 11. Pinckard, R. N., Hawkins, D., and Farr, R. S. (1968) In vitro acetylation of plasma proteins, enzymes and DNA by aspirin. Nature 219, 68-69 12. Mitchell, P. (2010) Proteomics retrenches. Nature biotechnology 28, 665-670 13. Adkins, J. N., Varnum, S. M., Auberry, K. J., Moore, R. J., Angell, N. H., Smith, R. D., Springer, D. L., and Pounds, J. G. (2002) Toward a human blood serum proteome: analysis by multidimensional separation coupled with mass spectrometry. Molecular & cellular proteomics : MCP 1, 947-955 14. Guo, A., Gu, H., Zhou, J., Mulhern, D., Wang, Y., Lee, K. A., Yang, V., Aguiar, M., Kornhauser, J., Jia, X., Ren, J., Beausoleil, S. A., Silva, J. C., Vemulapalli, V., Bedford, M. 26
T., and Comb, M. J. (2014) Immunoaffinity enrichment and mass spectrometry analysis of protein methylation. Molecular & cellular proteomics : MCP 13, 372-387 15. Svinkina, T., Gu, H., Silva, J. C., Mertins, P., Qiao, J., Fereshetian, S., Jaffe, J. D., Kuhn, E., Udeshi, N. D., and Carr, S. A. (2015) Deep, quantitative coverage of the lysine acetylome using novel anti-acetyl-lysine antibodies and an optimized proteomic workflow. Molecular & cellular proteomics : MCP 16. Ficarro, S. B., Zhang, Y., Carrasco-Alfonso, M. J., Garg, B., Adelmant, G., Webber, J. T., Luckey, C. J., and Marto, J. A. (2011) Online nanoflow multidimensional fractionation for high efficiency phosphopeptide analysis. Molecular & cellular proteomics : MCP 10, O111 011064 17. Olsen, J. V., de Godoy, L. M., Li, G., Macek, B., Mortensen, P., Pesch, R., Makarov, A., Lange, O., Horning, S., and Mann, M. (2005) Parts per million mass accuracy on an Orbitrap mass spectrometer via lock mass injection into a C-trap. Molecular & cellular proteomics : MCP 4, 2010-2021 18. Eng, J. K., McCormack, A. L., and Yates, J. R. (1994) An approach to correlate tandem mass spectral data of peptides with amino acid sequences in a protein database. Journal of the American Society for Mass Spectrometry 5, 976-989 19. Huttlin, E. L., Jedrychowski, M. P., Elias, J. E., Goswami, T., Rad, R., Beausoleil, S. A., Villen, J., Haas, W., Sowa, M. E., and Gygi, S. P. (2010) A tissue-specific atlas of mouse protein phosphorylation and expression. Cell 143, 1174-1189 20. Villen, J., Beausoleil, S. A., Gerber, S. A., and Gygi, S. P. (2007) Large-scale phosphorylation analysis of mouse liver. Proceedings of the National Academy of Sciences of the United States of America 104, 1488-1493 21. Schilling, B., Rardin, M. J., MacLean, B. X., Zawadzka, A. M., Frewen, B. E., Cusack, M. P., Sorensen, D. J., Bereman, M. S., Jing, E., Wu, C. C., Verdin, E., Kahn, C. R., Maccoss, M. J., and Gibson, B. W. (2012) Platform-independent and label-free quantitation of proteomic data using MS1 extracted ion chromatograms in skyline: application to protein acetylation and phosphorylation. Molecular & cellular proteomics : MCP 11, 202-214 22. Gnad, F., Young, A., Zhou, W., Lyle, K., Ong, C. C., Stokes, M. P., Silva, J. C., Belvin, M., Friedman, L. S., Koeppen, H., Minden, A., and Hoeflich, K. P. (2013) Systems-wide analysis of K-Ras, Cdc42, and PAK4 signaling by quantitative phosphoproteomics. Molecular & cellular proteomics : MCP 12, 2070-2080 23. Mertins, P., Qiao, J. W., Patel, J., Udeshi, N. D., Clauser, K. R., Mani, D. R., Burgess, M. W., Gillette, M. A., Jaffe, J. D., and Carr, S. A. (2013) Integrated proteomic analysis of post-translational modifications by serial enrichment. Nature methods 10, 634-637 24. Hornbeck, P. V., Chabra, I., Kornhauser, J. M., Skrzypek, E., and Zhang, B. (2004) PhosphoSite: A bioinformatics resource dedicated to physiological protein phosphorylation. Proteomics 4, 1551-1561 25. Rotival, M., Ko, J. H., Srivastava, P. K., Kerloc'h, A., Montoya, A., Mauro, C., Faull, P., Cutillas, P. R., Petretto, E., and Behmoaras, J. (2015) Integrating phosphoproteome and transcriptome reveals new determinants of macrophage multinucleation. Molecular & cellular proteomics : MCP 14, 484-498 27
26. Chung, L., Moore, K., Phillips, L., Boyle, F. M., Marsh, D. J., and Baxter, R. C. (2014) Novel serum protein biomarker panel revealed by mass spectrometry and its prognostic value in breast cancer. Breast cancer research : BCR 16, R63 27. Patz, E. F., Jr., Campa, M. J., Gottlin, E. B., Kusmartseva, I., Guan, X. R., and Herndon, J. E., 2nd (2007) Panel of serum biomarkers for the diagnosis of lung cancer. Journal of clinical oncology : official journal of the American Society of Clinical Oncology 25, 5578-5583 28. Sharma, K., D'Souza, R. C., Tyanova, S., Schaab, C., Wisniewski, J. R., Cox, J., and Mann, M. (2014) Ultradeep human phosphoproteome reveals a distinct regulatory nature of Tyr and Ser/Thr-based signaling. Cell Rep 8, 1583-1594 29. Stokes, M. P., Farnsworth, C. L., Moritz, A., Silva, J. C., Jia, X., Lee, K. A., Guo, A., Polakiewicz, R. D., and Comb, M. J. (2012) PTMScan direct: identification and quantification of peptides from critical signaling proteins by immunoaffinity enrichment coupled with LC-MS/MS. Molecular & cellular proteomics : MCP 11, 187201 30. Sudhir, P. R., Chen, C. H., Pavana Kumari, M., Wang, M. J., Tsou, C. C., Sung, T. Y., Chen, J. Y., and Chen, C. H. (2012) Label-free quantitative proteomics and Nglycoproteomics analysis of KRAS-activated human bronchial epithelial cells. Molecular & cellular proteomics : MCP 11, 901-915 31. de Graaf, E. L., Giansanti, P., Altelaar, A. F., and Heck, A. J. (2014) Single-step enrichment by Ti4+-IMAC and label-free quantitation enables in-depth monitoring of phosphorylation dynamics with high reproducibility and temporal resolution. Molecular & cellular proteomics : MCP 13, 2426-2434 32. Rardin, M. J., Newman, J. C., Held, J. M., Cusack, M. P., Sorensen, D. J., Li, B., Schilling, B., Mooney, S. D., Kahn, C. R., Verdin, E., and Gibson, B. W. (2013) Label-free quantitative proteomics of the lysine acetylome in mitochondria identifies substrates of SIRT3 in metabolic pathways. Proceedings of the National Academy of Sciences of the United States of America 110, 6601-6606 33. Hendriks, I. A., D'Souza, R. C., Yang, B., Verlaan-de Vries, M., Mann, M., and Vertegaal, A. C. (2014) Uncovering global SUMOylation signaling networks in a sitespecific manner. Nat Struct Mol Biol 21, 927-936 34. Cox, J., Hein, M. Y., Luber, C. A., Paron, I., Nagaraj, N., and Mann, M. (2014) Accurate proteome-wide label-free quantification by delayed normalization and maximal peptide ratio extraction, termed MaxLFQ. Molecular & cellular proteomics : MCP 13, 2513-2526 35. Tsou, C. C., Tsai, C. F., Tsui, Y. H., Sudhir, P. R., Wang, Y. T., Chen, Y. J., Chen, J. Y., Sung, T. Y., and Hsu, W. L. (2010) IDEAL-Q, an automated tool for label-free quantitation analysis using an efficient peptide alignment approach and spectral data validation. Molecular & cellular proteomics : MCP 9, 131-144 36. Weisser, H., Nahnsen, S., Grossmann, J., Nilse, L., Quandt, A., Brauer, H., Sturm, M., Kenar, E., Kohlbacher, O., Aebersold, R., and Malmstrom, L. (2013) An automated pipeline for high-throughput label-free quantitative proteomics. Journal of proteome research 12, 1628-1644 37. Kimura, A., Sogawa, K., Satoh, M., Kodera, Y., Yokosuka, O., Tomonaga, T., and Nomura, F. (2012) The application of a three-step serum proteome analysis for the 28
discovery and identification of novel biomarkers of hepatocellular carcinoma. International journal of proteomics 2012, 623190 38. Nanjappa, V., Thomas, J. K., Marimuthu, A., Muthusamy, B., Radhakrishnan, A., Sharma, R., Ahmad Khan, A., Balakrishnan, L., Sahasrabuddhe, N. A., Kumar, S., Jhaveri, B. N., Sheth, K. V., Kumar Khatana, R., Shaw, P. G., Srikanth, S. M., Mathur, P. P., Shankar, S., Nagaraja, D., Christopher, R., Mathivanan, S., Raju, R., Sirdeshmukh, R., Chatterjee, A., Simpson, R. J., Harsha, H. C., Pandey, A., and Prasad, T. S. (2014) Plasma Proteome Database as a resource for proteomics research: 2014 update. Nucleic acids research 42, D959-965 39. Roth, S. Y., Denu, J. M., and Allis, C. D. (2001) Histone acetyltransferases. Annual review of biochemistry 70, 81-120 40. Marmorstein, R., and Roth, S. Y. (2001) Histone acetyltransferases: function, structure, and catalysis. Current opinion in genetics & development 11, 155-161 41. Jaskelioff, M., and Peterson, C. L. (2003) Chromatin and transcription: histones continue to make their marks. Nature cell biology 5, 395-399 42. Han, S. P., Tang, Y. H., and Smith, R. (2010) Functional diversity of the hnRNPs: past, present and perspectives. The Biochemical journal 430, 379-392 43. Nichols, R. C., Wang, X. W., Tang, J., Hamilton, B. J., High, F. A., Herschman, H. R., and Rigby, W. F. (2000) The RGG domain in hnRNP A2 affects subcellular localization. Experimental cell research 256, 522-532 44. Liu, X., Valentine, S. J., Plasencia, M. D., Trimpin, S., Naylor, S., and Clemmer, D. E. (2007) Mapping the human plasma proteome by SCX-LC-IMS-MS. Journal of the American Society for Mass Spectrometry 18, 1249-1264 45. Bassani-Sternberg, M., Barnea, E., Beer, I., Avivi, I., Katz, T., and Admon, A. (2010) Soluble plasma HLA peptidome as a potential source for cancer biomarkers. Proceedings of the National Academy of Sciences of the United States of America 107, 18769-18776 46. Jeong, S. K., Lee, E. Y., Cho, J. Y., Lee, H. J., Jeong, A. S., Cho, S. Y., and Paik, Y. K. (2010) Data management and functional annotation of the Korean reference plasma proteome. Proteomics 10, 1250-1255 47. Rendell, M., Nierenberg, J., Brannan, C., Valentine, J. L., Stephen, P. M., Dodds, S., Mercer, P., Smith, P. K., and Walder, J. (1986) Inhibition of glycation of albumin and hemoglobin by acetylation in vitro and in vivo. The Journal of laboratory and clinical medicine 108, 286-293 48. Sennels, L., Salek, M., Lomas, L., Boschetti, E., Righetti, P. G., and Rappsilber, J. (2007) Proteomic analysis of human blood serum using peptide library beads. Journal of proteome research 6, 4055-4062
29
Figure Legends
Figure 1: General workflow of enrichment of AcK and Rme peptides from cancer patient serum samples. Equal volumes of serum samples (250μL from
each patient) were mixed with 9M urea buffer and reduced, alkylated, digested with trypsin, desalted, lyophilized, and resuspended in MOPS IAP Buffer. Peptides were
incubated with AcK and Rme antibody beads sequentially. Analytical replicates of
enriched peptides were run in LC-MS/MS. Label-free quantification of peptide peak areas in the MS1 channel was performed to identify changes in abundance of AcK and Rme peptides across all samples.
Figure 2: Functional classification of functions of proteins identified by AcK (A) and Rme enrichment (B). The size of each pie represents the number of unique modification sites identified in proteins belonging to each functional group. As most
lysine acetylation sites were identified in serum abundant proteins, secreted proteins including A2M, TF, HPX, HP, C3 and transporter proteins including ALB are
the most enriched functional groups. There were few Rme sites identified in serum
abundant proteins; instead, large numbers of RNA processing proteins and
transcriptional regulators were identified methylated at arginine sites. Protein class
information was retrieved from the PhosphoSite Plus database.
Figure 3: Hierarchical clustering of quantitative data for AcK and Rme enrichments from 12 cancer patients’ sera. (A) Each row in the heat map is a 30
unique, label-free quantified AcK site. A: AML, acute myeloid leukemia; B: BC, breast
cancer; N: NSCLC, non-small cell lung cancer. The relative intensity of the site in each patient’s serum was represented by the log2 ratio of the site intensity in the
individual patient divided by the median site intensity across all 12 patients. The
range of log2 ratios is -14.1 (blue) and +7.8 (red). Patient #4 of NSCLC is an obvious outlier compared to the other three NSCLC patients, and was diagnosed as
squamous cell carcinoma; while NSCLC patients #1, 2, and 3 were diagnosed as adenocarcinoma. (B) Each row in the heat map is a unique, label-free quantified
Rme site. The range of log2 ratios is -8.5 (blue) and +8.5 (red). Individual patients of the same cancer group were clustered together, and Rme sites in NSCLC patients showed a distinct intensity pattern compared to the other two cancer types.
Figure 4: MS/MS spectra and intensity of K155 of Complement Component 3 (A and B) and R1593 of ARID1A (C and D). MS/MS spectra were annotated in
Skyline. Site intensity is represented by the average integrated MS1 peak area of the modified peptide from two analytical replicates.
Figure 5: MS/MS spectra and intensity of K298 of Albumin (A and B). A number
of unique AcK sites showed significantly different intensities in patient #4 of the
NSCLC group (squamous cell carcinoma) compared to patients 1-3 (adenocarcinoma) such as K298 of albumin. The relative abundance of the K298-containing peptide is
significantly higher in the BC group than the AML group, while the total protein abundance of human albumin showed no changes by western blot (C).
31
Figure 1: General workflow of enrichments of AcK and Rme peptides from cancer patient serum samples
Figure 2A: Protein classification of identified proteins with AcK
Protein kinase, Ser/Thr
Ubiquitin conjugating system
Cytoskeletal protein
Transcriptional regulator
Secreted protein Chromatin, DNA-binding, or repair protein
Receptor, channel, transporter or cell surface protein
Figure 2B: Protein classification of identified proteins with Rme
Chromatin, DNA-binding, or repair protein
Cytoskeletal protein
Secreted protein
Receptor, channel, transporter or cell surface protein
Adhesion or extracellular protein
RNA processing Transcriptional regulator
Figure 3A: Hierarchical clustering of AcK data
-14.1
0
7.8
Figure 3B: Hierarchical clustering of Rme data
-8.5
0
8.5
Figure 4: MS/MS spectra and intensity of K155 of Complement Component 3 (C3) and R1593 of ARID1A A
B IFTVHKacLLPVGR +3
3.0E+06
2.0E+06
1.0E+06
0.0E+00 A1
A2
A3
A4
B1
B2
B3
B4
N1
N2
N3
N4
A1
A2
A3
A4
B1
B2
B3
B4
N1
N2
N3
N4
D
C
5.0E+06
PLPRmePMoxiENR +3
4.0E+06 3.0E+06 2.0E+06 1.0E+06 0.0E+00
Figure 5: MS/MS spectra and intensity of K298 of albumin A
B YICENQDSISSKacLK +2
4.0E+06
3.0E+06
2.0E+06
1.0E+06
0.0E+00 A1 A2 A3 A4 B1 B2 B3 B4 N1 N2 N3 N4
C A1 A2 A3 A4 B1 B2 B3 B4 N1 N2 N3 N4 80kD 58kD
46kD