Citation: Gibbs M.S., Dandy G.C., Maier H.R. and Nixon J.B. (2005) Selection of genetic algorithm parameters for water distribution system optimisation. World Water & Environmental Resource Congress, ASCE, Anchorage, Alaska, USA, May 15-19.
Selection of Genetic Algorithm Parameters for Water Distribution System Optimization Matthew S. Gibbs1, Graeme C. Dandy1, Holger R. Maier1 and John B. Nixon2 1
Centre for Applied Modelling in Water Engineering, School of Civil and Environmental Engineering, University of Adelaide, North Terrace, Adelaide SA 5005, Australia; PH +618 8303 6319; FAX: +618 8303 4359; email:
[email protected] 2 United Water International Pty Ltd, GPO Box 1875, Adelaide SA 5001, Australia; PH: +6 8 8301 2834; FAX: +618 8357 9728; email:
[email protected] Abstract The ability of Genetic Algorithm (GA) methods, to find near optimal solutions to Water Distribution System (WDS) optimization problems has been widely demonstrated. However, one of the main concerns in applying these methods is identifying suitable values for the GA parameters. The values selected for these parameters have a significant impact on the algorithm’s behavior, and therefore greatly affect the quality of the final solution found, as well as the time taken to find that solution. A considerable amount of time and effort must be dedicated to the calibration of these parameters for the GA practitioner to have any confidence that the values used are producing the desired results. The impact of each parameter will be dependent on the values of the other parameters, and it is likely that there exists different combinations that will produce the same exploration/exploitation behavior. This offers the potential to reduce the number of parameters requiring calibration, thus making the task of applying these methods much simpler. This paper describes large-scale sensitivity analyses that have been used to calibrate a real coded GA with a distributed crossover operator, for a WDS optimization problem, the Cherry Hill–Brushy Plains network, ultimately leading to the identification of a new optimal solution. Through these analyses, groups of parameter values are identified that cause the algorithm to perform very well in terms of algorithm convergence and the quality of the final solutions obtained. These results demonstrate that by understanding the parameters controlling the GA, and the relationships between them, the effort required to calibrate a GA for a given application can be reduced significantly. Introduction The management of Water Distribution Systems (WDS) involves making decisions about a number of operations in the network, such as the scheduling of pump operations or setting of disinfectant dosing rates. There are often conflicting objectives in making these decisions, such as minimizing costs while maximizing the quality of the
1
water supplied. Hence, the operation of WDSs can be very difficult, and there is generally considerable scope to improve the efficiency of these systems. Since the first application of Genetic Algorithms (GAs) to WDS optimization problems (Simpson et al. 1994) this optimization method has displayed great success in a range of design and operational problems (Al-Zahrani and Moied, 2003; Munavalli and Kumar, 2003; Ostfeld and Salomons, 2004; Prasad et al., 2004; Tolson et al., 2004; and Van Zyl et al., 2004). While GAs have been successfully applied to a vast array of problems, the best set of parameters to control the behavior of the algorithm is difficult to determine, and is highly dependent on the objective function considered. A poorly selected set of parameter values may lead the GA to prematurely converge to sub-optimal solutions, or direct it to search the fitness function almost randomly, without making maximum use of current knowledge to find better solutions. The best GA parameter set to use is a function of the difficulty of the problem. A difficult problem is generally solved more effectively with increased exploration by the algorithm, such as would be engendered by choosing a larger population size or higher mutation rate, where a simpler problem may be solved more efficiently with parameters that provide greater exploitation of known solutions, avoiding excessive exploration of the search space. Generally, these parameters are set using a trial and error approach but, due to the large range of possible values and the interactions between the algorithm operators, it is highly unlikely that a sensitivity analysis performed in reasonable time will come close to finding the best parameter set for a given problem. There have been a number of attempts to assist the GA practitioner in the calibration process, including population sizing rules (Harik et al. 1999), fitness landscape analysis (Davidor 1991; Jones and Forrest 1995; Gibbs et al. 2004), parameter adaptation (Eiben et al. 1999), and methods that remove the parameter setting problem from the user (Lobo and Goldberg 2004). However, in applying these methods to real problems, such as WDS optimization problems, there are a number of issues that must be overcome, for example the need to estimate unknown parameters (i.e. building block size for population sizing, as per Harik et al. (1999)) or the use of a simplified version of the GA (e.g. the parameter-less GA of Lobo and Goldberg (2004) does not include a mutation or elitist operator). If the impact of different GA parameters on the algorithm behavior can be understood, it will provide a greater likelihood that they will be set correctly for a given optimization problem. For example, an increase in one parameter value and a decrease in another may produce the same behavior from the algorithm. If these interactions can be taken into account the potential exists to both significantly decrease the time and effort required to calibrate a GA, and to increase confidence that the GA is finding nearoptimal solutions to a given problem. The aim of this paper is to investigate these interactions, with a specific focus on the application to a WDS optimization problem. In the next section the details of the GA used and the sensitivity analyses performed are outlined, then the WDS optimization problem that it has been applied to is described.
2
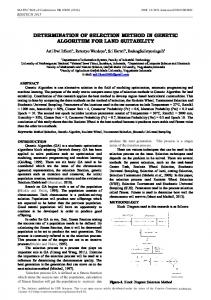
The results from the optimization and the behavioral analysis of the algorithm are then presented, followed by the conclusions. The Algorithm The GA used for this research implemented tournament selection with a tournament size of two, string-wise uniform mutation, and inclusion of a number of elitist solutions per generation. The decision variables are represented by a real coded string, due to the decision variables being real valued themselves, and the convergence criterion used was to run for 100,000 fitness function calls, providing sufficient time for the GA to converge on a solution. As the decision variables are real coded, one-point distributed crossover was used, where the new value for a decision variable was generated from a normal distribution, centered around one of the parent solution values, p1 or p2, as seen in Figure 1. This operator is similar to the Simulated Binary Crossover operator developed by Deb and Agrawal (1995) and the Fuzzy Recombination crossover operator developed by Voigt et al. (1995), and has been adopted as neighborhood-based crossover operators such as these have been found to exploit the numerical nature of real coded GAs (Herrera et al. 2003). The five parameters that must be selected are thus the population size, probability of crossover, probability of mutation, and the number of elite solutions. The width of the distribution to be used for crossover must also be selected, and this was taken as the number of standard deviations between the parent solutions, σ, where the tighter the value of σ, the tighter distribution around the parent solutions, and therefore greater exploitation of current solutions. The parameter values considered for the sensitivity analysis can be seen in Table 1. Every combination of the five parameters was repeated five times with different random starting positions in objective function space in an attempt to remove the effect of the random nature of the solutions in the initial population on the final solutions found. This resulted in a total of 1,890 separate optimization runs.
Probability
σ
p1
p2
Decision Variable Value
Figure 1: Distributed Crossover Probability Used
3
Table 1: Sensitivity Analysis Parameter Values Parameter Values Population Size, n 10, 25, 50, 100, 200, 400, 800 String-wise Probability of Mutation, pm 0.1, 0.2, 0.3 Probability of Crossover, pc 0.7, 0.85, 1 Distribution of Crossover, σ 6, 18 Number of Elite Solutions/Generation, e 0, 1, 2 Case Study The Cherry Hill–Brushy Plains portion of the South Central Connecticut Regional Water Authority network has been considered in this research. This network has been used to validate and test different water quality models and has been optimized by a number of methods, including linear programming (Boccelli et al. 1998), a linear least-squares formulation (Propato and Uber 2004) and a GA (Munavalli and Kumar 2003). The network layout is shown in Figure 2, and the network data are those used by Boccelli et al. (1998). The first-order bulk decay kinetics assumption required for the linear methods has been retained to allow a direct comparison of the performance of the different optimization methods, however this assumption is not required for the GA formulation, and more complex kinetics, such as both bulk and wall decay, could be just as easily implemented. The optimization problem is to minimize the mass of chlorine added to the system over a 24 hour cycle, with the constraint of maintaining the concentrations in the network in the acceptable range of 0.2–4.0 mg/L. The decision variables are the chlorine mass injection rates at the six booster stations (nodes A–F), for four six-hour periods over a day, producing a total of 24 decision variables. A penalty of 100 (mg/L)-1 multiplied by the difference between the actual and a required chlorine concentration was applied at any violating nodes at each time step. Figure 2: Network Schematic
4
Optimization Results The best result found by the Genetic algorithm used in this research (GA2) is listed in Table 2, along with previous solutions for this problem, the linear programming (LP), linear-least squares (LLS) and previous Genetic Algorithm (GA1) solutions. The LP and LLS solutions are taken from Propato and Uber (2004), as the Boccelli et al. (1998) solution was found using a previous version of EPANET, and is infeasible if evaluated with the most recent version (v. 2.00.10). The objective of Propato and Uber (2004) was slightly different, i.e. to minimize the deviation of the chlorine concentration at each node from the minimum of 0.2 mg/L, compared to minimizing the total mass of chlorine used here, although it is expected that both approaches will produce the same goal of minimizing the total mass of chlorine added to the system. It can be seen that the GA solution presented produces the lowest mass of chlorine to be added to the system, without requiring a special formulation for the chlorine decay kinetics or network behavior. This is most likely due to the advanced operators adopted for the GA, as well
Booste r Period 1
2
3
4
Total Mass (g/day)
Table 2: Optimization Results (Booster Doses in mg/min) Booster Location Optimization Algorithm A B C D E LPa LLSa GA1b GA2c LPa LLSa GA1b GA2c LPa LLSa GA1b GA2c LPa LLSa GA1b GA2c LPa LLSa GA1b GA2c
589.0 1,442.0 599.3 753.3 0.0 0.0 0.0 0.0 636.0 971.0 680.9 682.1 0.0 0.0 0.0 0.0 1,176 1,587 1,205 1,166
7.9 10.2 9.8 5.5 0.0 4.7 0.7 1.2 4.9 11.0 4.3 2.5 0.4 4.0 0.0 0.0
419.0 0.0 473.6 276.0 0.0 6.7 0.0 0.4 454.0 136.0 413.0 376.7 0.0 0.0 0.3 0.0
0.1 3.8 0.7 0.3 0.2 2.2 0.3 0.5 0.0 2.8 0.0 0.2 0.8 1.6 0.7 0.5
0.1 2.9 0.4 0.4 0.6 2.1 0.4 2.0 0.1 1.9 0.3 0.4 1.4 1.4 1.0 1.5
F 0.0 1211.0 0.0 0.3 727.0 204.0 713.5 707.3 8.0 150.0 47.1 48.1 409.0 223.0 400.7 379.6
a
Results taken from Propato and Uber (2004)
b
Results taken from Munavalli and Kumar (2004) Results for the GA presented
c
5
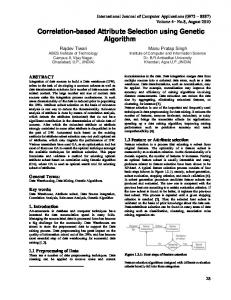
as the use of near optimal parameter settings, found through the extensive sensitivity analyses, to control these operators. Behavioral Analysis Results, for 18 Best Performing Parameter Sets The average solution found from the five GA runs for each of the 378 parameter combinations ranged from 1184 – 1339 g/day, indicating the GA is quite sensitive to the parameter values that are used. These average solution values were compared, and the best combinations of parameters with no significant difference between the solutions using a Student’s t-test with a 95% confidence level were selected, resulting in a total of 18 optimal parameter sets being identified. On close inspection a number of very useful relationships can be identified between the parameter values, as shown in Figure 3.
a) Population Size vs. Probability of Mutation
b) Probability of Mutation vs. Distribution of Crossover
c) Number of Elite Solutions vs. Distribution of Crossover
d) Population Size vs. Probability of Crossover
Figure 3: Behavioral Analysis Results, for 18 Best Performing Parameter Sets
6
Figure 3 a) suggests there is a direct relationship between the probability of mutation and population size in the parameter sets that lead to the best solutions. A combination of the lowest probability of mutation considered (pm = 0.1) and one of the larger population sizes (n = 100, 200 or 400) find the best solution on average, where for the highest probability of mutation (pm = 0.3) only the smaller population sizes are effective (n = 25, 50, and 100). Schaffer et al. (1989) also observed this inverse relationship between population size and mutation rate in their empirical study of 10 mathematical test functions. This result can be explained, as an increase in the population size will result in a greater amount of unique genetic material being stored in the population to generate more diverse solutions, while at the same time a decrease in the probability of mutation will result in fewer random solutions being generated, producing a similar result as for a smaller population size and higher mutation rate. Figure 3 b) indicates a decrease in the probability of mutation for the algorithm can be compensated for with an increase in the width of the distribution used for crossover, as the wider distribution ( = 6) performs best with a lower probability of mutation (pm = 0.1 or 0.2), and the tighter distribution ( = 18) only finds the best solutions on average with a high probability of mutation (pm = 0.3). A wider distribution for the crossover operator will produce children for the next generation further away in the search space from the parents and, similarly, an increase in the probability of mutation will produce more random solutions in the population, most likely in regions of the search space away from the parent solutions they were mutatated from. The results shown in Figure 3 b) thus suggest that there is a trade-off between these two parameters, all leading to the required search behavior that finds the best solutions for this problem. Figure 3 c) implies that more elitism is required with a wider distribution of crossover. The distribution used for crossover is an exploration parameter, as fewer standard deviations between the parents will produce thicker tails in the distribution to generate the children, resulting in more solutions further away from the parents and thus further exploration of the search space. Hence, to preserve the good solutions that have been found so far in the optimization process, one or two elite solutions are required to reinforce these previously identified solutions in the population. Figures 3 b) and c) indicate that, for this problem, the wider distribution ( = 6) was more effective overall, as it was selected more frequently in the best performing parameter sets. Figure 3 d) illustrates that the lowest probability of crossover considered, pc = 0.7, generally finds the best solutions in conjunction with smaller population size, as, on average, there will always be a few solutions in the population that are undisturbed by the crossover operator applied with a low probability and these will persist in the next generation. The higher crossover rate of 0.85 can be seen to find the best solutions with the larger population sizes, where there will still be some solutions progressing unaltered to the next generation, which might not be the case with smaller
7
population sizes under the increased crossover probability. However, the elitism operator can be used to ensure good solutions are preserved every generation, and Figure 3 d) suggests that a probability of crossover of 1 performs well over the whole range of population sizes considered, provided elitism is in place to preserve good solutions. This is a logical result, as it will be most efficient to generate as many new solutions as possible each generation, provided previous knowledge is not lost in the process and the algorithm is not forced into one area of the search space prematurely. These results suggest that in order to obtain the best solutions to an optimization problem using an evolutionary algorithm, such as a GA, there is an optimal algorithm behavior, and this can be achieved through a number of different algorithm parameter combinations. Taking these relationships into account has the potential to reduce significantly the effort required in the calibration of GAs for a given optimization problem, thereby increasing confidence that the algorithm is finding the best possible solutions. Also, if the required algorithm exploration/exploitation behavior for a given optimization problem can be estimated a priori, an understanding of the effect and interaction between GA parameters can provide very useful starting points for the parameter values. Another finding from the sensitivity analysis performed is that the best set of parameters to use for an optimization problem are related to the number of objective function calls the algorithm is permitted to make. When more function calls are allowed, there is more time for greater exploration of the search space, and therefore a greater chance of finding a better final solution, provided the algorithm is given enough time to converge on a population of near optimal solutions. This can be seen in Figure 4 showing the best solution found by the population against the number of function calls made, and the best GA parameters for the different convergence criteria listed in Table 3, but from an experiment in which the GA was allowed to continue for a total of 100,000 function calls in each case. From these results it can be seen that a high level of exploitation, as indicated by the small population size of 10, performs best if only 10,000 function calls are permitted. However, if these parameters were used for the full 100,000 function calls the GA converges prematurely to a poor solution relative to those obtained using parameter sets optimized for larger numbers of function calls. From Table 3: Best Parameter Sets for Different Convergence Criteria Average Function Probability Probability Number of Calls Population of of Elite Distribution Total Mass (g/day) Size Mutation Crossover Solutions Width ( 103) 10 10 0.3 1 1 6 1,269 25 50 0.3 1 2 6 1,214 50 200 0.1 1 2 6 1,190 100 200 0.2 0.7 2 6 1,184
8
Table 3, the optimal population size can be seen to increase with increasing function calls allowed, up to the best parameter set for 100,000 function calls. Here a population size of 200 was found to perform the best, as well as a higher mutation rate compared with the best parameter set for 50,000 function calls. Similarly, Figure 4 indicates that if the GA using this parameter set had been stopped after only 10,000 of the maximum 100,000 allowed function calls it would produce a very poor solution, as the algorithm would at that stage still be focusing on exploring the search space, rather than exploiting the characteristics of the solutions so far identified and fine tuning the good solutions that have been found. A similar relationship between population size, convergence time and solution quality was observed by De Jong (1975) in his work that identified the “standard” GA parameter settings (n = 50 – 100, pc = 0.6, bit wise pm = 0.001). It is apparent from the above that it is not only the problem difficulty that will affect the choice of which are the best GA parameters to use, but also the amount of time the algorithm is allowed to attempt to converge towards a population of near optimal solutions. Generally, a GA will find better solutions with parameters that provide greater exploration of the search space, provided the time required to converge towards good
Figure 4: Best Solution Found for Different Convergence Criteria
9
solutions is made available. However, it can be seen from Table 3 and Figure 4 that the solution found after 100,000 function calls is only 0.5% better than the solution found after half that number of function calls, and the extra run time needed to converge on this solution may, in many cases, not be considered worthwhile. If the desired run time is known, the GA behavior may be controlled during execution, by altering the parameters to increase the exploration of the search space if the algorithm is converging too quickly, or to increase the exploitation of known solutions if the population is still quite diverse when the algorithm is coming close to the end of the pre-specified run time. Conclusions The ability of Genetic Algorithms (GAs) to find the best-known solution to a Water Distribution System (WDS) optimization problem has been reinforced in this paper, where a real coded GA with a distributed crossover operator was applied to the Cherry Hill–Brushy Plains network and a new best-known solution has been identified. However, the final solution quality was found to be very sensitive to the parameter values used to control the GA. After performing large-scale sensitivity analyses to calibrate the GA for the optimization problem considered, groups of parameter values that result in the algorithm finding the best-known solution were identified. A number of useful relationships between these parameter values were determined, providing strong evidence that there is the potential to reduce the number of parameters requiring calibration, thus making the task of applying GAs, and possibly other evolutionary optimization methods, much simpler. Also, the number of objective function calls the GA was permitted to make was found to have a large impact on the optimal parameters. Furthermore, the trade off between solution quality and run time should be considered when calibrating a GA for a given problem. Work under investigation includes exploring the potential, identified in this paper, to reduce the number of parameters that need to be chosen by the GA practitioner, by setting some values and automatically calibrating the others in such a manner as to achieve the optimal algorithm behavior. An example of this may be to set the probability of mutation, then tune the distribution of crossover for each application, so as to engender algorithm convergence to good quality solutions within a desired run time. The application of dynamic parameters values is also under consideration, allowing the algorithm to be tuned during the optimization run to produce the desired results, and thus reducing the effect of the initial parameter values used on producing the best possible solutions to an optimization problem.
10
References Al-Zahrani, M. A., and Moied, K. (2003). "Optimizing water quality monitoring stations using genetic algorithms." Arabian Journal for Science and Engineering, 28(1B), 57-75. Boccelli, D. L., Tryby, M. E., Uber, J. G., Rossman, L. A., Zierolf, M. L., and Polycarpou, M. M. (1998). "Optimal scheduling of booster disinfection in water distribution systems." Journal of Water Resources Planning and ManagementASCE, 124(2), 99-111. Davidor, Y. (1991). "Epistasis variance: A viewpoint on GA-Hardness." Foundations of Genetic Algorithms, G. J. E. Rawlins, ed., Morgan Kaufmann, 23-35. De Jong, K. A. (1975). "An analysis of the behaviour of a class of genetic adaptive systems," PhD Thesis, University of Michigan. Deb, K., and Agrawal, R. B. (1995). "Simulated binary crossover for continuous search space." Complex Systems, 9, 115-148. Eiben, A. E., Hinterding, R., and Michalewicz, Z. (1999). "Parameter control in evolutionary algorithms." IEEE Transactions on Evolutionary Computation, 3(2), 124-141. Gibbs, M. S., Maier, H. R., and Dandy, G. C. (2004). "Applying temporal and spatial autocorrelations to measure fitness landscapes." Sixth International Conference on Hydroinformatics, Singapore, 795-802. Harik, G., Cantú-Paz, E., Goldberg, D. E., and Miller, B. L. (1999). "The gambler's ruin problem, genetic algorithms, and the sizing of populations." Evolutionary Computation, 7(3), 231-253. Herrera, F., Lozano, M., and Sanchez, A. M. (2003). "A taxonomy for the crossover operator for real-coded genetic algorithms: An experimental study." International Journal of Intelligent Systems, 18(3), 309-338. Jones, T., and Forrest, S. (1995). "Fitness distance correlation as a measure of problem difficulty for genetic algorithms." Proceedings of the Sixth International Conference on Genetic Algorithms, San Francisco, CA, 184-192. Lobo, F. G., and Goldberg, D. E. (2004). "The parameter-less genetic algorithm in practice." Information Sciences, 167(1-4), 217-232. Munavalli, G. R., and Kumar, M. S. M. (2003). "Optimal scheduling of multiple chlorine sources in water distribution systems." Journal of Water Resources Planning and Management-ASCE, 129(6), 493-504. Ostfeld, A., and Salomons, E. (2004). "Optimal operation of multiquality water distribution systems: Unsteady conditions." Engineering Optimization, 36(3), 337-359. Prasad, T. D., Walters, G. A., and Savic, D. A. (2004). "Booster disinfection of water supply networks: Multiobjective approach." Journal of Water Resources Planning and Management-ASCE, 130(5), 367-376.
11
Propato, M., and Uber, J. G. (2004). "Linear least-squares formulation for operation of booster disinfection systems." Journal of Water Resources Planning and Management-ASCE, 130(1), 53-62. Schaffer, J. D., Caruana, R. A., Eshelman, L. J., and Das, R. (1989). "A study of control parameters affecting online performance of genetic algorithms for function optimization." Proceedings of the third international conference on Genetic algorithms, George Mason University, United States, 51-60. Simpson, A. R., Dandy, G. C., and Murphy, L. J. (1994). "Genetic Algorithms compared to other techniques for pipe optimization." Journal of Water Resources Planning and Management, 120(4), 423-443. Tolson, B. A., Maier, H. R., Simpson, A. R., and Lence, B. J. (2004). "Genetic algorithms for reliability-based optimization of water distribution systems." Journal of Water Resources Planning and Management-ASCE, 130(1), 63-72. Van Zyl, J. E., Savic, D. A., and Walters, G. A. (2004). "Operational optimization of water distribution systems using a hybrid genetic algorithm." Journal of Water Resources Planning and Management-ASCE, 130(2), 160-170. Voigt, H.-M., Mühlenbein, H., and Cvetkovic, D. (1995). "Fuzzy Recombination for the Breeder Genetic Algorithm." Proceedings of the 6th International Conference on Genetic Algorithms, 104-113.
12