http://bioinformatics.burnham-inst.org. Protein function assignments based on postulated homology as recognized by high sequence similarity are used routinely ...
Pacific Symposium on Biocomputing 5:42-53 (2000)
SENSITIVE SEQUENCE COM PARISON AS PROTEIN FUNCTION PREDICTOR .��3$:à2:6.,��à��-$526=(:6., The Burnham Institute, 10901 N. Torrey Pines Rd., La Jolla, CA 92037, USA L. R Y C H LE WS K I * San Diego Supercomputing Center, La Jolla, CA 92037, USA A. GO D Z I K . The Burnham Institute, 10901 N. Torrey Pines Rd., La Jolla, CA 92037, USA http://bioinformatics.burnham-inst.org Protein function assignments based on postulated homology as recognized by high sequence similarity are used routinely in genome analysis. Improvements in sensitivity of sequence comparison algorithms got to the point, that proteins with previously undetectable sequence similarity, such as for instance 10-15% of identical residues, sometimes can be classified as similar. What is the relation between such proteins? Is it possible that they are homologous? What is the practical significance of detecting such similarities? A simplified analysis of the relation between sequence similarity and function similarity is presented here for the wellcharacterized proteins from the E. coli genome. Using a simple measure of functional similarity based on E.C. classification of enzymes, it is shown that it correlates well with sequence similarity measured by statistical significance of the alignment score. Proteins, similar by this standard, even in cases of low sequence identity, have a much larger chance of having similar function than the randomly chosen protein pairs. Interesting exceptions to these rules are discussed.
1 Introduction Super-sensitive sequence comparison algorithms, such as PSI-BLAST 1, , BLOCKS 2, Hidden Markov Models 3 or BASIC 4 29, can routinely recognize similarities between sequences of proteins that most biologists wouldn’t easily call homologous. These and other similar algorithms define specific scoring systems for evaluating alignments between two protein sequences, and describe the similarity between two proteins as a statistical significance of their alignment score. With such tools, some protein pairs or groups are classified as similar, even when the more straightforward measures of protein sequence similarity, such as the percentage of identical residues in the alignment, appear random. Algorithms from this group aim at detecting the similarity between weak sequence patterns, so at least , by design, they try to recognize distantly related proteins. Other algorithms 5 6 *
present address: International Institute of Molecular and Cell Biology ul. Ks. Trojdena 4, 02-109 Warszawa, Poland
1
Pacific Symposium on Biocomputing 5:42-53 (2000)
specifically aim at recognizing possible fold similarity disregarding question of , sequence similarity. Yet another group of programs mixes both approaches 7 8. It is not clear what the relation is between proteins that are seen as similar by such algorithms but fail the more standard tests of sequence similarity. It is generally accepted that proteins with high sequence similarity are homologous. In fact, these two very different notions are often treated as virtual synonyms. However, many proteins, whose similarity is recognized with more sensitive alignment programs or threading algorithms, challenge this relation. Are proteins like collicins and globins 9, tenascin and immunoglobulin 10, and many other pairs and groups of proteins with similar folds but no apparent sequence similarity, distantly related, with evolutionary distance so large that any traces of sequence identity was lost, or do they represent examples of convergent structural evolution? This question is gaining significance, as threading and sensitive sequence comparison algorithms often provide first annotations for newly sequenced proteins. Unfortunately, this question is not easy to answer, and conflicting arguments are often made in similar cases and often remain a matter of taste 11. Leaving aside the fundamental aspect of this question, there is also a very important pragmatic side to it. Many newly sequenced proteins are being tentatively annotated as being similar to already known and well-characterized protein , , families 4 7 12 and there is a very practical question: what is the importance of finding such relations between two proteins? Does it help to predict a function of the new protein if no experimentally determined function is known? High sequence similarity, synonymous with close homology was used for a long time to annotate new sequences. Can this approach be used when “twilight zone” (and beyond) sequence similarity is found? In many examples presented in the literature there are proteins recognized as similar by the new algorithms with less then 15% of identical resides. What is the chance that such similarity could be used for function prediction? To answer these questions, we compared in a very simplified manner the functions of proteins from the E. coli genome that are seen as being similar by , BASIC 4 29 algorithm. Very similar results could be obtained with other supersensitive sequence comparison algorithms, such as PSI-BLAST or BLOCKS. It should be stressed that we did not try to use protein function to test the accuracy of a sequence comparison method. Function similarity is not a very rigorously defined concept and it would be difficult to use it for calibrating sequence comparison , methods in a manner analogous to structure similarity 13 14.
2. Materials and methods
2
Pacific Symposium on Biocomputing 5:42-53 (2000)
2. 1. Sequence comparison algorithm. BASIC is a profile-profile alignment program, described previously 4 15. The basic idea of the algorithm is in the spirit of early profile searches 16, but here two proteins are compared by calculating the local alignment between two sequence profiles representing both proteins and their respective homologues. The significance of sequence similarity between two proteins is described as the alignment score rescaled by the standard deviation of the distribution of scores for , the entire sequence database 4 15. Later in the text we call this rescaled score the Zscore, but we don’t make any assumptions about the score distribution being Gaussian, in fact such rescaling can be done for any distribution with a non-zero standard deviation. Assuming a specific distribution of scores, it is possible to recalculate Z-scores to E-values (as used by PSI-BLAST assuming the extreme value distribution) or p-values (as used by BLAST under the same assumption). BASIC was validated by calculating sequence similarity (as measured by it’s Zscore) of proteins with similar structures (as measured by structure comparison programs) but no obvious sequence similarity. On several sets of proteins 4, including a new set of 929 protein pairs 29 it was shown that the highest Z-score obtained for a pair of proteins with markedly different structures (different structural classifications in several different structural classifications) was less than 7.0. Examples of high scoring false positives 17 could be traced to proteins with a small number of homologous proteins contributing to the profile. New procedure for profile calculation 29 eliminated these problems, therefore, here we use a Z-score threshold of 7, to define proteins as being similar. We stress again that while this level of sequence similarity was verified to correspond to structural similarity, evolutionary relationships between such “similar” proteins remain unclear. ,
2. 2. Protein functional classification The E.C. enzyme classification 18 was developed for enzymes and describes the chemical reaction catalyzed by the given enzyme. A hierarchical, four level classification denoted by four numbers, e.g. 1.4.2.29, characterizes every enzyme. The first number corresponds to one of six general categories of chemical reactions. The subsequent three numbers correspond to subcategories describing the type of chemical reaction in increasing detail. E. coli offers an ideal system for an analysis, such as described here, because a substantial fraction of the proteins from this genome were characterized experimentally. The remaining part was classified based on close homologies to experimentally characterized proteins from other organisms. 2. 3 Protein functional similarity. 3
Pacific Symposium on Biocomputing 5:42-53 (2000)
Within each family of proteins with similar sequences, as identified by the BASIC Z-score (see above), functional similarity between proteins was expressed as the number of common roots shared by their functional classification. For example, two proteins having E.C. numbers 1.2.3.4 and 1.2.5.4 would have functional similarity (called here E.C. overlap) equal to 2. In case of proteins with incomplete E.C. classification, only the assigned part of the classification was considered. For example, two proteins having E.C. numbers 1.2.3.- would have E.C. overlap equal to 3. The functional similarity defined this way can assume values from 0 to 4. 2. 4. Protein sequence database and comparison procedure The sequences of E. coli proteins were downloaded from the NCBI site (http://www.ncbi.nlm.nih.gov/Entrez/). The E.C. classification for E. coli enzymes was extracted from the SwissProt database 19 (http://www.expasy.ch/sprot/) and cross-checked against the EcoCyc database 20. To simplify the analysis and avoid possible errors, proteins that were assigned more than one classification (e.g. multidomain proteins involved in different functions) were excluded from the analysis. Thus 904 proteins from the E. coli genome with E.C. classification remained for analysis. A subset of a previous BASIC all-by-all comparison of proteins from the E. coli genome was used 21. For each of the 904 E. coli proteins, the protein with the best Z-score and having an E.C. classification was identified in the list of similar proteins identified by the BASIC program. The all-by-all comparison was then projected onto the group of E. coli genome proteins with E.C. classification, i.e. only proteins with E.C. classification were retained. Thus 904 protein pairs were obtained.
3. Results
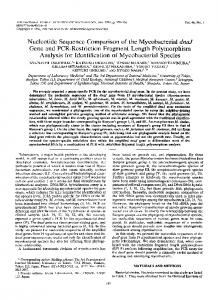
3. 1. Sequence similarity versus functional similarity The relation between protein sequence similarity as measured by Z-score of their alignments versus function similarity, as measured by the E.C. overlap, is shown as series of histograms in Figure 1. The most obvious observation is that the percentage of proteins with high degree of function similarity grows monotonically with increasing significance of sequence similarity. These figures can be used to provide a very rough estimate of probability that two proteins with a given degree of sequence similarity have similar functions. For instance, if protein A is predicted to be similar to protein B with the Z-score between 50 and 100, then there is a 22 % 4
percentage of pairs with given level of functional similarity
Pacific Symposium on Biocomputing 5:42-53 (2000)
100%
80%
60%
40%
20%
0% 0-5
5-7
7-10
10-20
20-30
30-50
50-100
100-
Z-score 0 E.C. overlap
1
2
3
4
percentage of pairs with given level of functional similarity
Figure 1. Relative numbers of functionally similar protein pairs for different levels of sequence similarity. Function similarity is expressed as E.C. overlap (see text) and sequence similarity is expressed as BASIC Z-score. For each of the E. coli proteins with E.C. classification, the most similar protein was identified with the BASIC algorithm (see text for details). For the indicated Z-score intervals, percentages of pairs with different levels of function similarity are shown. 100%
80%
60%
40%
20%
0% random pairs
0-5
5-7
7-10
10-20
20-30
30-50
50-100
100-
Z-score
0 E.C. overlap
1
2
3
4
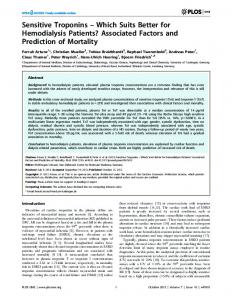
Figure 2. Relative numbers of functionally similar protein pairs for different levels of sequence similarity for pairs of low sequence identity: The notations are as in Figure 1, but the analysis is restricted to 651 pairs with less than 25% sequence identity. The first bar shows function similarity distribution for corresponding to 408156 random pairs (see text).
probability that proteins A and B have identical functions as described by the E.C. numbers, and only 9% probability that their functions will be completely different 5
Pacific Symposium on Biocomputing 5:42-53 (2000)
(see Fig. 1). This should be compared to 1% and 79%, respectively, for a randomly chosen protein pair (the leftmost bar in the histogram in Figure 1). Traditionally, the threshold of 25% of identical resides was used to define the “twilight zone” of sequence similarity, where homology between proteins is no longer certain. It is worth noting that a very similar picture to that in Figure 1 is obtained when the data set is restricted to protein pairs in this region and below (see Fig. 2). This observation has a very important practical meaning. The threshold of 25 % sequence identity is usually regarded as the limit of easy and unambiguous homology detection. It is very encouraging, that even below this threshold, the sequence similarity can be recognized and function similarity can be predicted with above random probability.
number of pairs with given level of functional similarity
400 350 300 250 200 150 100 50 0 0-10
10-15
15-20
20-25
25-30
30-35
35-40
40-100
sequence identity [%] 0 E.C. overlap
1
2
3
4
Figure 3. Absolute numbers of functionally similar protein pairs for different levels of sequence similarity (expressed as sequence identity). The relation between function and sequence similarity: function similarity is expressed as E.C. overlap (see text) and sequence similarity is expressed as percentage of identical residues in the Smith-Waterman alignment. For each of the E. coli proteins with E.C. classification, the most similar protein was identified with the Smith-Waterman alignment algorithm, using percentage of sequence identity as a similarity measure (see text for details). For the indicated sequence identity intervals, the absolute number of pairs with different levels of function similarity are shown.
3.2. The advantages of using significance measure compared to sequence identity.
6
Pacific Symposium on Biocomputing 5:42-53 (2000)
number of pairs with given level of functional similarity
250
200
150
100
50
0 0-5
5-7
7-10
10-20
20-30
30-50
50-100
100-
Z-score 0 E.C. overlap
1
2
3
4
Figure 4. Absolute numbers of functionally similar protein pairs for different levels of sequence similarity (expressed as Z-score). Data from Figure 1 presented in a way analogous to Figure 3.
Using statistical significance measures such as Z-score or E-value requires calculation of an entire distribution of scores for the whole protein database. It would be more intuitive to use another measure of sequence similarity to evaluate the similarity of two proteins, such as for instance, the widely used percentage sequence identity. For comparison, the entire analysis as described above was repeated using a simple Smith-Waterman alignment between two sequences and using the percentage of identical residues as a measure of similarity. The Blosum62 substitution matrix was used 22. The results of this, as well as the previous analysis are presented in Figures 3 and 4. Figure 4 repeats the same data as shown earlier in Figure 1, but formatted to easily compare to Figure 3. This time, the histograms are scaled to provide the absolute numbers of proteins in different similarity regions. There are several important differences between the results obtained with identity percentage and the Z-score as sequence similarity measure, as seen from the comparison of Figures 3 and 4, respectively. First, the Z-score based algorithm recognizes much more similarities between proteins that the % identity based similarity measure. For the set of 904 proteins used here there are only 300 pairs of proteins with a percentage of sequence identity larger than 25%, versus 664 pairs with a Z-score larger than 7. As seen in Figure 3, most of the proteins fall into the 20-25% similarity range. As shown in an independent test, in this range about 50% of all proteins have different folds. Therefore, using a measure of protein sequence similarity based on % of identical residues (Figure 3) would lead to the conclusion that only 30% of all proteins with E.C. classification in E. coli genome have other similar proteins in the same genome and a majority does not have any similar proteins. In contrast, using Z-score based similarity criterion (Figure 4) suggests that most of the proteins in our set have at least one similar protein, at least in the sense of having similar structure. 7
Pacific Symposium on Biocomputing 5:42-53 (2000)
The second difference is even more interesting. The relation between sequence similarity expressed as percentage of identical residues and functional similarity shows a “phase transition”, with a percentage of proteins with some level of function similarity going from 95% for proteins with sequence identity above 30% to 50% for protein with 25-30% sequence identity to 25% for proteins with lower sequence identity. These could create an impression of the qualitative difference between homologous proteins with very similar functions and all other, unrelated, proteins with very little function similarity. Using alignment score significance as a measure of proteins similarity presents a very different picture. According to this picture, in families of sequentially similar proteins function diverges slowly with decreasing sequence similarity. The divergence is gradual, with general similarities (such as described by lower values of E.C. overlap) persisting for much longer than exact functional identities, such as described by identical E.C. classifications. Even at the below-threshold similarity level of Z-score between 5 and 7, the percentage of functionally unrelated proteins (E.C. overlap equal to 0) is only 51%, significantly lower than the random level of 79% (see Figure 1 and 2). The superiority of the statistical measure of sequence similarity is most obvious for the low sequence similarity region, where sequence identity produces much more false positives in function “prediction” (see Fig 3). For the 20-25% sequence identity range, which contains almost half of all protein pairs, 66% of the protein pairs have no function similarity (E.C. overlap 0). The “just below threshold” similarities as seen by Z-score similarity measure, show similar number of proteins with different functions, but this group constitutes only 8% of all protein pairs. 3. 3. Dissimilar sequences, similar functions Two regions in Figures 1-2 are particularly interesting and will be briefly discussed below. There are protein pairs with high Z-score and no functional similarity, and on the opposite end of the histogram, there are pairs with low Z-score and substantial functional similarity. The first group (e.g. 6% of pairs with Z-score below 5 have E.C. overlap 3) was recently discussed in detail by Koonin and co-workers 23. It was described as consisting of groups of enzymes "invented" independently and groups that have undergone divergent evolution diluting any traces of common ancestry beyond recognition, except for similar function and three-dimensional structure. In the present analysis other factors might have also led to this kind of relationship between sequence and function similarity. There are, amongst other reasons, inconsistencies in the E.C. classification (e.g. an E.C. number is sometimes assigned to all the subunits of an enzyme, although only one subunit actually performs the catalytic function) and false negatives of the BASIC algorithm. Further improvements in the prediction algorithms and “cleaning” of the database could 8
Pacific Symposium on Biocomputing 5:42-53 (2000)
affect the specific results, but are unlikely to change the general observations made here. 3.4. Similar sequences, dissimilar functions The second group (e.g. 7% of pairs with sequence similarity with Z-score above 100 have E.C. overlap 0) can in principle correspond to extreme cases of divergent evolution, where proteins that could univocally be classified as homologous do not show any function similarity. However, these could also be examples of ambiguity in functional classification or even database misannotation. Functional classification ambiguity seems to be the reason in most cases of pairs with similar sequences and dissimilar functions. By ambiguity we mean the inability of one-dimensional classification to grasp all aspects of protein’s function (see also the Discussion section). Enzymes undergoing divergent evolution have several characteristics and may change some of them while keeping others constant. Possible constraints are substrate and cofactor binding sites and active sites determining chemical mechanism of the reaction catalyzed by the enzyme. Enzymes with the same cofactors or substrates may often have completely different functional classifications while enzymes with similar active sites but changed substrate specificity may have similar functional classifications. However, even enzymes having the same substrates and using the same active sites but acting in different pathways may have completely different functional classifications. Also, very similar enzyme subunits may occur in different complexes, being similar parts of different machinery. In such cases, we observe not divergent molecular evolution, rather divergent cellular context. As an example, ENTC_ECOLI and PABB_ECOLI (Z-score 99, sequence identity 21 %) both use the same substrate: chorismate, and share the chorismate binding domain, but one is classified as isomerase (E.C. classification 5.4.99.6), and the other - as lyase (E.C. 4.1.3.-) PABB is part of a complex, and one of its roles is chorismate binding. GLGB_ECOLI and GLGX_ECOLI (Z-score 80, sequence identity 24 %) both use glycogen as substrate and have the same active sites: one enzyme is classified as a glycogen branching transglucosidase (2.4.1.18), the other hydrolase (3.2.1.-). GOAG_ECOLI (aminotransferase, E.C. 2.6.1.19) and GSA_ECOLI (glutamate1-semialdehyde aminomutase, E.C. 5.4.3.8) have a Z-score 76 and sequence identity 27 %. These proteins have both a pyridoxal phosphate (PLP) cofactor and belong to PLP-dependent aminotransferases. POXB_ECOLI (pyruvate dehydrogenase, E.C. 1.2.2.2) and ILVB_ECOLI (acetolactate synthase, 4.1.3.18), Z-score 107 and sequence identity 28 %, have both a thiamine pyrophosphate cofactor. 9
Pacific Symposium on Biocomputing 5:42-53 (2000)
These few cases (however blurring the sequence - function relationship discussed in this contribution) on one hand show the inevitable shortcomings of any one-dimensional functional classification, and on the other hand exemplify the multi-constraint aspect of enzyme evolution. Classifications of the E.C. type are likely to reflect the chemical mechanism/active site constraint, but not the substrate or cofactor constraint. These examples also show the importance of expert analysis of any automatic function assignment deduced from sequence similarity.
4. Discussion The question of function similarity between proteins is very complex. Apart from the obvious cases of identical function of closely homologous proteins in different organisms, it is not easy to propose a quantitative measure of function similarity. Because protein function is such a complex notion involving biochemical activity, the role in the functioning of the entire organisms, etc., any one-dimensional classifications grasp only one of its many aspects 24. Here we use function classifications emphasizing biochemical activity, thus two proteins from different metabolic pathways would be classified as similar, if the chemical reaction they catalyze is similar. However, using another classification based on the function of the protein in the entire organism 25 instead of E.C. leads to very similar results (data not shown). The approach to the functional classifications as presented here may be regarded by a biologist as over-simplified and naïve. One problem is that the identity of E.C. values may have different meanings in different branches of the classification. For instance, there is much more functional variation between three E. coli DNA polymerases, E.C. 6.4.1.2, than between two superoxide dismutases, E.C. 1.15.11.5. In other words, difference in E.C. is not proportional to the evolutionary distance between two enzymes. Another difficulty arising in automated treatment of functional classifications is, on one hand, the presence of multienzyme complexes, and, on the other hand multidomain proteins with different domains performing different functions. In multienzyme complexes, several different subunits are labeled with one common functional annotation. In multidomain proteins or multi-purpose enzymes, we may have thus several different functional annotations for one polypeptide chain. While such a critique is correct, we still believe that there is a practical need for a quantitative comparison of the functional classifications of different proteins and despite all the pitfalls, an approach such as this provides interesting insights into relations between proteins. The practical conclusions of this study are encouraging for automated function prediction based on sequence similarity to proteins of known functions. Leaving aside the question whether proteins seen as similar by super-sensitive sequence 10
Pacific Symposium on Biocomputing 5:42-53 (2000)
comparison methods are homologous or not, we have shown that the significance of the sequence similarity correlates well with the function similarity. Existence of even a very weak sequence similarity between two proteins increases the chance of them having similar function several times. It should be also stressed that the analysis presented here is more restrictive than real-life situations. Here, we analysed the function conservation alongside with sequence conservation within one genome. In principle, two most similar proteins from two different genomes (if they are related) are likely to be orthologous, whilst within one genome they will be, at best, paralogous. Two paralogues are much more likely to have evolved some divergence in their function. In a real prediction situation, proteins from a newly sequenced genome would be compared to the sequence database of all known proteins. Within such a dataset a given level of sequence similarity should in principle correspond to a higher level of function similarity than within a single genome. Therefore, it can be expected that the rough estimates for sequence-function relationships shown here are in fact lower-bound estimates. Altogether, the results presented in this paper clearly show that recognition of even remote sequence similarity greatly increases chances for the two proteins having similar or related function. Next step of function prediction, such as analysis of active site residue conservation 26, can increase the prediction accuracy even further. 4. 1. Biological implications The very obvious and widespread practice of function assignment based on sequence similarity is analysed here with special attention given to cases of low sequence similarity. It is shown that even in this “twilight zone” while using appropriate similarity measures one can make reasonable function predictions. The results presented here touch upon an interesting point – much of general function predictions can be made without any reference to the three-dimensional structure. It has been reported recently that no clear correspondence between enzyme and fold classes can be established 27. However, in another recent paper preferences of some folds for some functions have been observed 28. The approach described here also has another dimension. Establishing the correspondence between weak sequence similarity and function could be invaluable in attempts to “reduce” organisms to a set of basic ancient genes responsible for the most basic functions.
11
Pacific Symposium on Biocomputing 5:42-53 (2000)
Acknowledgments This work was supported by NIH Grant No. GM60049. References 1. 2. 3. 4. 5. 6. 7. 8. 9. 10. 11. 12. 13. 14. 15. 16. 17. 18. 19. 20. 21. 22. 23. 24. 25. 26. 27. 28. 29.
S. F. Altschul et al., Nuc. Acid Res. 25, 3389-3402 (1997) S. Henikoff et al., preprint (1997) S. Eddy, Curr Opin Struct Biol 6, 361-5 (1996) L. Rychlewski et al., Folding & Design 3, 229-238 (1998) D. T. Jones et al., Nature 358, 86-89 (1992) A. Godzik et al., J.Comp. Aided Mol. 7, 397-438 (1993) D. Fischer and D. Eisenberg, Proc. Natl. Acad. Sci. USA 94, 11929-34 (1997) L. Jaroszewski et al., Protein Science 7, 1431-1440 (1998) L. Holm and C. Sander, FEBS Letters 315, 301-306 (1993) D. Leahy et al., Science 258, 987-91 (1992) A. G. Murzin, Curr. Opinion Str. Biol. 8, 380-387 (1998) M. Huynen et al., J Mol Biol 280, 323-6 (1998) C. Sander and R. Schneider, Proteins 9, 56-68 (1991) S. Brenner et al., Proc Natl Acad Sci U S A 95, 6073-8 (1998) K. Pawlowski et al., Proteins 36, 20-30 (1999) M. Gribskov et al., Proc. Natl. Acad. Sci. U.S.A. 84, 4355-4358 (1987) D. Fischer et al., Proteins in the press (1999) E. C. E. Webb, "Enzyme Nomenclature 1992. Recommendations of the Nomenclature Comittee of the IUBMB" Academic Press, New York (1992) A. Bairoch, Nucleic Acids Res 27, 310-311 (1999) M. Riley and B. Labedan, J. Mol. Biol. 268, 857-868 (1997) L. Rychlewski et al., Protein Science 8, 614-24 (1999) S. Henikoff and J. G. Henikoff, Proc. Natl. Acad. Sci. USA 89, 10915-19 (1992) M. Galperin et al., Genome Res 8, 779-90 (1998) M. Riley, Curr. Opinion Str. Biol. 8, 388-392 (1998) M. Riley, Nucl. Ac. Res. 26, 54 (1998) B. Zhang et al., Protein Science 8, 1104-1115 (1999) A. Martin et al., Structure 6, 875-84 (1998) H. Hegyi and M. Gerstein, J Mol Biol 288, 147-64 (1999) L. Rychlewski et al., Protein Science submitted
12