the Owyhee Mountains of southwestern Idaho, USA. ..... MacDonald, L. H. (1987) Forest harvest, snowmelt and streamflow in the central Sierra Nevada. In:.
Hydrologicat Sciences -Journal- des Sciences Hydrologiques,39,5, October 1994
Impacts of spatially and temporally varying snowmelt on subsurface flow in a mountainous watershed: 1. Snowmelt simulation G. N. FLERCfflNGER & K. R. COOLEY USDA-Agricultural Research Service, Northwest Watershed Research Center, 800 Park Blvd., Suite 105, Boise, Idaho 83712, USA
Y. DENG* University of Idaho, Northwest Watershed Research Center, 800 Park Blvd., Suite 105, Boise, Idaho 83712, USA
Abstract The dominant source of streamflow in many mountainous watersheds is snowmelt recharge through shallow groundwater systems. The hydrological response of these watersheds is controlled by basin structure and spatially distributed snowmelt. The purpose of this series of two papers is to simulate spatially varying snowmelt and groundwater response in a small mountainous watershed. This paper examines the spatially and temporally variable snowmelt to be used as input to the groundwater flow modelling described in the second paper. Snowmelt simulation by the Simultaneous Heat and Water (SHAW) model (a detailed process model of the interrelated heat, water and solute movement through vegetative cover, snow, residue and soil) was validated by applying the model to two years of data at three sites ranging from shallow transient snow cover on a west-facing slope to a deep snow drift on a north-facing slope. The simulated energy balances for several melt periods are presented. Snow depth, density, and the magnitude and timing of snow cover outflow were simulated well for all sites. Influence de la variabilité spatio-temporelle de la fonte des neiges sur l'écoulement de subsurface de bassins versants de montagne: 1. Simulation de la fonte Résumé La principale source de l'écoulement des cours d'eau de nombreux bassins versants montagneux réside dans la recharge de systèmes aquifères superficiels due à la fonte des neiges. La réponse hydrologique de ces bassins est commandée par leur structure et par la distribution spatiale de la fonte. Le but de cet article en deux parties est de montrer comment on peut simuler les variations spatiales de la fonte des neiges et la réponse des eaux souterraines dans un bassin versant montagneux de petite taille. La première partie de l'article s'intéresse aux variations spatiales et temporelles de la fonte des neiges, en relation avec l'écoulement souterrain dont la modélisation sera décrite dans la seconde partie de l'article. Le modèle de fonte SHAW (Simultaneous Heat and Water, un modèle fin des processus conjoints de transfert de la chaleur, de l'eau et des solutés à travers le couvert végétal, la neige, les résidus de fonte et le sol) a été validé en l'appliquant sur deux ans en trois sites
*Now with Morrison Knudsen Corporation, Environmental Group, Boise, Idaho 83729, USA Open for discussion until 1 April 1995
507
508
G. N. Flerchinger et al. allant d'une couverture neigeuse mince et éphémère sur un versant orienté à l'ouest à un épais dépôt neigeux sur un versant orienté au nord. Les bilans énergétiques de plusieurs épisodes de fonte sont présentés. L'épaisseur du manteau neigeux, sa densité, le volume et la chronologie de l'écoulement ont été correctement simulés pour l'ensemble des sites étudiés.
INTRODUCTION Snowmelt recharge to shallow groundwater systems is the primary source of sustained streamflow in many mountainous watersheds (Kattleman, 1989), but the contribution of these shallow systems is often not appreciated. Although many studies have examined groundwater and streamflow response in snow-fed watersheds (e.g. MacDonald, 1987; Buttle, 1989; Hill, 1990; Johnsson & Lundin, 1991), the hydrological processes in these systems are often not well understood. In most areas, snowmelt from deep, mountainous snowpacks seldom exceeds the infiltration capacity of the soil. The major source of streamflow from mountain snowpacks must therefore be transported to the stream via subsurface flow. Thus groundwater and streamflow response are a function of basin structure and the spatial distribution and timing of snowmelt. Studies addressing the impact of spatially variable snowmelt on the hydrological response of watersheds are extremely few. A detailed study of the interactions between snow accumulation, melt, groundwater and streamflow was initiated by the USDA-ARS Northwest Watershed Research Center in 1984 at the Upper Sheep Creek Watershed, a mountainous rangeland watershed in the Owyhee Mountains of southwestern Idaho, USA. Snow accumulation in this area is highly variable (Cooley, 1988), and snowmelt and groundwater processes are dominated by large wind-deposited snowdrifts that form on the leeward side of the major ridges. Flerchinger et al. (1992) examined groundwater and streamflow response to snowmelt at Upper Sheep and found an extremely rapid response to snowmelt during years of normal snow accumulation. Snowmelt models vary in complexity from detailed energy balance models to much simpler degree-day models (Anderson, 1976; Bloschl & Kirnbauer, 1991; Tarboton et al., 1991), and from point models to distributed or grid-based models (Morris, 1982; Leavesley et al., 1983; Bloschl et al., 1991). Anderson (1976) developed one of the most complete and detailed point snow energy balance models. Flerchinger & Saxton (1989) adopted many of Anderson's snow cover routines in developing the Simultaneous Heat and Water (SHAW) Model, a detailed process-based model of heat and water movement in a plant-snow-residue-soil system. This model has advantages in that it includes detailed simulation of heat transfer from the soil and the effects of plant cover on heat and moisture transfer at the surface. This is the first in a series of two papers which aims to simulate snowmelt and groundwater response on a hillslope transect in the Upper Sheep Creek Watershed. This paper focuses on simulation of snowmelt recharge for
Impacts of varying snowmelt: snowmelt simulation
509
input to the groundwater flow modelling described in the following paper and tests the ability of the Simultaneous Heat And Water (SHAW) model to predict snowmelt for extreme ranges of water equivalent, density and aspect. The model's ability to simulate heat and water movement through plant cover, snow, residue and soil for predicting climate and management effects on soil freezing, soil temperature, water, evaporation and transpiration has been demonstrated (Flerchinger & Saxton, 1988; Flerchinger & Hanson, 1989; Flerchinger et al., 1990; Flerchinger & Pierson, 1991; Xu et al., 1991). The accuracy of the model in predicting snowmelt and outflow from a snowpack, however, has never been tested. Extensive data collected at the Upper Sheep Creek Watershed afford the opportunity for testing the snowmelt routines in the SHAW model. Snow depth, density and melt measurements on the watershed were used to validate the model. Based on validations, the model was applied to simulate the spatially and temporally variable snowmelt at points along a hillslope transect for input to the groundwater simulations in the following paper (Deng et al., 1994).
DESCRIPTION OF THE STUDY SITE Upper Sheep Creek, located in the Reynolds Creek Experimental Watershed in southwestern Idaho, USA, is an intermittent, first-order tributary of Reynolds Creek and has been described in detail by Flerchinger et al. (1992). The watershed, shown in Fig. 1, is 26 ha in area and varies in elevation from 1840 to 2036 m a.m.s.l. Locations on the watershed are referenced by a grid system as illustrated in Fig. 1. Annual precipitation is 508 mm, most of which is 0
1
2
3
4
5
6
T
8
9
10 1! 12 13 M
15 16 17 18 19 20 21 22 23 24 25 26 27 28 29 30
Fig. 1 Topography and instrument locations in the Upper Sheep Creek Watershed. (Shaded area indicates extent of snow drift.)
510
G. N. Flerchinger et al.
snow. Snow cover on the watershed varies from transient snow cover with large areas bare of snow for much of the winter to large drifts which typically remain into June. Thus the snowmelt season at Upper Sheep Creek can be divided into general melt and drift melt periods, depending on the areal extent of the snow cover. The general melt consumes most of the snow cover within the watershed, leaving an isolated drift near the ridge. Vegetation is primarily sagebrush, grasses and forbs and follows patterns similar to snow cover across the watershed. Vegetation is extremely sparse on the windswept, west-facing slope, which is bare of snow for much of the winter. Slightly denser vegetation is found on the north slope which accumulates approximately one metre of snow. Shrubs and aspen thickets are found on the upper portion of the north-facing slopes where large snow drifts are formed annually (Fig. 1) by prevailing southwesterly winter winds.
FIELD INSTRUMENTATION AND DATA COLLECTION The instrumentation network in the Upper Sheep Creek basin was constructed in 1984 and consists of piezometers, snowmelt collectors, weirs, precipitation gauges and meteorological instrumentation towers. Hourly meteorological data were collected at two sites on the watershed. Measurements on the north-facing site near J9 (Fig. 1) included air temperature, wind speed and direction, relative humidity, and incoming solar radiation, while those on the west-facing slope near D4 included only air temperature and wind speed. Profiles of soil temperature and water sensors (gypsum moisture blocks) were monitored hourly at both sites to a depth of 30 cm. Precipitation was measured at three sites on the watershed (Fig. 1) using the dual gauge system, which consists of a shielded and an unshielded gauge (Hamon, 1973). Three sets of melt collectors were used to monitor snowmelt rate from different snow accumulation areas. Melt collectors were located beneath the large drift (located between J10 and M10, Fig. 1), downslope of the drift (located near H7), and on the windswept slope north of the stream channel (located near D3). Melt collectors varied in shape and size, but most consisted of a standard precipitation gauge receptacle (203 mm diameter) installed about 25 mm above the ground surface. Meltwater entering a collector was drained downslope in a plastic pipe to a tipping-bucket mechanism within a heated instrument shelter. Additional field data collected throughout the winter season included snow sampling of depth and water content with a snow tube on a 30 m grid, at the snowmelt collectors, and at approximately 6 m intervals on several transects through the drift. Because of the small areal sampling of the snowmelt collectors, caution had to be exercised in interpreting their results; ice lenses and fingering in the snowpack could result in erroneous readings. However, data from the collectors appeared to be representative for the years studied, and only those melt collectors whose cumulative catch roughly agreed with precipitation and snow tube measurements were used for comparison.
Impacts of varying snowmelt: snowmelt simulation
511
THE SHAW MODEL The SHAW model simulates a one-dimensional vertical profile extending from the snow, residue or soil surface to a specified depth within the soil (Fig. 2). The system is represented by integrating detailed physics of snow, vegetative cover, residue and soil into one simultaneous solution. The model is sufficiently flexible to represent a broad range of conditions and the system may or may not include a vegetative canopy, snow, or a residue layer. Interrelated heat, water and solute fluxes are computed throughout the system and include the effects of soil freezing and thawing. Hourly predictions include evaporation, transpiration, soil frost depth, snow depth, runoff and soil profiles of temperature, water, ice and solutes. Further description of the model may be found in Flerchinger & Saxton (1989) and Flerchinger & Pierson (1991).
r^
T u ,j
' 'r
o precipitation
canopy snowpack
ïmmàm\mf^iÊs
residue soil frost
underlying soil
jy_stein b o u rfïï a r y
• T,e.
Fig. 2 Illustration of the system represented by the SHAW model (T, u, S„ i and 6 represent temperature, wind speed, humidity, solar radiation, precipitation and soil water content, respectively).
Energy and mass transfer calculations for snow within the SHAW model are patterned after the point energy and mass balance model developed by Anderson (1976) and applied by Barry et al. (1990). The energy balance of the snow includes solar and long-wave radiation exchange, sensible and latent heat transfer at the surface, and vapour transfer within the snowpack. Absorbed
512
G, N. Flerchinger et al.
solar radiation, corrected for local slope, is based on measured incoming shortwave radiation, with albedo estimated from grain size, which in turn is estimated from snow density. Long-wave radiation emitted by the atmosphere is estimated from the Stefan-Boltzman law and adjusted for cloud cover (estimated from measured solar radiation). Surface sensible and latent heat transfers are estimated using a bulk aerodynamic approach with stability corrections. The SHAW model additionally includes the effect of vegetative cover and detailed energy balance of residue and soil beneath the snow cover. Liquid water is routed through the snowpack using attenuation and lag coefficients, and the influence of metamorphic changes of compaction, settling and grain size on density and albedo are considered. Input to the SHAW model includes: initial snow depth and density; initial soil temperature and water content profiles; daily or hourly weather conditions (temperature, wind speed, humidity, precipitation and solar radiation); general site information; and parameters describing the vegetative cover, snow, residue and soil. General site information includes slope, aspect, latitude, and surface roughness parameters. Parameters necessary for simulating energy and water transfer for a snowpack include coefficients for the functional relation between snow depth and percent snow cover (Flerchinger & Saxton, 1989). Residue or litter properties include residue loading, thickness of the residue layer, percent cover and albedo. Input soil parameters are bulk density, saturated conductivity, coefficients for the matric potential-water content relation, albedo-water content relation, and the thermal conductivity relation.
PROCEDURE Snowmelt simulation of the SHAW model was validated using data from two winters (1986 and 1987) at each of the three snowmelt collector sites on the Upper Sheep Creek Watershed. The three sites represented areas with different snow accumulation characteristics and included: transient snow cover on the west-facing site near D3; the general snow cover area on the north-facing site near H7; and the series of snowmelt collectors located under the drift above J10. Upon successful validation, the model was applied to simulate snowmelt recharge to the ground water along a hillslope transect, with more points being concentrated under the snowdrift. Points along the transect passed near G5, H5, 16, J7, K7, K7+W, K7 + V&, K7 + 3/4, L7, U+VA, U + VI, L7 + 3/4, and M7 (Fig. 1). The model was initialized for melt collector sites D3 and H7, and transect points G5, H5, 16 and J7 (where drifting was not substantial) using the first observations of snow depth and density for each year. To minimize errors in estimating snow deposited by drifting, snow measurements near the peak snow accumulation just prior to melt were used for collector sites and transect points located under the drift. Nevertheless, significant drifting occurred during 1987 after the initial melt. Melt and precipitation measured between days 41
Impacts of varying snowmelt: snowmelt simulation
513
and 85 of 1987 totalled 104 mm and 96 mm, respectively, while the increase in measured water equivalent of the snow was 107 mm. Precipitation inputs to the model for 1987 were therefore adjusted by 115 mm for all sites within the drift to correct for discrepancies caused by drifting snow. Soil properties input to the model were based on soil survey data. Soil on the north-facing slope is a deep silt loam, while that on the west-facing slope near D3 is a shallow, rocky sandy loam. Energy and mass transfer were simulated to a soil depth of four metres, at which soil moisture and temperature were assumed constant at 0.20 cm3 cm 3 (soil water potential = - 2 0 m) and 6.9°C, respectively. Vegetation cover had little impact on melt in the drift since the drift covers the plant canopy for much of the melt period. A sparse, but uniform stand of big sagebrush (Artemisia tridentada tridentada) covered the remainder of the study area on the north-facing slope. Vegetation characteristics were therefore set to an average canopy height of 0.9 m with an estimated leaf area index of 1.5 for all sites except for the melt collector at D3 on the windswept, west-facing slope where vegetation was much more sparse. Height and leaf area index at this site were set to 0.25 m and 0.5, respectively. Hourly weather measurements collected at sites J9 and D4 were used for input to the model. The model was run without prior calibration; parameter values for snow albedo, conductivity, water transmission and metamorphosis of the snow were taken from Anderson (1976). Hourly and daily simulated snow depth and snow cover outflow were compared with measured data. Although not presented here, water loss to sublimation and évapotranspiration were included in the simulations and included in the input to the subsurface flow model in the following paper (Deng et al., 1994)
RESULTS AND DISCUSSION Model validation Daily simulated and measured melt and snow depth are plotted for sites D3, H7 and the uppermost collector above J10 along with precipitation in Fig. 3. Measured snowmelt plotted for site D3 represents an average of two collectors at the site, that plotted for H7 is an average of three collectors at the site, and the uppermost collector above J10 is used as an example of melt within the drift, which varied considerably across the drift. The average absolute departure of simulated daily snowmelt outflow from measured values ranged from 0.9 to 2.4 mm for sites D3 and H7 for the two years. Average departure between simulated and measured snowmelt for J10, which had considerably more snow, was 4.3 mm for 1986 and 3.0 mm for 1987. The coefficient of determination (R2) for simulated snowmelt ranged from 0.39 to 0.84. Timing and magnitude of simulated hourly snowmelt compare well with measured values. Average absolute departure between simulated and measured hourly
514 (a)|
G. N. Flerchinger et al. 30
!T 20 h •s
10
.,J,Ly,y,A
I L lfa.il.
60 45 -S
i
30
s
|
0.2
a
0.0
,.op.oo-o
50 40 30 20 10
A,
0
150
30
HVJ U . :
60 90 120 Day of Year for 1967
50
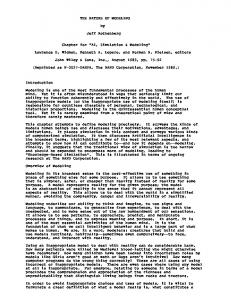
Fig. 6 Simulated snow depth, density and melt at site L7 on the hillslope transect. Snow depth was highly variable along the hillslope transect, ranging from 20 to 360 cm at peak snow accumulation during 1986. Variation in snowmelt along the hillslope transect is illustrated in Fig. 7, showing simulated snowmelt for sites G5, K7 and K7+% (the deepest part of the drift). Total simulated melt for the three sites was 285, 452 and 1754 mm, respectively.
518
G. N. Flerchinger et al.
o 33
£ O
c
CO
-o 0) 13
C/)
80 95 110 125 140 155 Day of Year for 1986 Fig. 7 Simulated melt for 1986 at sites G5, K7 and K7+ 34 illustrating the variation in snowmelt along the hillslope transect.
SUMMARY AND CONCLUSIONS The ability of the Simultaneous Heat and Water (SHAW) model to simulate snowmelt was tested for wide ranges of aspect, snow depth and water equivalent using two years of data from the Upper Sheep Creek Watershed on the Reynolds Creek Experimental Watershed. Model simulations agreed quite well with measured conditions. On shallow and transient snow conditions, the average absolute difference between simulated and measured daily snowmelt was less than 2.4 mm for all sites. Average absolute difference in snowmelt for deep (390 cm) drifts was 4.3 mm. Density changes of the snowpack were also simulated quite well. While measurements were not available to validate energy balance simulations, the results agreed in a very general sense with those presented by Granger et al. (1977) and Marks & Dozier (1992). Because the model has sufficient detail to simulate different modes of energy transfer, snowmelt was simulated reasonably well regardless of the dominant mode of transfer. Lateral transfer and edge effects in the drift were not considered by the one-dimensional model and assumed to be negligible, although Olyphant & Isard (1988) suggested otherwise in windy alpine environments.
Impacts of varying snowmelt: snowmelt simulation
519
Because the model includes a detailed representation of the complete energy balance at the surface, the model should be quite applicable to a broad range of climatic and surface conditions. The validation results suggested that the SHAW model could be applied successfully to predict spatially and temporally variable snowmelt from diverse rangeland sites, and may be used as a "driver" for subsurface flow modelling under the given environmental conditions.
REFERENCES Anderson, E. A. (1976) A point energy and mass balance of a snow cover. NOAA Tech. Rep. NWS 19, US Department of Commerce, National Oceanic and Atmosphere Administration, National Weather Service, Silver Spring, MD, USA. Barry, R., Prévost, M., Stein, J. & Plamondon, A. P. (1990) Application of a snow cover energy and mass balance model in a balsam fir forest. Wat. Resour. Res., 26(5), 1079-1092. Bloschl, G. & Kirnbauer, R. (1991) Point snowmelt models with different degrees of complexity internal processes. /. Hydrol. 129, 127-147. Bloschl, G., Kirnbauer, R. & Gutknecht, D. (1991) Distributed snowmelt simulations in an alpine catchment 1. Model evaluation on the basis of snow cover patterns. Wat. Resour. Res. 27(12), 3171-3179. Buttle, J. M. (1989) Soil moisture and groundwater responses to snowmelt on a drumlin sideslope. /. Hydrol. 105, 335-355. Cooley, K. R. (1988) Snowpack variability on western rangeland. In: Proc. Western Snow Conf, 1-12. (56th Annual Meeting, 19-21 April , Kalispell, Mr). Colorado State University, Fort Collins, CO, USA. Deng, Y., Flerchinger, G. N. & Cooley, K. R. (1994) Impacts of spatially and temporally varying snowmelt on subsurface flow in a mountainous watershed: 2. Subsurface processes. Hydrol. Sci. J. 39(5), Flerchinger, G. N. & Saxton, K. E. (1988) Modeling tillage and residue effects on the hydrology of agricultural croplands. In: Modeling Agricultural, Forest and Rangeland Hydrology, 176-185. Proc. Int. Symp. ASAE Publication 07-88. Flerchinger, G. N. & Hanson, C. L. (1989) Modeling soil freezing and thawing on a rangeland watershed. Trans. Amer. Soc. Agric. Engrs 32(5), 1551-1554. Flerchinger, G. N. & Saxton, K. E. (1989) Simultaneous heat and water model of a freezing snow-residue-soil surface I. Theory and development. Trans. Amer. Soc. Agric. Engrs 32(2), 565-571. Flerchinger, G. N., Cullum, R. R, Hanson, C. L. & Saxton, K. E. (1990) Soil freezing and thawing simulation with the SHAW model. In: Frozen Soil Impacts on Agricultural, Range, and Forest Lands, 77-86. ed. K. R. Cooley. (Proc. Int. Symp.) CRREL Special Report 90-1. US Army Cold Regions Research and Engineering Laboratory, Hanover, NH, USA. Flerchinger, G. N. & Pierson, F. B. (1991) Modeling plant canopy effects on variability of soil temperature and water. Agric. & Forest Meteorol. 56, 227-246. Flerchinger, G. N., Cooley, K. R. & Ralston, D. R. (1992) Groundwater response to snowmelt in a mountainous watershed./. Hydrol. 133, 293-311. Granger, R. J., Chanasyk, D. S., Male, D. H. & Norum, D. I. (1977) Thermal regime of a prairie snowcover. Soil Sci. Soc. Amer. 41(5), 839-842. Hamon, W. R. (1973) Computing actual precipitation. In: Proc. WMO-IAHS Conf, Geilo, Norway. Vol I, WMO 326, 159-174 . Hill B. R. (1990) Groundwater discharge to a headwater valley, northwestern Nevada, USA. J. Hydrol. 113, 265-283. Johnsson.H. & Lundin, L. C. (1991) Surface runoff and soil water percolation as affected by snow and soil frost. J. Hydrol. 122, 141-159. Kattleman, R. (1989) Groundwater contributions in an alpine basin in the Sierra Nevada. In: Symp. Proc. on Headwater Hydrology, ed. W. W. Woessner & D. F. Potts, Amer. Water Resour. Assoc. AWRA Technical Publication Series TPS-89-1, 361-369. Leavesley, G. H., Lichty, R. W, Troutman, B. M. & Saindon, L. G. (1983) Precipitation-runoff modeling system - User's Manual. Water Resources Investigations Report 83-4238, US Geological Survey. MacDonald, L. H. (1987) Forest harvest, snowmelt and streamflow in the central Sierra Nevada. In: Forest Hydrology and Watershed Management, 273-283. (Proc. Vancouver Symp., 9-22 August 1987) IAHS. Publ. no. 167. Marks, D. & Dozier, J. (1992) Climate and energy exchange at the snow surface in the alpine region of the Sierra Nevada 2. Snow cover energy balance. Wat. Resour. Res. 28(11), 3043-3054. Morris, E. M. (1982) Sensitivity of the European Hydrological System snow models. In: Hydrological Aspects of Alpine and High Mountain Areas (Proc. Exeter Symp., July 1982) IAHS Publ. no. 138.
520
G. N. Flerchinger
et al.
Olyphant, G. A. & Isard, S. A. (1988) The role of advection in the energy balance of late-lying snowfields: Niwot Ridge, Front Range, Colorado. Wat. Resour. Res. 24(11), 1962-1968. Tarboton, D. G., Al-Adhami, M. J. & Bowles, D. S. (1991) A preliminary comparison of snowmelt models for erosion prediction. (Proc. Western Snow Conf., 59th Annual Meeting, Juneau, AK, USA). Colorado State University, Fort Collins, CO, USA. Xu, X., Nieber, J. L., Baker, J. M. & Newcomb, D. E. (1991) Field testing of a model for water flow and heat transport in variably saturated, variably frozen soil. In: Transportation Research Record No. 1307, 300-308. Transp. Res. Board, Nat. Res. Council, Washington DC, USA. Received 22 November 1993; accepted 26 May 1994