Mar 5, 2014 - unwarranted premium-rate subscription of SMS services, ad- vanced fraud, and even damaging participation to botnets. Permission to make ...
Large-Scale Machine Learning-based Malware Detection: Confronting the “10-Fold Cross Validation” Scheme with Reality Kevin Allix, Tegawendé F. Bissyandé, Quentin Jérome, Jacques Klein, Radu State, Yves Le Traon University of Luxembourg 4 rue Alphonse Weicker L-2721 Luxembourg, Luxembourg
{firstname.lastname}@uni.lu ABSTRACT
Machine learning techniques, by allowing to sift through large sets of applications to detect malicious applications based on measures of similarity of features, appear to be promising for large-scale malware detection. Unfortunately, measuring the quality of a malware detection scheme has always been a challenge, especially in the case of malware detectors whose authors claim that they work “in the wild”. In this paper: a) We propose a novel feature set for machinelearning classifiers for malware detection, based on abstract basic blocks extracted from the Control-Flow Graph; b) We show that our implemented classifiers yield a high malware discrimating power when evaluated with the 10-fold cross validation scheme; c) We show that 10-fold validation on the usual sizes of datasets presented in the literature is not a reliable performance indicator for realistic malware detectors. We introduce in section 2 our datasets. Section 3 describes our approach of malware detection. Section 4 presents the assessment of our approach. Related work is discussed, and section 6 concludes and enumerates future work.
To address the issue of malware detection, researchers have recently started to investigate the capabilities of machinelearning techniques for proposing effective approaches. Several promising results were recorded in the literature, many approaches being assessed with the common “10-Fold cross validation” scheme. This paper revisits the purpose of malware detection to discuss the adequacy of the “10-Fold” scheme for validating techniques that may not perform well in reality. To this end, we have devised several Machine Learning classifiers that rely on a novel set of features built from applications’ CFGs. We use a sizeable dataset of over 50,000 Android applications collected from sources where state-ofthe art approaches have selected their data. We show that our approach outperforms existing machine learning-based approaches. However, this high performance on usual-size datasets does not translate in high performance in the wild.
Categories and Subject Descriptors D.4.6 [Operating Systems]: Security and Protection—Invasive software (e.g., viruses, worms, Trojan horses)
2.
In this section, we present the datasets that are used to build and assess our classifiers. We have used two sources of Android applications that are often used by researchers and practitioners of machine learning-based malware detection for Android.
Keywords Machine Learning, Ten-Fold, Malware, Android
1.
DATASETS
INTRODUCTION
The increasing adoption of smartphones and electronic tablets has created unprecedented opportunities of damages by malicious software which are hidden among the millions of mobile apps available, often for free, on application markets [1]. Malware pose various threats that range from simple user tracking and leakage of personal information [2], to unwarranted premium-rate subscription of SMS services, advanced fraud, and even damaging participation to botnets.
Building an Android market dataset. Google Play is the main Android applications market available. We have built a tool that automatically crawls and downloads free applications available in this source.In the course of six months, we have collected a dataset of nearly 52 000 unique applications.
Collecting known malware. For training needs, we must have access to a reliable set of Android malware. To this end, we leverage a dataset released in the course of the Genome project [3]. The Genome dataset contains over 1 200 Android malware samples.
Permission to make digital or hard copies of part or all of this work for personal or classroom use is granted without fee provided that copies are not made or distributed for profit or commercial advantage, and that copies bear this notice and the full citation on the first page. Copyrights for third-party components of this work must be honored. For all other uses, contact the owner/author(s). Copyright is held by the author/owner(s). CODASPY’14, March 3–5, 2014, San Antonio, Texas, USA. ACM 978-1-4503-2278-2/14/03. http://dx.doi.org/10.1145/2557547.2557587.
Malware labeling. In order to construct a reference classification to which we can compare the predictions of our approaches, we collected from VirusTotal1 the analysis report of each application in 1
163
https://www.virustotal.com
our datasets. VirusTotal is a service that allows to readily obtain information on antivirus products which have identified a given application sample as malware.
3.
OUR APPROACH unselected
0
selected Set α
Novel Feature Set for Malware Detection
Set ! Feature Evaluation
We perform static analysis of Android applications’ bytecode to extract a representation of the program control-flow graph (CFG). The extracted CFG is expressed as character strings using a method devised by Pouik et al. [4]. This method is based on a grammar proposed by Cesare and Xiang [5]. Given the abstract representation of an application’s CFG, we collect all the basic blocks and refer to them as the features of the application. A basic block is a sequence of instructions in the CFG with only one entry point and one exit point. For reproducibility purposes, the feature matrices that we have computed are publicly available for download2 .
3.2
S T E P
Random Selection
In this paper we propose a novel approach to extract, from an application program, elements of applications’ Control Flow Graphs which should capture, in a more meaningful way than n-grams, the implementation of a malicious behavior inside program code.
3.1
Genome
Google Play
S T E P 1
(feature, InfoGain) Feature Selection
Feature Selection
n best features of Set !
Classification Model
Training
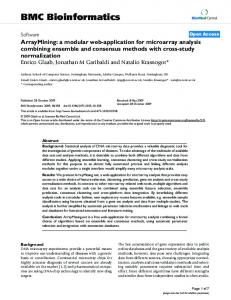
We now discuss the different steps, illustrated in Figure 1, for building the classification model.
Classificati on Model
Step 0: Set composition. Our complete dataset contains over 50 000 applications that we divide into two distinct sets, one significantly smaller than the other, for the purpose of assessment. The first set, Setα , contains all known malware, i.e., all items in the Genome dataset. To complete this set, we randomly select a subset of the Google Play dataset to add as the goodware portion of the dataset. The second set, Setδ , is then composed of the remaining subset of the Google Play dataset. Setδ is always used as a testing set, whereas Setα can be used as training set (in the wild) or as the entire universe (10-Fold).
S T E P
n best features of Set α
2
10-Fold Cross-Validation
S T E P
Accuracy Metrics
3
Classification VirusTotal Labelling Validation
10-Fold S T E P 3
Accuracy Metrics Large scale ("in the wild")
Step 1: Feature Evaluation. Once the sets of an experiment are defined, a feature evaluation step is performed to measure the discriminating power of every feature.
Figure 1: The steps in our approach
Step 2: Feature Selection. For practical reasons, given the large number of features to process, we only retain, after the evaluation step, the best N features, i.e. those with the highest InfoGain values.
3.3
Step 3: Classification validation scenarios. We propose
Goodware/Malware ratio. We performed various experi-
to use two distinct scenarios to validate our malware detection approach. 10-Fold cross validation. For assessing our malware detection approach with the 10-fold cross validation scheme we consider Setα as the dataset where both training and testing data will be drawn. Validation in the wild. We perform large-scale experiments where the training is performed on Setα . The trained classifier is then used to predict the class of every single application from Setδ . Those predictions are compared to our reference classification obtained from VirusTotal.
ments tuning the ratio value to 1/2, 1, 2 and up to 3, representing respectively 620, 1 247, 2 500 and 3 500 Android applications selected in the goodware set.
2
Varying & Tuning the Experiments
We now succinctly describe the parameters that are used in our experiments.
Volume of processed features. Our experiments were done with different numbers of selected features: 50, 250, 500, 1 000, 1 500, 5 000.
Classification algorithm. Our malware detectors are implemented using 4 well-known machine learning algorithms, namely RandomForest, J48, JRip and LibSVM, Since the selection of Goodware performed in Step 1 is performed randomly, we repeat 10 times each experiment with a given triplet of parameter values. In total, 4 (values
https://github.com/malwaredetector/malware-detect
164
6.
for number of Goodware) ×6 (values for number of features) ×4 (number of algorithms) ×10 = 960 runs were processed for our experiments.
4.
We have discussed in this paper the validation of machinelearning malware detection with 10-fold cross validation and in the wild with realistic datasets. We proposed a novel Feature set that yield high performance measures in 10-Fold cross validation. Beyond this validation, we have assessed the actual ability of our classifiers to detect Malware in a large dataset. The recorded poor performance has provided us with new insights regarding the validity of 10-fold cross validation. In future work, we plan to investigate under what conditions 10-fold cross validation could be a reliable indicator of realistic malware detectors accuracy.
ASSESSMENT
Figure 2 depicts the distribution of precision, recall and F-measure that the 960 10-fold cross validation tests have yielded. 1 0.9 0.8 0.7 0.6 0.5 0.4 0.3 0.2 0.1 0
7. Precision
Recall
F1
The results indicate that the vast majority of our 960 built classifiers exhibit a very high precision rate with a median value of 0.94. Although recall values are lower than precision values, a large portion of our classifiers exhibit a high recall rate. The F-measure values obtained are high, going from 0.53 to 0.96, with a median value of 0.91. Figure 3 illustrates the distribution of precision, recall and F-measure values for the 960 large-scale experiments. Those classifiers exhibit a very low precision rate with a median value of 0.11. The global performance of the classifiers is very in large-scale experiments, with F-measure values close to 0.
Precision
Recall
F1
Figure 3: Distribution of precision, recall and Fmeasure values in “in the wild” experiments
5.
REFERENCES
[1] Felt, A.P., Finifter, M., Chin, E., Hanna, S., Wagner, D.: A survey of mobile malware in the wild. In: Proceedings of the 1st ACM workshop on Security and privacy in smartphones and mobile devices. SPSM ’11, New York, NY, USA, ACM (2011) 3–14 [2] Enck, W., Octeau, D., McDaniel, P., Chaudhuri, S.: A study of android application security. In: Proceedings of the 20th USENIX conference on Security. SEC’11, Berkeley, CA, USA, USENIX Association (2011) 21–21 [3] Zhou, Y., Jiang, X.: Dissecting android malware: Characterization and evolution. In: Proceedings of the 2012 IEEE Symposium on Security and Privacy. SP ’12, Washington, DC, USA, IEEE Computer Society (2012) 95–109 [4] Pouik, G0rfi3ld: Similarities for fun & profit. Phrack 14(68) (April 2012) http: //www.phrack.org/issues.html?id=15&issue=68. [5] Cesare, S., Xiang, Y.: Classification of malware using structured control flow. In: Proceedings of the Eighth Australasian Symposium on Parallel and Distributed Computing - Volume 107. AusPDC ’10, Darlinghurst, Australia, Australia, Australian Computer Society, Inc. (2010) 61–70 [6] Wu, D.J., Mao, C.H., Wei, T.E., Lee, H.M., Wu, K.P.: Droidmat: Android malware detection through manifest and api calls tracing. In: Information Security (Asia JCIS), 2012 Seventh Asia Joint Conference on. (2012) 62–69 [7] Amos, B., Turner, H., White, J.: Applying machine learning classifiers to dynamic android malware detection at scale. In: Wireless Communications and Mobile Computing Conference (IWCMC), 2013 9th International. (2013) 1666–1671 [8] Demme, J., Maycock, M., Schmitz, J., Tang, A., Waksman, A., Sethumadhavan, S., Stolfo, S.: On the feasibility of online malware detection with performance counters. In: Proceedings of the 40th Annual International Symposium on Computer Architecture. ISCA ’13, New York, NY, USA, ACM (2013) 559–570 [9] Yerima, S., Sezer, S., McWilliams, G., Muttik, I.: A new android malware detection approach using bayesian classification. In: Advanced Information Networking and Applications (AINA), 2013 IEEE 27th International Conference on. (2013) 121–128 [10] Canfora, G., Mercaldo, F., Visaggio, C.A.: A classifier of malicious android applications. In: Availability, Reliability and Security (ARES), 2013 eight International Conference on. (2013)
Figure 2: Distribution of precision, recall and Fmeasure for the malware class yielded by all 960 10fold cross validation experiments
1 0.9 0.8 0.7 0.6 0.5 0.4 0.3 0.2 0.1 0
CONCLUSION
RELATED WORK
None of the approaches introduced by the literature discussed in this section provide a large scale evaluation of their approach.
Android malware detection. Using permissions and API calls as features, Wu et al. [6] performed their experiments on a dataset of 1 500 goodware and 238 malware. In 2013, Amos et al. [7] leveraged dynamic application profiling in their malware detector. Demme et al. [8] also used dynamic application analysis to perform malware detection with a dataset of 210 goodware and 503 malware. Yerima et al. [9] built classifiers based on API calls, external program execution and permissions. Their dataset consists in 1 000 goodware and 1 000 malware. Canfora et al. [10] experimented feature sets based on SysCalls and permissions. Their classifiers were evaluated on a dataset of 200 goodware and 200 malware.
165