FBMIS Volume 1, 2008, 11-22 http://www.fbmis.info/A/8_1_IliadisL_1
ISSN 1740-5955 Copyright @ 2008 The FBMIS Group
AN INNOVATIVE DECISION SUPPORT SYSTEM USING FUZZY REASONING FOR THE ESTIMATION OF MOUNTAINOUS WATERSHEDS TORRENTIAL RISK: THE CASES OF LAKES KORONEIA AND VOLVI L. ILIADIS, F. ΜARIS and T. TSATALTZINOS Department of Forestry & Management of the Environment & Natural Resources, Democritus University of Thrace, GR-68200, N. Orestiada, Greece [
[email protected],
[email protected]]
(Submitted 2nd June 2005; Accepted 28th July 2007; Published 25th Sept. 2008)
ABSTRACT. This manuscript describes the design, development and testing of a Decision Support System that performs Torrential Risk estimation of mountainous watersheds. The System applies an innovative Fuzzy Logic model. The model, considers actual values of a wide range of independent variables for a long time period. It is the first modelling approach that takes into account the percentage of compact geological forms and the percentage of forest cover. For each risk factor a corresponding Fussy set is formed. Then, Partial Risk Indices are produced that express the degree of Torrential Risk due to each involved parameter separately. This is done by using various Fuzzy Set Membership functions. Each watershed is assigned many Partial Risk Indices which are unified (under different perspectives) using Fuzzy conjunction operations called T-Norms. This is done towards the production of a Unified Torrential Risk Index for each area. The System has been applied successfully for the watersheds of Koroneia - Volvi lacustrian area. Keywords: Decision Support System, Torrential Risk, Fuzzy Membership Functions, T-Norms
1
INTRODUCTION
Torrential risk estimation is a major issue. This project deals with the construction of an innovative fuzzy model, applied by a prototype Decision Support System (DSS) in order to evaluate the Degree of Torrential Risk (DTR) for the mountainous watersheds of an area under study. The TORRISDESSYS (Torrential Risk Decision Support System) aims in offering a more flexible and more sophisticated approach closer to the real world. The established hydrological methodologies (EHM) consider mainly the average annual values of a limited number of factors (mainly volume of sediments, meteorological data and erosion). A potential limitation of the EHM is the fact that they do not take into account the torrential-history of each watershed over time and they also ignore the importance of having extreme values for one or more factors. For example, the hydrological model of Kronfellner-Kraus determines the DTR based on the estimation of the maximum possible load of sediments (Kronfellner 1985, Kotoulas 1997). As a matter of fact, EHM consider the risk coming from a narrow range of involved risk variables and they ignore the contribution of other risk variables. For example, a serious question could be: “How can we assign a high DTR to a watershed that is characterised by complete lack of vegetation (e.g. 0% forest cover) or by an extreme average slope value (e.g. 30%) [both low risk factors] when at the same time it has low risk values for all the other risk variables?”. Unfortunately this question cannot be answered by the EHM. The TORRISDESSYS applies fuzzy algebra and fuzzy set theory concepts that offer a flexible way of modelling, using proper linguistics (Leondes, 1998). Fuzzy logic was introduced by Zadeh in 1965 (Kandel, 1992). The use of fuzzy numbers and fuzzy sets offered scientists powerful tools for performing ranking tasks (Kandel, 1992). This study works towards two complementary parallel directions. The first direction involves the determination of the main n risk factors (RF) affecting the specific risk problem. For each RF a fuzzy set is formed using different fuzzy set membership functions. After the first task is over we can have an idea of the reasons that make each area risky or not. But we do not have a clear view of its overall Torrential Risk. The problem is still the determination of the unique Unified Risk Index (URI) that expresses an overall indication concerning the Torrential Risk of the watershed. The URI is obtained by applying five different types of Fuzzy Relations which are
11
FBMIS Volume 1, 2008, 11-22 http://www.fbmis.info/A/8_1_IliadisL_1
ISSN 1740-5955 Copyright @ 2008 The FBMIS Group
called T-Norms and they provide conjunction between the fuzzy sets (and consequently between the Partial Risk Indices) under different perspectives. This approach and its application for the torrential risk estimation of the main watersheds of NorthEastern Greece has been partly presented in another paper of our research team (Iliadis et al. 2004). The original contribution of this research effort is that it applies for the first time, the Sigmoid and the Normal Distribution membership functions. The second direction of this research is the application of the system and the development of a comparative study between the output of three EHM to the one proposed here. The results of the two methods of Gavrilovic (G1) and (G2), and the results of the method of Kronfellner-Kraus are compared to the output of TORRISDESSYS for the lakes Koroneia and Volvi which are located in North Greece, close to the city of Thessaloniki.
2 MATERIALS AND METHODS 2.1 The Partial Risk estimation model The problem of torrential risk estimation is quite complex, since torrential risk is a composite of several independent parameters of uneven contribution. Another major difficulty is the fact that the DTR is not directly measurable in a structured manner. Thus, a model has to be built to encapsulate the effect of each parameter separately and to produce a unified index that will serve as an overall torrential risk indicator. This index will be a pure number from 0 to 1. Of course this modelling effort should be as flexible as possible, considering the problem under different perspectives. Such modelling problems can be faced using two different algebraic modelling approaches. The one uses crisp sets (Leondes, 1998) and it has the great disadvantage of using specific boundaries. Boolean logic is a logic of discrete variables whereas with fuzzy logic we can represent elastic and imprecise concepts as being of high risk, e.g. a long duration, a tall person, a large transaction volume (Cox 2005). According to the crisp set approach a watershed with 20mm of rainfall may be considered as “extremely rainy” but another with 19.999 mm of rainfall may be characterised simply as “rainy”. Cases that belong to the boundaries are always a problem when crisp sets are applied. The function defined in Eq. 1 defines a crisp set. In crisp set theory a function of this type is also called a characteristic function.
1, if X S μS ( Χ ) 0 , if X S
(1)
On the other hand, the approach proposed in this paper and in Iliadis et al. (2004) uses fuzzy sets (FS) which can be used to produce rational and sensible clustering (Kandel, 1992). Fuzzy logic (FL) is widely used in various fields of engineering, decision support and data analysis applications. A survey done in 1994 identified a total of 684 such applications in Europe (Kecman, 2001). FL is a tool for modelling human knowledge and real world concepts. The world we are living in is not binary. For example, in real life people are not divided only into “good” and “bad” and there is a whole spectrum of colours between black and white. The modelling of the concept “dry area” in terms of rainfall, is both subjective and imprecise so it can be considered as a FS. It is clear that proper linguistics can be used to describe real world situations and that for each linguistic term a corresponding FS can be defined. For a FS there exists a degree of membership (DOM) function μS(Χ) that is mapped onto [0,1]. For example, every watershed belongs to the FS “Torrential Risky Watershed” with a different degree of membership (Kandel, 1992). The function that determines the DOM is called a fuzzy membership function (FMF). The FMFs that have been applied in this research effort are the Trapezoidal (TRAPMF), the Triangular (TRIAMF) the Sigmoid (SIGMF) and the Normal Distribution (NODIMF). The function given in Eq. 2 represents the triangular FMF, TRIAMF (Kecman 2001):
0 if X a ( X-a ) / (c-a ) if X [ a,c ] μs ( Χ ) (b-X ) / (b-c ) if X [c,b] 0 if X b
12
(2)
FBMIS Volume 1, 2008, 11-22 http://www.fbmis.info/A/8_1_IliadisL_1
ISSN 1740-5955 Copyright @ 2008 The FBMIS Group __
Figure 1 shows the triangular FMF for a fuzzy set M and for its fuzzy complement M .
Figure 1.
A fuzzy set M and its complement M using a triangular membership function.
Figure 2 shows the definition of five linguistic terms related to the rainfall of an area under study. The watershed can be characterised as “Dry area” with a DOM = 0.7 and also as “Rainy area” with a DOM = 0.1, for suitable rainfall values. This real life situation is described in a most realistic way using the proper linguistic terms (Leondes, 1998, Nguyen and Walker, 2000).
Figure 2. Definition of “Rainy” fuzzy sets using triangular membership functions.
13
FBMIS Volume 1, 2008, 11-22 http://www.fbmis.info/A/8_1_IliadisL_1
ISSN 1740-5955 Copyright @ 2008 The FBMIS Group
The function given in Eq. 3 represents a trapezoidal membership function, TRAPMF (Nguyen and Walker, 2000): if X a 0 , ( X-a) / (m-a ) , if X (a,m) μ s ( X ) 1, if X [m,n] (b-X ) / (b-n) , if X ( n,b) if X b 0 ,
(3)
The use of the TRIAMF offers only one peak, which means that only one area will have the highest risk value, whereas the TRAPMF can assign high risk to many areas. So our system acts as an actual consultant of a human expert, offering various dynamic views of the problem, rather than a single risk value. The membership functions defined in Eq. 4 and Eq. 5 correspond to a parametric form of the Sigmoid FMF and to the Normal Distribution FMF respectively, which are applied for the first time for the restoration of lake Kroneia in Greece, in Tzionas et al. (2004).
μ Sigmoid ( Χ ) f Sigmoid ( X | a, c )
1 1 e a X c
X (the real numbers)
;
(4)
It should be clarified that in the Sigmoid FMF the parameters a and c determine its shape and position. Also a parametric form of the Normal Distribution was used as a MF. Again in Normal distribution the parameter c declares the position of the curve and σ is the standard deviation. ( X c ) 2
μNormal ( Χ ) f Normal ( X | , c) e
2 2
;
X (the real numbers)
(5)
The model used in the is study applies four different FMFs in order to estimate the degree of membership of the m watersheds under examination, to each of n fuzzy sets. In this way each watershed is assigned n real numbers (ranging from 0 to 1) that show its degree of risk for each of the n risk variables/factors respectively. Each watershed can belong to all of the n fuzzy sets with a different degree of membership. Consequently a (m n) two-dimensional risk matrix may be formed containing the risk indices resulting from each membership function. The Risk Degree Matrix is: 11 12 ...... 1n μ( Χ ) 21 22 ...... 2 n ...... ...... ...... ...... m1 m 2 ...... mn
i = 1, …, m; j = 1, … , n
where X = [Xij ] is the matrix of risk variables, with Xij being the risk variable for the ith watershed on the jth risk variable, and µij = µ(Xij). Four such matrices are formed corresponding to the four FMFs considered. In this way the system used assigns each watershed several partial risk indices (PRI). So if the system evaluates the impact of five different risk variable/factors to the problem of torrential risk, it produces five different PRI for each watershed. Each area can be very risky due to one factor and not risky at all due to another. 2.2 Risk factors involved According to the bibliography by Kotoulas (1997), the most important morphometric characteristics that influence the torrential risk of a watershed are the following: the area, the perimeter, the shape of the watershed, the degree of the roundness of the watershed, the maximum altitude, the minimum altitude, the average altitude, the average slope of the watershed (Grohmann, 2004, Weingartner 2003, Zacharias et al. 2003). The TORRISDESSYS model has been based mainly
14
FBMIS Volume 1, 2008, 11-22 http://www.fbmis.info/A/8_1_IliadisL_1
ISSN 1740-5955 Copyright @ 2008 The FBMIS Group
on the above factors. However there are also other important factors, like vegetation and the structure of the watershed from a geological point of view. After taking into account all the above considerations it has been determined that TORRISDESSYS should include the following independent parameters: a) the average altitude (AA) of the watersheds, b) the average slope of the watersheds (AS), c) the average annual rainfall at the average altitude of each watershed, (AAR) d) the percentage of forest-cover of each watershed, (PFC) e) the percentage of the compact geological forms (PCGF) of the watershed. Consequently, the following five fuzzy sets have been formed, corresponding to the above mentioned five risk factors: FS1 = High average altitude watershed FS2 = High average slope watershed FS3 = Extremely rainy watershed FS4 = High forested watershed FS5 = Watershed with compact geological forms The four FMFs (from Eq.’s 2,3,4 & 5) have been used to determine the DOM of each watershed to each FS. All of the calculated DOMs constitute the Partial Risk Indices vector (PRI vector). 2.3 The Risk Unification Model The determination of the PRI vector is the first important step. The next major step towards the final target is the unification of the PRI vector in order to produce a Unified Risk Index, URI. This means that specific fuzzy conjunction operators have been applied towards the unification of the five fussy sets. The execution of the conjunction operation (FS1 AND FS2 AND FS3 AND FS4 AND FS5) produces the FS “Torrential Risky watershed” (following Kecman (2001)). Conjunction has been performed using various types of unification operation (T-Norms) of fuzzy algebra in order to unify the five FSs. The highest possible value of the URI is unity, whereas the lowest possible value is zero. Table 1 presents the T-Norms that have been used. Table 1. T-Norms used in the project 1. Minimum Approach URI MIN ( μ Α ( Χ ) ,μΒ ( Χ ) ,..., μ Ν ( Χ )) 2. Algebraic Product
URI μ Α ( Χ ) μΒ ( Χ ) * ... * n ( X )
3. Drastic Product URI MIN (μ Α ( Χ ) μ Β ( Χ ) ,...,μn ( Χ )) if MAX ( μ Α ( Χ ) ,μΒ ( Χ ) ,....,μn ( Χ )) 1 = 0 otherwise 4. Einstein Product μ Α Χ *μΒ Χ *...μn Χ URI 2 μ Α Χ μΒ Χ ...μn Χ μ Α Χ *μΒ Χ *....*μn Χ 5. Hamacher Product
URI
μ Α Χ *μΒ Χ *...μn Χ μ Α Χ μΒ Χ ...μn Χ μ Α Χ *μΒ Χ *....*μn Χ
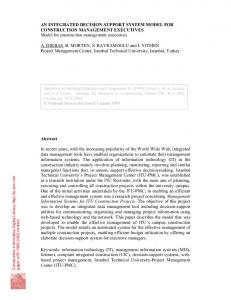
Each of the T-Norms produces a Unified Risk Index, acting under a different perspective. For example the Minimum Approach T-Norm considers the minimum DOM as the URI, whereas the Algebraic Product acts as an overall risk index, and the Drastic Product considers the DOM of the watershed with the most extreme value as the URI. This can be very useful because each URI expresses a valid DTR under a different point of view. The following figure 3, presents the logical structure and the functionality of the TORRISDESSYS. It presents the determination of the partial risk indices using various membership functions and the application of the T-Norms for the determination of the unified degree of torrential risk. A compatibility study between TORRISDESSYS and other three EHM offers very interesting results
15
FBMIS Volume 1, 2008, 11-22 http://www.fbmis.info/A/8_1_IliadisL_1
Figure 3.
ISSN 1740-5955 Copyright @ 2008 The FBMIS Group
The structure and the logical functionality of TORRISDESSYS
.
3 THE SOFTWARE A Decision Support System (DSS) has been developed using the relational database Microsoft Access. The Access environment was used due to the fact that the reasoning of the system is quite straightforward and there are no complicated or special rules involved in it: the data lead the system to the goal. Consequently it is a data driven DSS. All data have been stored in properly designed Tables that follow the principles of the first three normal forms (Date, 1990). The functions of the mathematical model have been performed using single and multiple queries written in the Structured Query Language (SQL). The system uses a very friendly Graphical user interface and its results are obtained in a straightforward manner. The input and the output are performed using Access forms and command buttons. The potential user does not need any special experience in computers to run the system and he/she does not have any access to the protected core of the system. The system software may be obtained from the first author of this paper, and a user guide will be available from http://www.fmenr.duth.gr in October 2007. Screen 1. A screen from the System’s Interface
16
FBMIS Volume 1, 2008, 11-22 http://www.fbmis.info/A/8_1_IliadisL_1
ISSN 1740-5955 Copyright @ 2008 The FBMIS Group
4 RESULTS AND DISCUSSION 4.1 Results The research area where the DSS has been applied for the estimation of the Torrential Risk is located in the Northern part of Greece and more specifically in the lacustrian area of Koroneia and Volvi, near the city of Thessaloniki. Data have been gathered from Greek public services who are responsible for meteorological and map data. Initially the limits of the research areas have been estimated. Maps of the Geographical Army Service (GAS) with a scale of 1:250.000 have been used for this purpose. The upper and lower limits of the watershed areas are 300 km2 and 2 km2 respectively. This means that the largest watershed had an area of 300 km2 whereas the smallest had an area of 2 km2. Streams with larger or smaller area were not considered for this study. (Kotoulas, 1997). For every research area and for each torrential stream the morphometric characteristics (average slope, average altitude, percentage of forest cover) have been specified. The morphometric characteristics have been produced by processing of maps (scale 1:100,000) of the GAS and the accuracy of the data has been confirmed by visits of our research teams in the research areas. The results have been stored in descending order in a Microsoft Access database. For each research area a separate table has been used. Table 2 presents the four most risky watersheds for the Volvi lacustrian area, for all of the FMF and for all of the T-Norms used. Table 2. The four most Torrential risky watersheds in the Volvi area for each MF. AREA OF VOLVI W# Stands for Watershed number Normal Distribution Membership Function
Sigmoid Membership Function
Alg. Product B28.3
MIN B29
Drastic Product B26
Einstein B28.3
Ham B28.3
Alg. Product B28.3
MIN B43.1
Drastic Product B1
Einstein B28.3
Ham B8
B28.1
B28.2
B19
B28.15
B28.15
B28.2
B27
B2
B28.2
B3
B28.1
B28.3
B20
B29
B29
B28.6
B29
B3
B28.6
B2
B29
B43.5
B21
B28.16
B28.2
B28.9
B28.2
B4
B28.9
B7
MIN B43.1
Drastic Product B28.11
Einstein B28.11
Ham B28.11
Trapezoidal Membership Function Alg. Product B16
Triangular Membership Function
MIN B43.1
Drastic Product B16
Einstein B28.11
Ham B16
Alg. Product B28.11
B28.4
B16
B28.4
B15
B28.4
B28.4
B28.11
B17
B28.4
B28.4
B15
B28.4
B15
B28.4
B15
B43.1
B43.2
B16
B15
B43.1
B28.11
B15
B42
B16
B28.11
B43.2
B17
B40
B17
B43.2
Table 3. The four most Torrential risky streams in Koroneia area for each MF AREA OF KORONEIA W# Stands for Watershed number Normal Distribution Membership Function Alg. Drastic Product Product MIN Einstein Ham
Alg. Product
Sigmoid Membership Function Drastic Product MIN Einstein
Ham
Κ4
Κ2
Κ15
Κ4
Κ4
Κ4
Κ2
Κ1
Κ4
Κ4
Κ2
Κ4
Κ2
Κ2
Κ2
Κ2
Κ24
Κ2
Κ2
Κ2
Κ9
Κ14
Κ3
Κ9
Κ9
Κ15
Κ10
Κ3
Κ15
Κ15
Κ8
Κ5
Κ4
Κ8
Κ13
Κ17
Κ1
Κ4
Κ17
Κ17
Ham
Alg. Product
Alg. Product
Trapezoidal Membership Function Drastic Product MIN Einstein
Triangular Membership Function Drastic Product MIN Einstein
Ham
Κ19
Κ19
Κ19
Κ19
Κ19
Κ19
Κ21
Κ19
Κ19
Κ19
Κ18
Κ18
Κ18
Κ18
Κ18
Κ18
Κ19
Κ17
Κ18
Κ18
Κ16
Κ23
Κ23
Κ16
Κ16
Κ17
Κ22
Κ18
Κ17
Κ17
Κ23
Κ16
Κ16
Κ23
Κ23
Κ21
Κ17
Κ23
Κ21
Κ21
17
FBMIS Volume 1, 2008, 11-22 http://www.fbmis.info/A/8_1_IliadisL_1
ISSN 1740-5955 Copyright @ 2008 The FBMIS Group
4.2 Discussion From Table 2, the stream B28.3 appears to be the most risky, for the Normal Distribution (ND) and for the Sigmoid (SIG) FMF, regardless the T-Norm used. Other areas that are characterized as risky based on the ND and on the SIG are B28.2, B28.15, B28.9, B28.6 and B28.15. Of course, in the cases of ND and SIG the Drastic Product operates in its own way, giving distinct areas as risky, due to its nature that characterizes as risky the areas that have extreme values for one or more risk factors. Though in Table 2, there seems to be a disagreement between the Drastic and the others for the ND and SIG, it is reasonable, due to the different perspective of the Drastic Product. On the other hand, Table 2 shows that for the Trapezoidal FMF the areas B16, B15, B28.4, B28.11 are the most risky watersheds. The Drastic Product has a very high compatibility with the other TNorms in the case of the Trapezoidal FMF. The Drastic Product the Einstein Product and the Hamacher Product agree that the watersheds with code names B28.4, B16 and B15 are three of the four most risky ones, but they assign them a different order in the case of the TRAPMF. Of course one can argue that the point is to locate the four most risky torrential streams, whereas the ranking (first or second) is not so important. Based on Table 3, the stream K4 appears to be the most risky one, according to the Normal Distribution (ND) and the Sigmoid (SIG) FMF, regardless the T-Norm. Other areas that are characterized as risky based on the ND and on the SIG are K2 and K4. Of course in the cases of ND and SIG the Drastic Product characterises K1 and K15 as risky due to its nature. This is due to the fact that these two areas have extremely low forest cover. However the Drastic Product has a very high compatibility with the other T-Norms in the case of the Trapezoidal FMF. It has a 100% agreement in the four risky watersheds with the Algebraic Product and there is a small differentiation in the order of ranking. There is also a 75% exact value equality between Drastic Product and the Algebraic Product in the case of the TRIAMF. The first conclusion from Tables 2 and 3 is that there exists a high compatibility between the Sigmoid and the Normal Distribution FMF and between the Trapezoidal and Triangular Membership functions. The T-Norms have their role but the FMFs are the features that determine the result. However, more or less, each FMF produces its own output. Which FMF should be trusted and which fits best in this case? In order to answer this question we have performed a comparative study between the TORRISDESSYS and three EHM and we have tried to analyse the cases with the highest compatibility.
5 COMPARATIVE STUDY Table 4 presents the percentage of compatibility between the Gavrilovic1 (G1), Gavrilovic2 (G2) Gavrilovic (Gavrilovic 1972) considers the average annual production of sediments, the average annual temperature, the average annual rain height of the watershed, its area, the kind of its geodeposition, the vegetation, the erosion of the watershed, and the calculation of the special degradation. The main difference between the G1 and the G2 methods is that G1 refers to the total area under examination whereas G2 refers to the average per km2. A closer look in Table 5 shows that the maximum compatibility is as high as 70% and the lowest 10%. The measure of compatibility is the percentage of agreement in the characterisation of the four most risky watersheds when the same area has been studied. The comparative test has not been performed to prove the efficiency of TORRISDESSYS: rather, we examine under which FMF and T-Norms the methods of G1, G2 and KK operate similarly to our model. This is due to the fact that these latter three models are mainly based on the load of sediments to estimate the Torrential risk, whereas our system considers several other dynamic and static risk factors which are not considered by them (e.g. the percentage of compact geological forms, the percentage of forest-cover) and it can be expanded to use as many risk factors as the user wants (as long as the data exist). What makes the TORRISDESSYS more effective, is the fact that, depending on the T-Norm used, it either considers the risk factors evenly in order to produce an average risk index (in the cases of the Hamacher or Einstein Products), or it assigns a very high or a very low risk index to watersheds having extreme values in one or more factors (in the case of the Drastic Product), or it considers mostly the minimum values (in the case of the Minimum T-Norm). This means that our model looks at the problem under various different perspectives, whereas the other EHM have a monolithic view of the Torrential risk. So, by using TORRISDESSYS one can estimate the most risky areas in a dynamic way. For example, an area that has a high percentage of
(Gavrilovic 1972, Kronfellner–Kraus (KK) methods and the TORRISDESSYS.
18
FBMIS Volume 1, 2008, 11-22 http://www.fbmis.info/A/8_1_IliadisL_1
ISSN 1740-5955 Copyright @ 2008 The FBMIS Group
forest-cover, after a major forest fire will be considered as highly risky by the Drastic Product whereas with the EHM it will still have the same DTR status. Table 4. Comparative test between the System and three EHM Compatibility Test T-NORM applied
Algebraic Product
MIN
Drastic Product
Einstein
Function
G1
Function
G2
Function
Kronfellner – Kraus
Triangular
45%
Triangular
55%
Triangular
40%
Trapezoidal
30%
Trapezoidal
70%
Trapezoidal
25%
Sigmoid
40%
Sigmoid
35%
Sigmoid
30%
Normal Distribution
30%
Normal Distribution
15%
Normal Distribution
35%
Triangular
50%
Triangular
45%
Triangular
30%
Trapezoidal
30%
Trapezoidal
65%
Trapezoidal
25%
Sigmoid
40%
Sigmoid
15%
Sigmoid
40%
Normal Distribution
45%
Normal Distribution
15%
Normal Distribution
40%
Triangular
25%
Triangular
45%
Triangular
15%
Trapezoidal
20%
Trapezoidal
50%
Trapezoidal
10%
Sigmoid
-
Sigmoid
-
Sigmoid
-
Normal Distribution
-
Normal Distribution
-
Normal Distribution
-
Triangular
50%
Triangular
55%
Triangular
40%
Trapezoidal
25%
Trapezoidal
70%
Trapezoidal
25%
Sigmoid
40%
Sigmoid
35%
Sigmoid
25%
Normal Distribution
30%
Normal Distribution
15%
Normal Distribution
35%
Triangular
50%
Triangular
55%
Triangular
40%
Trapezoidal
30%
Trapezoidal
70%
Trapezoidal
25%
Sigmoid
10%
Sigmoid
40%
Sigmoid
10%
Normal Distribution
30%
Normal Distribution
15%
Normal Distribution
25%
Hamacher
This means that the TORRISDESSYS locates the watersheds that are risky due to extreme values of one or more factors, and it also points the areas that have a high risk value due to the combination of the values of all the considered parameters. Our system has a completely different philosophy than the others, and that the levels of compatibility could not be much higher. We do not claim that our system is better, but it surely offers an innovative approach. The average compatibility between the G1 and the TORRISDESSYS is 34%, between the G2 and the TORRISDESSYS is 42.5% and between the Kronfellner–Kraus method and TORRISDESSYS is 29.5%. The average compatibility is low in all three cases, but in the best case it equals 70% and in the worst it is 10%, so there is a lot of variation. On the other hand when the Algebraic Product, the Einstein Product or the Hamacher product was used for the conjunction and the Trapezoidal MF for the estimation of the partial degrees of risk the system had a level of compatibility as high as 70% with the G2 method. This means that they agree in seven out of ten cases. It should be mentioned that the Trapezoidal MF combined with the MIN TNorm also has a high compatibility of 65% to the G2 model. This demonstrates that the TRAPMF combined with any type of T-Norm except for the Drastic Product, operates in many cases quite similarly to the G2 method.
19
FBMIS Volume 1, 2008, 11-22 http://www.fbmis.info/A/8_1_IliadisL_1
ISSN 1740-5955 Copyright @ 2008 The FBMIS Group
This does not mean that the Drastic Product approach (that has 50% compatibility with the G2 method) is not effective. The Drastic Product approach always assigns high risk indices to the watersheds having extreme values for some of their parameters. For example if an area has 0% Compact Geological forms this means that it has extreme value for this variable and thus the output of the Drastic product will give an extreme value for the URI. Obviously the low compatibility of the Drastic Product in most of the cases is due to the fact that it has a completely different perspective, which does not necessarily make it less effective for all scenarios. The compatibility between the Triangular and the G2 model varies from 45% to 55% which is not so bad considering the fact that the TRIAMF does not have a tolerance interval for the high membership values, but it offers only one peak instead. The comparison between the G1 and the TORRISDESSYS results shows that the agreement is the highest (50%) in the case of the TRIAMF regardless the T-Norm used. The comparison between the Kronfellner–Kraus model and the system shows that the Triangular MF is the closest one in all of the cases except when it is combined with the Drastic Product. In the case of the MIN T-Norm the Sigmoid MF and the Normal Distribution function are the closest ones to the Kronfellner–Kraus model with a level of compatibility as high as 40%. 5.1 Analysis of risky areas After the comparative study we have chosen the cases where the agreement of TORRISDESSYS with G1 or G2 or Kronfellner–Kraus is higher than or equal to 60%. This happens only in the case of the TRAPMF. Thus the most risky watersheds for the TRAPMF have been analysed according to their characteristics that make them risky for all methodologies. This effort aimed in identifying the profile of the streams that are characterised as risky regardless the applied methodology for both areas. The linguistic terms (eg. High watershed slope) correspond to fuzzy sets. For example for the property of average slope (AS) the following five fuzzy sets were defined. a) FS1 = “Very High AS watershed” b) FS2 = “High AS watershed” c) FS3 = “Medium AS watershed” d) FS4 = “Low AS watershed”. Thus, 25 fuzzy sets were formed, five for each factor. Table 5 shows that watersheds with code names B16, B28.4, B15 and B28.11 of Volvi area are identified as risky for all methods. They form two groups of two members each, with common characteristics. The first is characterised by a very high level of AAR (for Greek terms) a very high AS, moderate AA and small PFC (mainly covered by shrubs) and they are geologically very vulnerable by erosion. The second has moderate or high AS (lower than the previous one) high AA, high AAR and small PFC. The two groups have different percentage of AS and AA values whereas they share the same erosion vulnerability. Table 5. Four streams characterised as having high Torrential risk by all methods (Volvi area) Trapezoidal Membership Function – G2 Watershed code
Applied T-Norms
Morphometric and Hydrographic characteristics of mountainous watersheds
B16
Algebraic Drastic Hamacher
B28.4
Algebraic Drastic Hamacher
B15
Algebraic Drastic Hamacher
B28.11
Algebraic Hamacher
Very High watershed Slope = 30,00%, Moderate Average Watershed Altitude = 312,1m, High level of Rainfall = 502,5 mm, Shrub vegetation in the Watershed=100%, High erosion risk (geologically) Moderate watershed Slope = 17,00%, High Average Watershed Altitude = 591,2 m, High level of Rainfall = 598,77 mm, Low percentage of Forest Cover = 30%, Shrub vegetation in the Watershed = 40%, Agricultural Cultivation in the watershed=30%, High erosion risk (geologically). Very High watershed Slope = 36,67%, Low Average Watershed Altitude=263,6 m,High level of Rainfall = 485,75 mm, Shrub vegetation in the Watershed=80%, Agricultural Cultivation in the watershed=20%, High erosion risk (geologically) High watershed Slope = 28,00%, High Average Watershed Altitude = 542,9 m, High level of Rainfall = 582,11 mm, Shrub vegetation in the Watershed=90%, High erosion risk (geologically)
20
FBMIS Volume 1, 2008, 11-22 http://www.fbmis.info/A/8_1_IliadisL_1
ISSN 1740-5955 Copyright @ 2008 The FBMIS Group
Table 6 shows that the watersheds of the Koroneia area with code names K19 and K18 (which are the most risky ones) share exactly the same profile having very high AS, moderate AA, high level of AAR, and very poor vegetation, giving low PFC. Also in these areas the percentage of compact geological forms is very low. Watersheds K16 and K23 of the Koroneia area, have high (but less) AS, moderate AA, high AAR, low PFC and low PCGF. Thus they have less AS and even less forest cover percentage. They also have higher erosion problem than the areas of Vovli, due to the geological composition of the ground. Table 6. Four streams characterised as having high Torrential risk by all methods (Koroneia area) Trapezoidal – G2 Watershed code
Applied T-Norms
Morphometric and Hydrographic characteristics of mountainous watersheds
Κ19
Algebraic Drastic Hamacher Einstein Min Algebraic Drastic Hamacher Einstein Min Hamacher Einstein
Very High watershed Slope = 32%, Moderate Average Watershed Altitude = 383,8 m, High level of Rain fall= 527,2 mm, Shrub vegetation in the Watershed=90%, Agricultural Cultivation in the watershed=10%, Very high erosion risk (geologically)
Κ18
Κ16 Κ23
Hamacher Einstein
Very High watershed Slope = 32%, Moderate Average Watershed Altitude = 334,5 m, High level of Rain fall = 510,21 mm, Shrub vegetation in the Watershed=90%, Agricultural Cultivation in the watershed=10%, Very high erosion risk (geologically)
High watershed Slope = 22,67%, Moderate Average Watershed Altitude = 326,5 m, High level of Rainfall = 507,45 mm, Shrub vegetation in the Watershed=70%, Agricultural Cultivation in the watershed=25%, Very high erosion risk (geologically) High watershed Slope = 21,33%, Moderate Average Watershed Altitude = 331,3 m, High level of Rain Height = 509,11 mm, Shrub vegetation in the Watershed=80%, Agricultural Cultivation in the watershed=20%, Very high erosion risk (geologically)
From the analysis we have determined the profile of the risky areas. All of the above watersheds share some common properties. They have high slope values, high level of rainfall and their vegetation is quite poor, consisting mainly of shrubs. The percentages of agricultural cultivations and shrub vegetation increase their Torrential risk (Lu, 2001).
6 CONCLUSIONS The system produces similar characterisations in the cases of the trapezoidal and triangular MF and in the cases of Normal Distribution and Sigmoid MF. So there seem to be two different clusters of risky areas. The first is the cluster of the triangular-trapezoidal MF and the second is the cluster of the Sigmoid-Normal Distribution MF. The final determination of the most suitable and accurate cluster will become known through the years as our research goes on, comparing to the actual risky streams. From the comparative point of view the TRAPMF is the one that agrees up to 70% with the EHM. A very important aspect of the system is that it has been designed to use as many risk factors as possible, so it can be easily adjusted to incorporate more than five independent risk factors if data is available. This fact makes the DSS very flexible. As we have explained, the percentage of agreement of the TORRISDESSYS with the other methods is interesting but it is not a measure of the TORRISDESSYS’s validity. The existing and currently used methods do not agree with each other, but they are useful. The evaluation of the system will continue for several years, comparing the watersheds characterized as risky to the actual ones. It is a system that views the problem of torrential risk from different perspectives. The optimal MF and T-Norm for each area should be determined after years of testing and experience. A future extension of the DSS can be its integration with a GIS system that will output the results to a geographical Database (Portoghese,2005), probably operating in the web (Salewicz., 2004). Our final conclusion is that a new and very promising model-DSS has been developed and applied, but it is going to take some years of further research to evaluate the degree of its applicability and efficacy.
21
FBMIS Volume 1, 2008, 11-22 http://www.fbmis.info/A/8_1_IliadisL_1
ISSN 1740-5955 Copyright @ 2008 The FBMIS Group
REFERENCES Cox, E. (2005) Fuzzy Modeling and Genetic Algorithms for Data Mining and Exploration. Elsevier Science, USA, pp. 67-68. Date, C. J. (1990) An Introduction to Database Systems Volume 1. Addison Wesley, USA pp.526527. Gavrilovic, S. (1972) Inzenjering o bujicnim tovoklima i eroziji. Beograd, pp 67. Grohmann, C. H (2004) Morphometric analysis in geographic information systems: applications of free software GRASS and R. Computers & Geosciences, vol. 30, pp.1055-1067. Iliadis, L., Spartalis, S., Maris, F. and Marinos, D. ,(2004) A Decision Support System Unifying Trapezoidal Function Membership Values using T-Norms: The case of river Evros Torrential Risk Estimation. Proceedings of ICNAAM International Conference Numerical Analysis and Applied Mathematics J. Wiley-VCH Verlag GmbH Publishing co.Weinheim Germany, pp. 173-176. Kandel, A. (1992) Fuzzy Expert Systems. CRC Press, pp.24-25. Kecman,V. (2001) Learning and Soft Computing. MIT Press. London England, pp.373-374. Kotoulas, D. (1997) Management of Torrents Publications of the Aristotle University of Thessaloniki, Greece, vol. 1, pp. 270-272, Greek). Kronfellner, K. (1985) Quantitative estimation of Torrent Erosion. International Symposium on Erosion Debris Flow and Disaster Prevention. Tsukuba Japan, pp. 123 Leondes, C.T. (1998) Fuzzy Logic and Expert Systems Applications. Academic Press California USA, pp. 2-4. Lu, S.Y., Cheng, J.D. and Brooks, K.N. ,(2001) Managing forests for watershed protection in Taiwan. Forest Ecology and Management, vol. 143, issues 1-3, 1 April 2001, pp. 77-85. Nguyen, H. and Walker, E. ,(2000) A First Course in Fuzzy Logic. Chapman and Hall CRC, USA. pp. 1-15, 55-59. Portoghese,I., Uricchio,V. and Vurro,M. ,(2005) A GIS tool for hydrogeological water balance evaluation on a regional scale in semi-arid environments. Computers & Geosciences, 31, 15-27. Salewicz, K. A. and Nakayama, M. ,(2004) Development of a web-based decision support system (DSS) for managing large international rivers. Global Environmental Change, vol. 14, pp. 25-37. Tzionas, P., Ioannidou, I and Paraskevopoulos, S. (2004) A Fuzzy Decision Support System for the restoration of Lake Koronia. Proceeding of the HAICTA 2004 Conference, Thessaloniki, Greece, vol. 1, pp 85-94. Weingartner, R., Barben, M. and Spreafico, M. (2003) Floods in mountain areas – an overview based on examples from Switzerland. Journal of Hydrology, 282, pp. 10-24. Zacharias, I., Dimitriou, E. and Koussouris, T. (2003) Developing sustainable water management scenarios by using thorough hydrologic analysis and environmental criteria. Journal of Environmental Management, Vol. 69, pp. 401-412.
22