Georgia Sutherland and ..... If the user calls QUEST I insteadof QUEST, the machine .... determines the center of a molecular structure and causes two or.
12 HEURISTIC Generating in Organic
DENDRAL : a Program Explanatory Hypotheses Chemistry
for
B. Buchanan Georgia Sutherland
and
E. A. Feigenbaum Computer
Science Department,
Stanford
University
A computer program has been written which can formulate hypotheses from a given set of scientific data. The data consist of the mass spectrum and the empirical formula of an organic chemical compound. The hypotheses which are produced describe molecular structures which are plausible explanations of the data. The hypotheses are generated systematically within the program’s theory of chemical stability and within limiting constraints which are inferred from the data by heuristic rules. The program excludes hypotheses inconsistent with the data and lists its candidate explanatory hypotheses in order of decreasing plausibility. The computer program is heuristic in that it searches for plausible hypotheses in a small subset of the total hypothesis space according to heuristic rules learned from chemists. INTRODUCTION
.
The computer program described below resulted from an interest in studying scientific hypothesis formation as a decision-making process. To make progress on this broad and general problem, it seemed useful to choose a particular scientific task involving inductive behaviour and to explore it in as much detail as possible. The task chosen is in a well defined but relatively new and complex area of organic chemistry, namely the analysis of mass spectra of organic molecules. HEURISTIC DENDRAL is a computer program which generates molecular ‘graphs’ (i.e., structures) as hypotheses to explain the data produced by a mass spectrometer. The data produced when a mass spectrometer fragments molecules of a chemical sample can be interpreted as a list of masses of fragments paired P
209
MACHINE
LEARNING
AND
HEURISTIC
PROGRAMMING
100
80
60
40
20
I I 80
4-o
I
w
I
120
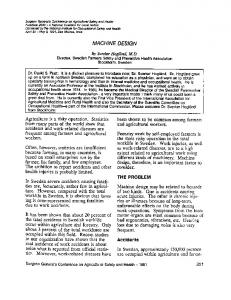
Composition: CsH160 0 II
Molecular Structure: CH3-CHp-C-CH~-CHP-CH~-CH~-CH~-CH~
Computer Representation of the Mass Spectrum: ((41 . 18)(42. 7)(43 . 100)(44. 3) (53. 3)(54. 1)(55 11)(56. 3) (57. 80)(58. 2)(70. I)(71 . 36) (72.44)(73. 5)(81 . I)(85 . 6) (86 2)(99 31)( 100 . 2)( 128 . 5))
Figure 1. The mass spectrum for 3-OCTANONE .
with their relative abundances. An example of a mass spectrum is shown in figure 1. By studying the resulting list of number pairs, chemists can infer the molecular structure of the chemical sample. Some of the decision processes which chemists use in making such inferences are incorporated into a computer program along with a structure-generating algorithm which provides a systematic approach to the problem of deducing sample. The computer program is HEURISTIC 210
the structure DENDRAL;
of a chemical and it is now
i
BUCHANAN,
capable of making restricted domain. The foundation
inferences for
SUTHERLAND
AND
from mass spectra to molecular
the HEURISTIC
FEIGENBAUM
structures
in a
DENDRAL
program is Lederberg’s of this algorithm). The algorithm gives a way of representing and ordering chemical molecules uniquely; thus it gives a method for generating all topologically possible molecules of a given composition without redundancy. It is a systematic and exhaustive topologist which can generate all non-cyclical graphs that can be
( 1964) DENDRALAlgorithm
.
made with the atoms
(section 7 contains a summary
of the composition,
knowing
no chemistry
other than
the valences of these atoms. The DENDRAL algorithm defines the hypothesis space in much the same way as a legal move generator for a chess-playing program defines the total move space within which good chess moves will be sought. The computer program is written in the LISP language on the PDP-6 computer at the Stanford University Artificial Intelligence Laboratory. It occupies approximately eighty thousand words of memory. Working with Professor Joshua Lederberg at Stanford, William Weiher and Willi developed the basic representation and wrote the initial program has also benefited greatly from the attention of me Stanford Mass Spectrometry Laboratory: Professors Carl Djer Robertson, Jerry Meinwald, and especially Dr Alan Duffield. the PRELI The program itself is segmented into five subprograms: INFERENCE
MAKER,
the PREDICTOR,
the DATA
ADJUSTOR,
and the EVALUATION
the STRUCTURE FUNCTION.
GEN
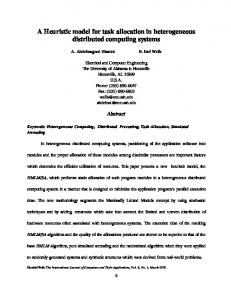
The interre
these
subprograms is shown in figure 2. The PRELIMINARY INFERENCE MAKER (described in section 1) a spectrum and determines what general classes of chemical subs are confirmed or disconfirmed by the data. All hypothesized generated later by HEURISTIC DENDRAL must contain all the substructures
(all
of which
are put
on a list called
GOODLIST)
structure may contain any substructure which is disconfirmed by trum. (All the forbidden substructures are put on a list called BA The DATA ADJUSTOR subprogram (described in section 2) choo ficant spectral peaks for the STRUCTURE GENERATOR to use for Order Theory. At present there are four independent ways of interp spectrum.
The STRUCTURE
GENERATOR
duced by the PRELIMINARY
(see
INFERENCE
section
3) uses the inform
MAKER
and the DATA
to produce a list of all topologically possible chemical struct consistent with the spectrum. The consistency criteria are the and ‘bad’ substructures and the Zero-Order Spectral Theory, des detail in section 3.2. The PREDICTOR subprogram is a rough model of a mass spectrom section 4). It is used to predict significant features of the mass s
MACHINE
LEARNING
AND
HEURISTIC
PROGRAMMING
v PREDICTOR (applied
to each candidate)
List of Predicted
Consistency Check
STRUCTURE GENERATOR
w List of Candidates whose predicted spectra are consistent with the original spectrum
W
List of Plausible Candidates EVALUATION FUNCTION
List of Candidate Structures ranked from most preferred to least preferred
Figure 2. General design of
HEURISTIC
DENDRAL
212
BUCHANAN,SUTHERLANDANDFEIGENBAUM
corresponding
to each
candidate
structure
output
by the
STRUCTURE
GENERATOR.
The EVALUATION FUNCTION (see section 5) compares each predicted spectrum against the original spectral data and assigns a score representing similarity of the two spectra. This enables the candidate hypotheses output by the STRUCTURE GENERATOR to be listed in order of their ‘plausibility’ or estimated degree of confirmation. An ideal program for deducing the structure of a chemical sample would output exactly one structure as the explanation for the spectral data. Up to now the usual case has been that several different structures are suggested as plausible explanations for the data. However, even a short list is a far better result than was obtained by the original program, which listed all the topologically possible structures and made no use of any real data at all. Because the constraints which have been included in the program to limit the search space are heuristic, nothing guarantees that the correct structure will not be bypassed. When a test run does fail, however, the program is modified after our chemist-informants study the output and analyze their own decision procedures. The purpose of this report is merely to describe the DENDRAL and to sketch some of our plans for current state of HEURISTIC future program developments. 1. THE
PRELIMINARY
INFERENCE
MAKER
The PRELIMINARY INFERENCE MAKER is conceptually very simple: it looks for the presence or absence of sets of peaks in a mass spectrum and updates GOODLIST or BADLIST, thus constraining HEURISTIC DENDRAL from generating large numbers of molecular structures as possible explanations of a given mass spectrum. By looking for patterns of peaks in the spectrum which are characteristic of some structural fragment, such as the keto group, this preliminary program can tell the STRUCTURE GENERATOR to concentrate on some fragments and to avoid others. It does this by temporarily putting desirable structures on GOODLIST (see section 3.5) and undesirable ones on BADL1s-r (see Section 3.3). The program has access to translations of Tables 1 and 2. As Table 1 indicates implicitly, this program knows the name, structure, valence, valence locations, empirical formula, and symmetrical atoms, as well as some characteristic peaks for several functional groups. It also recognizes priorities of groups, as Table 2 indicates. Addition of new information is simplified by a short routine (QUEST) which asks the chemist at the console for the essential information - and explains what it wants if he does not understand. An example is shown in Table 3. In this example the function QUEST is called to prompt information about identifying a new group, in this case the ester group. The lines preceded by asterisks are messages from the machine. Lines following a machine prompt (i.e., after a colon) were typed in from the console. This dialogue is much 213
MACHINE
LEARNING
AND
HEURISTIC
PROGRAMMING
functional group and characteristic subgraph A.
identifying conditions 1. There are 2 peaks at mass units xl &
KETONE
0 J-
B.
I. 2. 3. 4. 5.
MtTHYL-KETONE3
CH 3
C.
I. 2. 3. 4. 5.
ETHYL-KETONE3
CHJ-CH~-C-CH~-C-~I D.
I
N-PROPYL-KETONE3
0 !I CH3-CH2--CHz-C-CH2-C-CE.
ISO-PROPYL-KETONE3
I
?
I
I
1. 2. 3. 4.
x2 such that a. xl+x2=M+28 b. xl -28 is a high peak c. x2- 28 is a high peak d. At least one of xl or x2 is high Ketone conditions are satisfied 43 is a high peak 58 is a high peak M - 43 is a low peak M- 15 is low or possibly zero Ketone conditions are satisfied 57 is a high peak 72 is a high peak hG-29 is a high peak M- 57 is a high peak 71 is a high peak 43 is a high peak 86 is a high peak 58 appears with any intensity
1. 71 is a high peak 2. 43 is a high peak _7 . 86 is a high peak 4. There is no peak at 58
F.
1. M- 44 is a high peak 2. 44 is a high peak
ALDEHYDE
I
‘;
-c-CH
G.
ETHER
I -c-o-cl H.
I I
ETHER2
-CH2-0-CH2-
1.
METHYL-ETHER2
-CHz-O-CHj
J.
ETHYL-ETHER2
-CH2-0-CH2-CH3 K.
1. 12-I- 17 is absent 2. M- 18 is absent
PRIMARY-AMINE2
-CH?-NH2 Table 1. Important
I. Ether conditions are satisfied 2. There are 2 peaks at xl & x2 such that a. ~1~x2~ M+44 b. At least one of xl or x2 is high 1. 2. 3. 4. 1. 2. 3. 1. 2.
Ether2 conditions are satisfied 45 is a high peak M- 15 is low or possibly zero M- 1 appears (any intensity) Ether2 conditions are satisfied 59 is a high peak M- 15 appears (any intensity) 30 is a high peak No other peak is high
chemical croups and their identifying conditions
214
_.
,....
II
,_;_.
1_-.1-.--_..-
-
“_.
.I..
.^
BUCHANAN, furlctionalgrorrp and characteristic subgraph L.
SECONDARY-AMINE2
-CH2-N-CHz-
I
H M.
TERTIARY-AMINE2
-CH2-N-CH2I CH3
N.
ISOPROPYL-ZARY-AMINE2 CH3
-CH2-N-CH I H 0.
i
P.
ALCOHOL I
-C-OH I Q.
PRIMARY-ALCOHOL
-CH2-OH R.
C-2-ALCOHOL
OH I -CH-CH3
AND FEIGENBAUM
identifying conditions
1. There are 2 peaks at xl that a. xl+x2=M+43 b. At least one of xl or 2. 30 is a high peak 1. There are 2 peaks at xl that a. xl+x2=Mt71 b. At least one of xl or 2. 44 is a high peak 1. 44 is a high peak 2. 72 is a high peak 3. M- 15 is a high peak
& x2 such x2 is high & x2 such
x2 is high
’ CH,
ISOPROPYL-3ARY-AMINE2
-CH2-N-CH’ I CH3
SUTHERLAND
\
CH3
I. 58 is a high peak 2. 86 is a high peak 3. M- 15 is a high peak
CH3 1. M is low or possibly zero 2. Either M- 18 or M- 17 appears (any intensity) 3. A4-46 appears (any intensity) I. Alcohol conditions are satisfied 2. The 31 peak is approximately 10% 1. Alcohol conditions are satisfied 2. 45 is a high peak
Table 1. (contd.)
215
MACHINE A.
LEARNING
Family
AND
Trees: priorities
HEURISTIC
PROGRAMMING
within families Ketone
1. I Methyl-Ketones
I Ethyl-Ketones
2.
Propyl-Ketones
Ether I Ether 2 I I Methyl-Ether
I Ethyl-Ether
2
Ether 5
2
Alcohol
3.
I I
I C-2-Alcohol
Primary-Alcohol B.
Hierarchies
of families
Ketone > Ether (i.e., check Ethers only if the Ketone
tests fail).
Table 2. Family priorities
(QUEST) *THIS
PGM
REQUESTS
RADICALS
INFORMATION
ON GOODLIST
NON-APPEARANCE FORM
FOR
MISTAKE
YOUR
FUNCTION
*ANY
ANSWER
CAN
ON THE
SPECTRAL
TO ANY
YOU
“CHGPROPS”
(QUOTE *NAME 1
OF A FEW
IN A LINE
TO ALLOW
OR BADLIST
LINES.
REQUEST
CORRECT
OF ONE
THE
INFERENCE
STRENGTH IF YOU
TYPE
IT WHEN
ARGUMENT,
DO NOT
A QUESTION QUEST
THE
MAKER
OF THE
KNOW MARK.
IS DONE
GROUP
TO PUT
APPEARANCE
NAME.
BY
THE IF YOU
CALLING
E.G.,
OR PROPER MAKE THE
(CHGPROPS
KETONE)) OF FUNCTIONAL ATOMIC
GROUP
NAME
WILL
OR
RADICAL:
SUFFICE:
ESTER *PEAKS
WHOSE
?*THE
PGM
IT SHOULD
LOOK
1.
A NUMBER,
2. 3.
M (THE A LIST
3.1 3.2
ABSENCE
WANTS
INDICATES
A LIST FOR.
MASS
MOLECULAR OF THREE
THE SLASH
LETTER AND
THE
OF DOTTED
WT), ELEMENTS
UNITS
ABSENCE
PAIRS
MAY
OF THIS
INDICATING
BE SPECIFIED
GROUP: MASS-INTENSITY
AS
OR :
M MINUS
(OR
PLUS)
SIGN
3.3 ANUMBER(TOBESUBTRACTEDORADDEDTOTHEM). Table 3. Conveying information to the PRELIMINARY 216
INFERENCE
MAKER
PAIRS
A
BUCHANAN, INTENSITY 1.
2. 3. 4. 5.
UNITS
A NUMBER
MAY
BE SPECIFIED
BETWEEN
0 AND
THE
WORD
“ANY”
(ANY
THE
WORD
“LOW”
(INTEN
THE
WORD
“HIGH”
THE
WORD
“~oss0
FOR
EXAMPLE
((45. *PEAKS
((M
LIST
ABOVE
BETWEEN
0.)
O),
5 INCL),
0 AND
11 AND 100
BTW how
WOULD
-45).
/
FEIGENBAUM
INCLUSIVE,
INTENSITY
(INTEN
AND
AS
lo@
” (INTEN
THIS
HIGH)
SUTHERLAND
INCL),
0~
OR ZERO)
BE ACCEPTABLE:
(M
. LOW))
:
((45.0)
(60.0))
*PEAKS
SUFFICIENT
TO INDICATE
“SAME”
?*TYPE
CONDITIONS NO SUFF
IF THE
ARE
ALSO
CONDITNS,
CONDITION
SUFFICIENT, “??”
OR
LIST
THIS
GROUP
:
NECESSARY “NIL”
IF YOU
EXPLAINED
IF THERE
WANT
ARE
THE
:
SAME *STRUCTURE
IN LIST
INDICATE
ALL
NOTATION
:?
*TYPE
ATOMS.
HYDROGEN
A LIST (I
E.G.,
C(l
WHOSE
FIRST
ELMT
IS
1 AND
H)(lH)(lH))FORTHEMETHYL
RADICAL. *STRUCTURE
: (1
C(2 0) (1 o( 1 C)))
*VALENCE:?
*IF
ALL
WISE
TYPE
READING
A LIST THE
NO FREE
*LIST
OF SYMMETRIES: A LIST
((3 2 1)) ARE
BONDS
STRUCTURE
WITH *TYPE
FREE
OF NUMBERS YOU
VALENCE
ARE
ON ONE
ATOM,
TYPE
THIS
FREE
BONDS
INDICATING
HOW
THE
TYPED
LEFT
TO RIGHT,
FROM
NUMBER. ARE
OTHERSPLIT
IGNORING
ATOMS
2)
: (1 ?
OF THE
FORM
TO INDICATE
THAT
THE
FIRST
& THIRD
? *TYPE
A LlST
ATOMS
WITH
FREE
VALENCE
SYMMETRICAL:()
*PLACE
OF GROUP
OF THE
NEXT
(2) THIS GROUP (3), (4), . (N) LOWER
IN ITS
HIGHER
(ETHER
CONSISTING
OF (1)
THE
NAME
OR NIL
NAMES E.G.,
ETHER2
OF ALL FOR
NEXT
ETHERZ:
METHYL-ETHER2
ETHYL-ETHER2)
*PLACE
OF GROUP
IN ITS
:NIL
*THANKS
CALL
(CHGROPS
AGAIN
(QUOTE
ESTER))
*PROPERTY
TO CHANGE:
*PROPERTY
NAME
(TYPE
MEMBER
NAME
MEMBERS.
FAMILY
FAMILY:
FAMILY
? *DESCRIPTION
ONE)
NESS
LIST
OF PEAKS
WHOSE
SUFF
LIST
OF PEAKS
INDICATING
FORM
EMPIRICAL
VALENCE
A SINGLE
STRUCT
STRUCTURE
SYM
LIST
*PROPERTY: *VALUE:
IN LIST
THE
AS A LIST OR A VECTOR NOTATION
OF SYMMETRIES
VALENCE (1
3)
*REPLACE(R) (1 3) *PROPERTY
FORMULA NUMBER
ABSENCE
OR ADD TO CHANGE
(A)?
R
: NIL
DONE
Table 3. (contd.)
217
INDICATES
ABSENCE
PRESENCE
OF THIS
OF DOTTED
PAIRS
OF GROUP GROUP
UP,
MACHINE
LEARNING
AND
HEURISTIC
PROGRAMMING
shorter when the user knows the correct form for his response (and does not type a question mark). If the user calls QUEST I insteadof QUEST, the machine begins with the first prompt, bypassing the initial descriptive sentences. If the user wishes to change any information typed in previously, he calls the function CHGPROPS. The PRELIMINARY~NFERENCEMAKER isgivenasinputthespectrum,the empirical formula of the molecule, and a noise threshold to apply to the spectrum.1 The LISP function INFER accepts this information and controls the subsequent inferences about the presence or absence of the structural groups. The program performs the following three tests for each structure: I. Is the empirical formula of the structure compatible with the empirical formula of the molecule? If not, get the next structure. 2. Is any necessary condition falsified by the spectrum? If so, put this and get the next structure. structure on BADLIST 3. Are all sufficient conditions satisfied by the data? If so, put this structure on GOODLIST and get the next structure. Note: at present all sets of conditions are both necessary and sufficient. The Family
Trees shown in Table 2 reduce the effort of the PRELIMINARY and eliminate redundant effort in the STRUCTURE MAKER GENERATOR. When the spectral data indicate that a group is absent from the structure (resulting in the addition of this group to BADLIST), no lower members of the same family are even checked. On the other hand, if both a higher and a lower member of a family are indicated by the data (resulting in the addition of both groups to GOODLIST), only the lower, more specific, group is used. For example, if both of the subgraphs named ETHER and ETHERS are 011 GOODLIST, the program deletes the more general one, ETHER, since ETHER2 constrains structure generation more; that is, there are fewer isomers of a given composition containing INFERENCE
-CH2-0-CH2than there are which contain
I I -c-o-cThe family hierarchy list also reduces the effort of this program. If arzy member of the first family is on GOOD L JST, no members of the second family are even checked. In the cases of the general Ketone, EtheR, Secondary-Amine2, and Tertiary-Amine2 subgraphs, the preliminary inference maker can, in fact, isolate the position of the functional group as well as determine which 1 Spectral peaks are deleted if their amplitudes are lower than the threshold. This option has not yet been exercised since it may confuse the inference maker. A threshold value of 1 bypasses this option. 218
BUCHANAN,SUTHERLANDANDFEIGENBAUM
functional group is present. It cando this because of highlyfavourable alphacleavage (cleavage of the bond between the carbon atom attached to the heteroatom and the rest of the molecule) which is an identifying condition for each of these subgraphs. For example, in the ketone shown below, the program can tell that the keto radical (C=O) is between some C3H7 structure and some C4H9 structure, even though it cannot specify terminal radicals uniquely. 0 CH3\C”&-/CH3 CH3/
\CHz-CH3
This positional information is passed to the STRUCTURE GENERATOR'S partitioning routine which is discussed in section 3.4. The effect in this case is that the only ketones which will be generated are those with the keto group bounded by three carbon atoms on one side and four carbon atoms on the other. (INFER
(QUOTE
~8~160)
S :
09046
1)
*GOODLIST=(*ETHYL-KETONES*) *BADLIST=(*C-2-ALCOHOL* ETHER2*
*ETHER2*
*PRIMARY-ALCOHOL* *ALDEHYDE*
*ALCOHOL*
*ETHYL-ETHER2* *ISO-PROPYL-KETONE3*
*METHYL*N-PROPYL-
KETONE3* *METHYL-KETONE3*) ________________________________________-------------------
(JULY-4-1968
VERSION)
C2*ETHYL-KETONE3*H8 MOLECULES
NO DOUBLE
1.
CH2..
2. 3.
CH2..
CH..CH3
CH2..
CH2.CH..CH3
BOND
EQUIVS
c=.oc2~5,
CH2.dHT
C2H5
C=.O ~2~5, CH3 C==.Oc2~5,
DONE
s:Q9Q46 ((41.. (55.. (72..
(100..
18.)(42..7.)(43.. 11.)(56..3.)(57..80.)(58.. 44.) (73.. 5.) (81..
2.) (128..
100.)(44..3.)(53..3.)(54..1.) 1.)(71.. 2.)(70..
1.) (85. . 6.) (86. . 2.) (99..
36.) 31.)
5.))
Table 4. Example from the
PRELIMINARY
INFERENCE
MAKER
Although the chemical heuristics used in this program are more like suggestions than rules, they have demonstrated their usefulness in a number of trials. The results of one of these trials appear in Table 4. The dashed line separates the iines printed by the PRELIMINARY INFERENCE MAKER from the lines printed by the STRUCTURE GENERATOR. The complete output for this example is discussed in detail in section 6. In this case, total output is reduced from 698 isomers’ to 3 isomers as a result of applying the PRELIMINARYINFERENCEMAKER.
1The number of chemically stable acyclic structures with empirical formula CsHt60 is 698; the total number of topologically possible graphs which satisfy just the valence restrictions is 790. Section 3 discusses the program which generates these structures.
219
MACHINE
LEARNING
AND
HEURISTIC
PROGRAMMING
The program was given the mass spectrum and empirical octanone. S:O9046 is the mass spectrum for the structure:
formula
of 3-
0 II c-c-c-c-c-c-c-c The first output structure is the correct structure for this spectrum. The rest of the output structures are other ethyl-ketones, because of GOODLIST. 2. THE
DATA
ADJUSTOR
The DATA ADJUSTOR subprogram determines which mass points of a real spectrum are significant enough to be used by later programs. This process is separable into three steps: 1. Determine the mass of the molecular ion (M). If this number is not in the real spectrum, insert it with large amplitude. 2. Delete peaks at impossible mass points. Specifically, delete peaks at 1, 2, . . .) 10, 11, 19,. . .) 23, M- 1, M-2, . . ., M-23. 3. Delete all but the most significant peaks. Significance has to be decided without knowledge of the molecular structure of the sample producing the spectrum. Four methods of determining significance are included at present, with the choice of method being left to the program user. (i) The Threshold Method selects those mass points which have amplitudes higher than a certain number. (ii) The Biemann Method selects the two mass numbers with highest amplitudes in each interval of 14 mass numbers. (iii) The Lederberg Method selects the n mass numbers with highest amplitudes. The number n depends upon the number of atoms in the chemical composition. n=--12(count 1 I)- 1 5 (iv) The fourth method allows the user to specify the number of mass points to be used (the n highest peaks). Each of these four methods reduces the real spectrum to a set of mass numbers judged to be the ‘significant peaks’ in the data. This revised spectrum is then given to the STRUCTURE GENERATOR which treats it as the data to guide the process of generating structures. The data-adjusting routine is invoked by calling the function REALSPEC with three arguments. The first two arguments specify the composition and the spectrum. The third argument indicates which method to use. The four possibilities for the third argument are: (i) --m (ii) T (iii) NIL (iv) n
-
use threshold m use Bieman’s method use Lederberg’s method take the n highest peaks. 220
BUCHANAN,SUTHERLANDANDFEIGENBAUM
The relative merit of these methods has not been determined. In the examples processed so far, it appears that the STRUCTURE GENERATOR needs only a few of the mass points in a typical spectrum. 3. THE
STRUCTURE
GENERATOR
The DENDRAL Algorithm described in section 7 is a procedure for generating all of the topologically possible acyclic structures (isomers) of a chemical composition. This algorithm is based on a canonical notation for chemical structures and an ordering procedure which determines which of two canonical structures is ‘higher’. GENERATOR is a computer program implementing the The STRUCTURE DENDRAL algorithm but with the inclusion of heuristic constraints to prevent the program from generating structures which are incompatible with chemical theory or mass spectral data. Applying these constraints in the course of structure generation greatly increases the efficiency of the program, decreasing amount of output and total run time by several orders of magnitude. The STRUCTURE GENERATOR is designed to solve the following problem: GIVEN: a list of defined atoms with their valences and weights a composition (empirical formula) a spectrum (mass numbers only) a list of likely substructures a list of impossible substructures TASK: generate all structures compatible with the given data. If there are no data-oriented lists of likely or impossible substructures and no spectral data, the program generates all structural variants (isomers) of the given composition. INSTRUCTIONS:
1. Make certain that the composition is compatible with the spectrum, if there is one. 2. Consider only those structures which have exactly the types and amounts of atoms specified by the composition. 3. If certain substructures are required, remove their atoms from the composition and insert the name of a ‘superatom’ to represent that substructure. Be sure the superatom substructure is compatible with the spectrum. After generating a structure containing superatoms, translate superatoms into the original substructures before printing the output. 4. If the partitioning option is to be exercised, consider all subgroupings (partitions) of the composition. Determine whether a given partition is ‘plausible’. Generate only those structures which come from plausible partitions. 5. Generate substructures to combine into isomers. The isomers must contain no forbidden substructures; and each substructure must be compatible with the spectrum, if there is one. 221
hlACHINE
LEARNING
AND
HEURISTIC
PROGRAMMING
6. Provide the user of the program periodic opportunities to observe and change the direction of structure generation. (Optional) 7. Remember past work. (Optional) The mechanisms sections. 3.1.
Brief
for following these instructions
description
of the structure-generating
are described in the following
algorithm
The basic steps for generating chemical structures are to generate radicals (structures with a free bond) and to connect radicals to make larger structures. Radicals are generated recursively from a composition list of atoms by deciding on the first atom (apical node) and free bond (afferent link) and then making one or more radicals out of the remaining composition. The function GENRAD~ constructs a single radical by this method; MAKERADS constructs two, three, or four radicals from a single composition; and GENMOL determines the center of a molecular structure and causes two or more radicals to be constructed to attach to the center. takes a radical and returns the next higher radical The function UPRAD which can be made from the same elements. UPMOL does the same for molecules. The function ISOMERS causes all the structures for a given composition to be generated and printed in ascending canonical order. The program’s constraints are controlled by a number of switches (global variables) which are pre-set before calling Is OM E R s. The switches are named : SPECTRUM,GOODLIST,BADLIST,NOPARTS,DIALOG,DICTSWITCH, and OUTCONTROL. Individual constraints may be bypassed at the discretion of the user of the program. When all constraints are turned off,the STRUCTURE GENERATOR becomes a routine graph maker, generating an exhaustive list of all possible acyclic graph structures of n nodes, where different nodes may have different numbers of links (valence). The switch settings for unconstrained program operation are: (SETQSPE~TRUMNIL) (SETQGOODLISTNIL) (SETQBADLISTNIL) (SETQNOPARTST) (SETQDIALOG(QUOTEOFF)) (~ETQDICT~WITCH(Q~~TEOFF)) (~ETQ~~T~~NTR~L(Q~~TEoFF))
1 The LISP functions which perform certain operations will be identified in this report. To simplify the discussion, however, their arguments and operation will not be discussed. A separate paper lists all LISP functions contained in the STRUCTURE GENERATOR and outlines their use. 222
BUCHANAN,SUTHERLANDANDFEIGENBAUM 3.2.
The SPECTRUM
and the Zero-Order
Theory
of Mass
Spectrometry
The SPECTRUM corresponding
ofthe STRUCTUREGENERATOR isasinglelistofnumbers, to significant mass numbers in the real spectrum. The DATA ADJUSTOR sub-program provides the STRUCTURE GENERATOR with this list of numbers, all of which have equal importance as far as the STRUCTURE GENERATOR is concerned. The SPECTRUM is consulted to confirm the presence of compositions and radicals. The first reference to SPECTRUM is by the function ISOMERS which must make certain that the mass of the input composition is present. If it is not, then no structures can be generated for that composition. Any smaller composition can be made into structures if it is not inconsistent with the ZeroOrder Theory described below. This constrains the program to consider only those sub-compositions which have some promise of leading to structures compatible with the SPECTRUM. The Zero-Order Theory assumes that every bond of a structure to which it applies will break (one bond at a time) and that at least one of each pair of substructures obtained from a single break will contribute its mass to the spectrum. The Zero-Order Theory does not apply to double bonds, triple bonds, or bonds leading to certain small structures. That is, in order for a structure to be consistent with the Zero-Order Theory, at least one of the following conditions must be met; 1. 2. 3. 4. 5.
The The The The The
structure contains exactly one atom other than hydrogen. afferent link is greater than 1. mass of the structure is less than 30. mass of the structure is in the SPECTRUM list. complement mass of the structure is in the SPECTRUM list.
This Zero-Order Theory mented. A more elaborate (section 4), but obtaining sumes more computer time
of Mass Spectrometry is crude but easily implespectral theory is contained in the PREDICTOR such a spectrum for an arbitrary structure conthan would be practical in a program such as the STRUCTURE GENERATOR. The Zero-Order Theory is sufficient to limit the output of the STRUCTURE GENERATOR to a small class of hypotheses, but it will need major revisions before it can be classed as a ‘smart’ limiting heuristic. To make use of spectral information in the STRUCTURE GENERATOR it is merely necessary to execute (SETQ SPECTRUM L) where L is a list of integers, corresponding to the desired mass numbers. To terminate use of spectral information, execute (~ETQ SPECTRUM NIL). When structure generation is proceeding in the presence of a SPECTRUM, the work that is remembered for future reference (see section 3.7 describing the dictionary) is independent of the spectral data, so it is permissible to use several different spectra in succession in the same program core image. 223
MACHINE 3.3.
LEARNING
Preventing
the
AND generation
HEURISTIC of forbidden
PROGRAMMING substructures
Some chemical structures never exist, either alone
are so implausible (unstable) that they would or imbedded within any larger structure. The STRUCTURE GENERATOR has a list (BADLIST) of these implausible structures; and no output of the STRUCTURE GENERATOR will contain any substructure on BADLIST.* The STRUCTURE GENERATOR avoids generating structures containing forbidden substructures by checking rigorously before attaching new atoms to a piece of structure. At every step in generating a radical, the program knows the partially built structure and can determine whether the atom and bond which are about to be attached to it will include one of the forbidden substructures. The following process insures that no forbidden structures will be formed: 1. The partial structure is guaranteed to be plausible because of previous checking. 2. Form the new partial structure by adding the next bond and atom. 3. Consider all elements of BADLIST which have a top atom identical to the atom just added to the partial structure. 4. For each such element of BADLIST, compare the radicals which are attached to the top atom of the new structure with the radicals attached to the top atom of the B A D L IST structure. 5. If every radical on the BADLIST structure is found in the list of radicals on the new structure, then the new structure must be rejected. 6. Rejecting a structure means that it is necessary to change either the added bond or the additional atom (or both) in order to generate an allowable structure. GENERATOR from creating Note that this process prevents the STRUCTURE many implausible molecules, since the addition of each new node causes a check to be made for forbidden substructures including that node. Usually only part of the structure has been generated because unallocated atoms are added only to stable pieces. Each forbidden substructure appears on BADLIST several times, once for each possible top (apical) node. Structures are added to or removed from BADLIST by the function FIXBADLIST, which first generates all the forms of the forbidden substructure, and then adds to or deletes from BADLIST according to the desire of the user. Naturally if there are no structures on BADLIST then there are no constraints on the output of implausible StrUCtUreS.
1 As described in section 1, BADLIST may be expanded according to given spectral data. The permanent part of BADLIST belongs to the program’s theory of chemical instability. But substructures of both the theoretical and the context dependent parts of BADLIST are treated alike.
224
BUCHANAN,
SUTHERLAND
The current form of B AD L 1ST has been suggested the following loop: suggest forbidden generate output. inspect output.
AND
FEIGENBAUM
after several iterations
of
substructures.
The currently forbidden substructures are listed in Table 5. Hydrogen atoms must be specified explicitly, and lists of atoms enclosed in parentheses indicate that any member of the list may be used in that position on the substructure. 1.
I b
C =C-(
N,O)-H
C~32-
(N,O)-H
2. 3. 4. 5. 6. 7. 8. 9. 10.
G-0 (N,O)--(W)-(W) 0-s s-s-s
11.
H-N-C-N/::
12.
( N,o)-C-O-H
N=N-(N,O,H) H-o-C-(
N,O)-H
H-C-N=0 N=C-O--H
\ ANY
II 0 Table 5. Forbidden substructures comprising BADLIST
3.4.
Partitioning
a composition
into
plausible
sub-compositions
The unconstrained structure-generating algorithm produces molecules by first determining the center of the structure (bond or particular atom) and then generating all possible radicals out of the remaining composition and attaching them to the center in all possible combinations. When all possible centers have been considered, the process of structure generation is complete. The task of generating a set of n radicals from a single composition requires that the composition be divided (partitioned) into n subcompositions. Then a radical is generated from each smaller composition. All possible partitions are considered in the unconstrained program, regardless of whether the sub-compositions are ‘plausible’ or compatible with a spectrum. The lowest partition is considered first, where ‘lowest’ means that it has two sub-compositions, of equal size if possible, and with the lowest ranked atoms all in one of the compositions (where the arbitrary ranking Q
225
hlACHINE
LEARNING
AND
HEURISTIC
PROGRAMMING
from carbon to sulfur is: CO). Since fragment ions, as well as the molecular ion, may eliminate neutral molecules or rearrange atoms to form more stable ions, the program must be able to predict the most significant occurrences. After the program calculates the mass of a fragment and the relative frequency of its ionization, it checks the fragment for elimination and rearrangement possibilities. Exactly the same procedure is used as for the molecular ion, but the list of characteristic subgraphs may be different depending on the functional groups present in the molecule. Table 8 lists the different possibilities now in the program. Thus the program examines each bond to calculate the probability of cleavage and each fragment to calculate both the probability of ionization and the possibility of rearrangements. In addition, it has already calculated a molecular ion peak and has looked for the possibility of eliminations and rearrangements in the molecular ion. By the time it has finished, it should have calculated a list of mass-intensity pairs corresponding to the most significant peaks in the actual mass spectrum for the same molecule. To conform to common practice, mass units below 29 are deleted and the intensities are converted to percent of the highest peak (base peak). Some annotated examples of predicted spectra appear in section 4.3 together with the actual mass spectra for the same molecules. Section 4.4 explains how to use the program; and section 4.5 explains the options that are available from the console. 4.2.
Rules
for calculating
relative
intensities
of primary
fragments
Cleavage of Single Bonds between Carbon Atoms. Under special conditions the program bypasses the general rule for calculating intensities of fragments given below. Thus, before stating the general rule, which is relatively complex, the exceptions will be noted.
A. Exceptions
1. Assign zero as the intensity of the two fragments when considering the bond between CHz and CHs; that is, do not break off a methyl which is part of an ethyl. This rule is preempted by the special rules of Table 6 for significant radicals. For example, the methyl radical will be lost in this molecule 239
MACHINE
LEARNING
AND HEURISTIC
PROGRAMMING
R-N-CH&CH3 I H [test function METHYLP]. because this is cc-cleavage in an amine. 2. Assign zero as the intensity of both fragments when considering a vinylic bond; that is, do not break bonds which are adjacent to double bonds. The [function VINYLIC]. rules of Table 6 preempt this rule also. 3. Assign zero as the intensity of all primary fragments of ketones, aldehydes, amines, ethers, thioethers, and alcohols except for the fragments resulting from the rules of Table 6. 4. For x-cleavage in amines, ethers, and thioethers, calculate the intensity of the heteroatom-containing fragment as a function of (a) the degree of substitution of the first carbon atom of that fragment, and (b) the number of carbon atoms lost. Specifically, the intensity is the sum of two factors Xr and 12 where XI =0 if 3 or 2 hydrogens are attached to the first carbon, 30 if 1 hydrogen is attached, or [function AMINESUBST] 45 if 0 hydrogens are attached. Xz= 3 if 2 or 1 carbon atoms are lost, IO if 3 are lost, or [function AMINECARBS]. 15 if 4 or more are lost. B. The General Rule The general rule for calculating the intensity of each fragment resulting from dissolution of the bond between two carbon atoms is 1=(21+22+Z3+Wl) x W2x W3x W4 The Z-factors are context-dependent factors. That is, it is necessary to look at features of both fragments (the total context) in order to calculate each Zfactor. The W-factors are context independent, which is to say that each one can be calculated by looking only at the fragment under immediate consideration. 1. Zl is calculated in two steps according to the number of non-hydrogen atoms alpha to the bond under consideration: (a) Compute a factor (Tl ) which is equal to the sum of intensities of both fragments (estimated probability that this bond will break given this information): Tl = 10 if there are 0, 1, or 2 branches to non-hydrogen atoms, 3 branches . . ., 12if... 4 branches . . ., 16if.. . 5 branches . . ., 18if... 6 branches . . . . [parameter list TINLTH] 20if.. . (b) Compute a ratio for splitting Tl between the two fragments (relative probability that each fragment will be ionized as a result of this break given this information) : 240
.
SUTHERLAND AND FEIGENBAUhl
BUCHANAN,
ratio = 1: 1 if the difference is 0, 5: 7 if the difference 1: 3 if the difference 1: 5 if the difference
I
between
the number
. . , is 1, . . . is 2, . . . is 3. [parameter
of non-hydrogen
branches
list RINLTH]
The ratio is weighed in favor of the fragment with more alpha branches. Zl for each fragment is then the result of applying this ratio to T 1. [function LcALc] 2. 22 is calculated in a similar two-step manner, this time taking into account the number of heteroatoms (non-hydrogen, non-carbon atoms) alpha to the bond under consideration: (a) Compute a factor (T2) which is equal to the sum of intensities of both fragments (estimated probability that this bond will break given this information): T2 = 0 if there are 0 branches to non-hydrogen, non-carbon atoms (heteroatoms) from both of the carbon atoms, 3if... 1 branch. . ., 2 branches . . ., 10if.. . 3 branches . . ., 20if.. . 4 branches . . ., 30 if. . . 5 branches . . ., 40 if. . . 6 branches. . ., [parameter list TINcoN] 50if.. . (b) Compute a ratio for splitting T2 between the two fragments (relative probability that each fragment will be ionized as a result of this break given this information): ratio = 1: 1 if the difference between the number of branches to heteroatoms is 0, 3: 10 if the difference . . . is 1, 1: 9 if the difference . . . is 2, 1: 19 if the difference . . . is 3. [parameter
list RINcoN]
(again, weighted in favor of the fragment with the more branches). 22 for each fragment is then the result of applying this ratio to T2. [function CONTIGHET] 3. Z3 is an attempt to integrate the principle that longer carbon chains are lost preferentially to smaller ones. The longer a carbon chain in a fragment, the higher the probability that the molecule will split apart at that bond. Also, though, the long-chain fragment is less likely to be ionized than the other fragment at this break-point. So 23 is calculated for fragment # I at a break-point as a function of the chain length of fragment #2. [function CHAINLTH] Currently the function just multiplies the chain length by two [the value of CHFACT] although this parameter, like every other in the program, can be easily changed. R
241
MACHINE LEARNING
AND HEURISTIC
PROGRAMMING
The next factors in the intensity calculation for any fragment are contextindependent. The program considers only features within the fragment, first on one side of the bond under consideration, then on the other. 4. Wl is equal to the number of heteroatoms in the fragment. The program now simply counts the number of occurrences of non-hydrogen, non-carbon atoms, although it could return some function of the count. [function NHET] 5. W2 attempts to capture the principle that in a fragment the types of heteroatoms alpha to the bond under consideration greatly influence the probability that the fragment retains the charge (is ionized) when this bond is broken. That is, the program looks at atoms in the place occupied by X in the following schema and assigns W2 by the accompanying rule: -J-A+A
I
**-
W2=5[FHETN] if Xis Nitrogen, 4[FHETS] if X iS Sulfur, 3[FHETO] if X is Oxygen, ~[FHETCL] if X is Chlorine, 1 otherwise.
[function
HETERO]
6. W3 is a similar factor taking account of certain heteroatoms doubly bonded to the carbon at the break-point. The program looks at atoms in the X-place in the schema and assigns W3 by the following rule: X
-J-A-
. . . I w3=4[FCARBN] if Xis Nitrogen 3[FCARBO] if Xis Oxygen z[FCARBS] if XiS Sulfur 1 otherwise.
[function
CARBONYL]
Thus for a bond connecting two carbon atoms in the molecule, the intensities of the two fragments depend upon the context-dependent and contextindependent factors (the Zs and Ws) as just described. The atoms closest to the bond have the greatest effect, but two of the factors (23 and Wl) depend upon atoms farther away from this bond. 7. W4 is a factor which attempts to capture the favorable influence of allylic bonds on the fragmentation process. For example, in fragment (a) below the bond marked with an asterisk is an allylic bond (relative to the double bond of the fragment) and thus increases the probability of fragmentation to produce fragment (a). --“C--CzC-R [function ALLYLIC, (4 parameter KALLYLIC] 242
1
BUCHANAN,
SUTHERLAND
AND
FEIGENBAUM
Cleavage of Carbon-Heteroatom Bonds. For a single bond between a carbon atom and a heteroatom, several of the same calculations are made as for carbon-carbon bonds. In accordance with existing theory, the carboncontaining fragment is much more likely to be ionized as a result of this cleavage than the other one. (In rearrangement products, however, the heteroatom-containing fragment often retains the charge; see the amine entries of Table 8 for example.) But this bond is less likely to be broken than a single bond between two similar carbon-containing fragments. A. Exception. A bond between a carbon and hydrogen atom breaks if this is an a-cleavage in an amine. For example,
H I HfC-N-R
i
H
I
H
B. The General Rule.
containing
fragment Ic=Z4xZ5x
The equation for calculating at a C-X break is:
the intensity
of the carbon-
w5.
As before the Zs are context-dependent factors and the W is context-independent. For the heteroatom-containing fragment the intensity is merely: z,=z4.
1. 24 is directly analogous to the factor Zl for carbon-carbon bonds. The carbon-containing fragment resulting from such cleavage ordinarily should have a smaller intensity than the corresponding fragment in cleavage of a carbon-carbon bond. The program accounts for this in the first two steps for calculating 24. (a) Compute a factor (T4) which is to be equal to the sum of the intensities of both fragments: T4 = the intensity which would be assigned to the carbon-containing fragment in a similar carbon-carbon bond environment. (The program ‘pretends’ that the heteroatom is a carbon atom and computes T4= ((Zl +Z2+23+ Wl) x W2x W3) as above for the intensity to be divided between the two fragments.) (b) Compute a ratio for splitting T4 between the two fragments according to the number of heteroatoms in the carbon-containing fragment which are alpha to the bond under consideration: ratio= 10: 1 if the number of heteroatoms attached to this carbon atom is 0 20: 1 if the number 30: 1 if the number 40: 1 if the number
of heteroatoms of heteroatoms of heteroatoms 243
. . . is 1 . . . is 2 . . . is 3
MACHINE
LEARNING
AND
HEURlSTlC
PROGRAMMING
(weighted in favor of the carbon-containing fragment). 24 for each fragment is then the result of applying this ratio to T4. The smaller intensity is returned for the non-carbon fragment. [function LcALcx] For the carbon-containing fragment two additional context-dependent factors Z5 and W5 are calculated. The intensity for this fragment is the product z4xz5
x ws.
2. W5= ~[FHETN]
if nitrogen point ~[FHETS] if sulphur . 3[FHETO] if OXygeIl . 2[FHETCL] if chlorine 1 otherwise.
Rearrangement
of
to the carbon
. . . . . . . [function
HETERO]
H&-R
-H2C-A-RI
Amines
at the break
allocation of intensity units of the parent ion [and parameter names] subgraph Kl oAof parent’s K2’? of parent’s skeleton of daughter ion intensity intensity (for parent) (for daughter)
characteristic
we
is singly bonded
I
I
R2
[KAMjOLD]
H
80
100
[KAM3NEW]
(Check degree of substitution and number of carbon atoms in Rl and R2 to see which drops away) --H&X--R 100 [KAMZOLD]
Rearrangement Ethers and Thioerhers
McLafferty Rearrangement
80 [KAMZNEW]
of --H&--R
100
(X=O,S)
[KAM20LD]
x+ 11
40 [KMCOLD]
80 [KAMbJEW]
(Biemann)
+x
60
z
80 [KFOLD]
20
x
-1X
[KFNEW]
(X=C,O,N,S)
Type G (Biemann )
GH !: .‘\
H I
I c-c-c
H&H
[KMCNEW]
Z&,-Z (X = C,N,O,P,S) (Z = C,H,N,O,P,S) Type F
+ H2C=NH2
I
HC
H I c-&=c
20
[KGOLD]
80
[~o~sw]
+N=C
I H
Table 8. Rearrangements
for fragment ions 244
BUCHANAN,SUTHERLANDANDFEIGENBAUM
3.
25 = 5[ KINDCL] ~[KINDBR] ~[KINDI]
if the heteroatom X at this C-X if the heteroatom . . . is bromine, if the heteroatom . . . is iodine [fUI&On
1 otherwise
breaks is chlorine oxygen or sulphur
INDUCTIVE]
The next section shows some examples with brief explanations of the PREDICTOR'S work. Whenever a chemist finds major discrepancies between predicted and actual spectra, we try to localize the contributing functions or parameters and change them. The specialized rules of Table 6 and Table 8 in particular, directly resulted from finding major errors in predictions for ketones, amines, ethers, and alcohols. Instead of adjusting the core of the theory in these cases, however, special tests and branches were added. At a later date, we hope to be able to reunify the PREDICTOR'S theory. 4.3.
Examples
The command DRAW in each case started the predictor’s work on the indicated structures. The list of number pairs following the command is the output from the program: the mass-intensity pairs of the most significant ionized fragments. Example
A
(DRAW
(QUOTE
c211Ocl cl ccl cl cl c$)) ((43. 100) (57. 88) (58. 22) (71 . 100) (85. 88) (86. 22) (128. The graphical representation for this molecule, 4-octanone, is
14))
0 II H$--CHz-CH2-C-CHz-CH2-CH2-CHZ-CHs The mass spectrum for this compound Spectrometry Laboratory is
from the Stanford
University
Mass
((41 . 48) (42. 8) (43. 100) (44. 3) (53. 2) (55. 8) (56. 2) (57. 92) (58 . 56) (59 . 2) (64. 1) (67. 1) (69 . 3) (70. 1) (71 . 91) (72. 4) (81 . 1) (83. 1) (84. 1) (85. 60) (86. 23) (87. 2) (99. 3) (113. 2) (128. 13) (129. 1)) The molecular ion has mass 128. The two other even numbered peaks of high intensity, 86 and 58, are the results of the McLafferty rearrangement of the molecular ion (twice). The peaks at 85 and 71 result from alpha-cleavages, in each case with only the heteroatom-containing fragment retaining the charge. The peaks at 57 and 43 come from loss of carbon monoxide (mass 28) from each of the alpha cleavage fragments. The remaining peaks in the actual spectrum are of little informative value to chemists, thus they remain unpredicted. Several of these could be regarded as isotope peaks and thus could have been predicted (by setting IPEAKS = T). Example
B
(DRAW(QUOTE~~~IC~NI~~~~~~~$))
((30.
17) (44.
80) (72.
21) (100.
100) (115 . 2)) 245
MACHINE
LEARNING
This molecule H3C\ HE/
AND
HEURISTIC
is graphically
represented
PROGRAMMING
as
CH - N - CH2 - CH;! _ CH2 - CH3 1
and its actual mass spectrum tory) is
(from the Stanford
Mass Spectrometry
((41 . 38) (42. 21) (43. 25) (44. 88) (45. 2) (54. (57. 13) (58. 16) (70. 11) (71. 4) (72. 100) (73. (98. 3) (100. 61) (101 . 4) (114. 2) (115. 5))
1) (55. 4) (84.
Labora-
3) (56. 2) (85.
8) 2)
The molecular ion is of mass 115. Alpha-cleavage accounts for the peaks at 100 and 72, in each case with only the nitrogen-containing fragment retaining the charge. The amine rearrangement shown in Table 8 affects each of the alpha-cleavage fragment ions resulting in the peaks at masses 44 and 30. In the actual spectrum, peaks below mass 41 were not recorded, but it is not unreasonable to believe that the peak at mass 30 would be a strong peak. Some of the other discrepancies may be due to isotope peaks; many of the rest from lack of rules for amine fragmentation processes. 4.4.
Using
the
mass
spectrum
To run the program, once This function requires one string which represents the example, either (a), or (b) glycine:
PREDICTOR
it is in core, call the top level function DRAW. argument, a name of the qUaSi-DENDRAL symbol molecule whose spectrum is to be predicted. For below would serve for predicting a spectrum for
HO-C-CHz-NH2: 6
(a) (DRAW (QUOTE c12loocl N$)) (b) (SETQGLYCINE(QUOTE cl2loocl~$)) (DRA~GLYCINE) @ISi-DENDRAL
canonical)
IIOtatiOn iS jUSt DENDRAL
dot notation
(not
necessarily
with four changes :
1. dots are replaced by numerals to indicate bonds, 2. the symbol string is terminated with a dollar sign, 3. atom names longer than one character are surrounded by asterisks, for example * c L * for a chlorine atom, and 4. central bond molecules are prefixed with a special character - the value of the variable CENTRALBOND (currently an asterisk). The output of the PREDICTOR is a list of number pairs, representing the mass-intensity pairs of the predicted spectrum. Peaks below mass 29 are omitted and intensities are adjusted to percent of the base peak (highest peak). Several options are available to the user to help him interpret the program’s work. Section 4.5 lists those currently available. 246
.
BUCHANAN,
SUTHERLAND
AND
FEIGENBAUM
Also, users familiar with the program can change its theory substantially by resetting parameters before calling DRAW. Section 4.2 indicates many of the parameter names and current values as well as brief descriptions of their effects. Since the functions using these global variables are so intertwined, it is impossible to describe the effects in all contexts. Thus it is generally helpful to look at several examples before and after changing parameters. 4.5.
Options
and how
to use them
1. Print the spectrum as a bar graph instead of as a list of number a name of the spectrum to the function PSPEC, e.g., (PSPEC
(DRAW
(QUOTE
or (PSPEC
(QUOTE
or (PSPEC
SPECNAME),
number
pairs. Give
~l~lclclc$)))
((15 . 20) (29.40) where
(30.
‘SPECNAME’
22).
. . )))
is the name of a list of
pairs.
2. Print an analysis of the last predicted spectrum. This function prints all the number pairs of the spectrum, in order of descending mass units, with a short note explaining the source of the peak. The synopsis printed by the function SCAN first indicates the structure of the molecule in DENDRAL dot notation, except with numbered atoms replacing the atom-types. For example Cl. = .Ol 02 C2.Nl for glycine, as given in the quasi-DENDR AL notation above. The mass-intensity pairs for the ions are indicated in order of decreasing masses. An indication of the source of the pair follows each pair: (a) (MOL ION) following a mass-intensity pair indicates that this is the pair resulting from the unfragmented molecule. (b) (* RR MOL) indicates that the pair resulted from some rearrangement of the molecular ion. (c) (~4 1 ~3) indicates that the pair resulted from breaking the single bond between atoms C4 and C3. (d) (~4 1 C~:*RR c4) indicates that after the bond between C4 and C3 was broken, the fragment containing C4 underwent some rearrangement which resulted in the mass-intensity pair on this line. To obtain this analysis, call the function SCAN after the spectrum has been calculated : (s c AN). 3. Calculate isotope peaks. After the mass-intensity pair calculations have been made for a fragment, the program can generate a cluster of peaks around the original one to account for isotopic variations of the fragment and addition of extra protons to the fragments. This feature is optional since the most significant peaks in spectra often do not include isotope peaks. Set the global variable IPEAKS to T (true) before calling DRAW: (SETQ IPEAKS T). 4. Print an on-line report of progress, including: (a) the bond under consideration (b)
the rearrangement
products
247
MACHINE
LEARNING
AND
HEURISTIC
PROGRAMMING
(c) the features considered and the numerical them during intensity calculation. To monitor
progress
values associated
in this way, set the global variable
SPEAK
with
to T: (SETQ
SPEAKT).
5. Include mass units below 29 in the spectrum. instead of DRAW as the top-level function. 5. THE
EVALUATION
Use the function
DRA
w
100
FUNCTION
After candidate structures have been generated by the STRUCTURE GENERATOR, the program needs some way to attach a degree of plausibility to each one. The PREDICTOR makes predictions for each one; the EVALUATION FUNCTION must now reflect the degree to which the predictions confirm or disconfirm each candidate hypothesis. Strictly numerical evaluation functions score predicted spectra on the basis of how much they ‘cover’ the peaks in the original spectrum without adding spurious peaks - perhaps weighting various kinds of failures. But all of these fail to account for the higher theoretical significance of some peaks over others, regardless of the numbers involved. After experimenting with such numerical evaluation functions, their inadequacies became obvious. The current evaluation function is relatively untried, but its theoretical base is much sounder than that of previous functions. The PREDICTOR now marks various kinds of cleavages and rearrangements as being very significant from a theoretical point of view. For example, the results of alphacleavage in ketones, amines and ethers are put on a global list named SIGNIFICANT, together with the results of other theoretically significant peaks in the predicted spectrum. At the end of the PREDICTOR'S run this global list remains set for use by the EVALUATION FUNCTION. Evaluation is a two-step process here: (A) reject any candidate whose predictions are inconsistent with the original data, and (B) rank the remaining candidates. (A) For each candidate molecule the EVALUATION FUNCTION looks in the original spectrum for each member of this list of significant peaks. Either a significant predicted mass point is represented in the original spectrum or it is not. If there is a peak at this mass point, x, and its intensity level is higher than the expected intensity level from an isotope peak (1% of the intensity of the x- 1 peak times the estimated maximum number of carbon atoms in the x- 1 peak), then the next significant predicted peak is considered. When the evaluation routine decides that the original spectrum shows a significant peak only because this is an isotope peak, the candidate is rejected. Rejection of a candidate is accompanied by a message explaining which significant peaks were missing from the original spectrum or were present only in amounts expected from isotopic variations, as shown in the examples in the following section. If the significant peak is not present in the original spectrum and other masses in this region were recorded in the original spectrum, then
248
BUCHANAN,
SUTHERLAND AND FEIGENBAUM
this candidate is rejected entirely. For example, if the predicted spectrum shows rearrangement peaks at the wrong mass points, it should not warrant further consideration since the theory is strongly violated by that candidate. When only high mass peaks have been recorded in the original spectrum, as is frequently the case, and one of the significant peaks thus fails to appear in the spectrum, the EVALUATION FUNCTION notes this fact on the list LOWPKS. For example, a significant peak at mass 15 will not be found in a spectrum which starts at mass 40. No candidate is ruled out by the failure to match unrecorded peaks since a more complete spectrum may well include them. On the other hand, there is no assurance that these significant low mass peaks would, in fact, appear if low masses had been recorded. (B) For each candidate, the list SIGNIFICANT~S matched against the original spectrum. If the candidate is rejected, all of the missing significant peaks are printed as justification for rejecting it. The second step of this routine is to rank the remaining candidates, each of which accounts for some of the nonisotopic peaks in the recorded spectrum, but not necessarily all. The best candidate is taken to be the one which accounts for the most peaks, as one should expect. In case of ties, the preferred molecule is the one with the lower number of unrecorded low mass peaks in doubt (as saved on the list named LOWPKS). The rest of the peaks in the predicted and actual spectra are not used at all presently. However, we may want to resolve ties by a numerical scoring of the remaining (non-significant) peaks in the spectra. Examples of the results of this EVALUATION FUNCTION are shown in the next section. 6.
EXAMPLES,
SUMMARY,
AND
CONCLUSIONS
The preceding sections have promised that section 6 would include examples showing the entire operation of the HEURISTIC DENDRAL program. Two simple examples are shown in Tables 9 and 10. These examples seem trivial until one considers the possible list of answers which could have been generated. The total number of structures for the composition ~8~160 is about seven hundred ‘chemically stable’ structures. (Several thousand others were eliminated by BADLIST.) Forty of these are ketone structures, yet the particular spectra (S:O9320 and S:O9046) enable the program to reduce the output to one and three structures, respectively. We have been using the program in another mode, namely to direct a search of chemical literature to determine which structural isomers of a given composition have previously been synthesized by chemists. In the case of threonine (composition c4HgN03), we estimate that there are several 750 of these thousand isomers (unrestricted by BADLIST). Approximately are considered ‘chemically stable’ but only about sixty of these have been reported in standard chemical references. This disparity has great significance for chemists because of the number of potentially useful compounds that may be found among the 890 ‘new’ structures. 249
MACHINE
LEARNING
(EXPLAIN
(QUOTE
AND
~8~160)
HEURISTIC
PROGRAMMING
(QUOTE
s:O9320
TESTY)
(QUOTE
JULY~))
*GOODLIST=(*N-PROPYL-KETONE3*) *BADLIST=(*C-2-ALCOHOL*
*PRIMARY-ALCOHOL*
*METHYL-ETHER2*
*ETHER2*
*ALDEHYDE*
KETONE3* *ETHYL-KETONE3* ____________________-------------------------
*ETHYL-ETHER2*
*ALCOHOL*
*ISO-PROPYL-
*METHYL-KETONE3’) ______________
VERSION)
(~~~~-4-1968
C*N-PROPYL-KETONE3*H8 MOLECULES
NO
1.
c=.
.
o
2.
c=.
.
0
DOUBLE
BOND
C3H7 C3H7
EQUIVS
cn2.c3~7, CH2.CH..CH3CH3.
DONE ____________________---------------(SCORE
(QUOTE
JULY-S-I
968
TEST2)
_________________------
S:O9320)
l.)c2lloclclcclclclc$ ((43.
100)
(128
.
(57.
88)
(58.
22)
(71
. 100)
(85.
88)
(86.
22)
14))
2.)c2lloclclcclcllccs ((43.
87)
(57.
100)
(100.
4)
(128.
16))
(58.
8)
(71
*THIS CANDIDATE IS REJECTED _______________________________ *LIST I.
OF RANKED
. 87)
(85.
100)
BECAUSE
(86.
4)
OF (loo). ___e-------mm
MOLECULES:
#l. s=6. P=
(57
71
43
85
86
58)
U=NIL * 1.
#
N MEANS
ORIGINAL BASED
ON THE
ORIGINAL PEAKS. USED
THE
FIRST
NUMBERED NUMBER
SPECTRUM. u = THE
RANKED
LIST
OF SIGNIFICANT THE
P=
LIST
IN RESOLVING
MOLECULE s = THE
ABOVE. LIST
OF POSSIBLY SCORING
IS THE
SCORE
PREDICTED
TIES
(THE
IN THE =
PEAKS
OF SIGNIFICANT SIGNIFICANT
NTH
(HIGHEST
BEST)
IN THE
PREDICTED UNRECORDED
FEWER
IN DOUBT
PEAKS THE
BETTER).
DONE Table
9.
(EXPLAIN
An example
(QUOTE
of
HEURISTIC
s :09046
~8~160)
DENDRAL
(QUOTE
output:
TESTI)
4-OCtanOne
(QUOTE
JULY~))
*GOODLIST=(*ETHYL-KETONE3*) *BADLIsT=(*C-2-ALCOHOL* *METHYL-ETHER2* KETONE3* ________--
*PRIMARY-ALCOHOL* *ETHER2*
*ALDEHYDE*
*N-PROPYL-KETONE3* _________e____mm_--
*ETHYL-ETHER2*
*ALCOHOL*
*ISO-PROPYL-
*METHYL-KETONE3*) __-___--_-__----__-------------
(JULY-4-1968VERSION) C2*ETHYL-KETONE3*H8 MOLECULES 1. 2. 3.
NO
DOUBLE
BOND
EQUIVS
CH2..CH2.C3H7C=.OC2H5, CH2..CH..CH3C2H5C=.OC2H5, CH3CH3C=.OC2H5. CH2.. CH2.CH..
DONE _________________----
Table 10. An example of
_-_----__-__-_______------------------HEURISTIC
DENDRAL
250
output: 3-OCtanOne
BUCHANAN,SUTHERLANDANDFEIGENBAUM
((29. 100)(57. 100) (71 . 70) (85.40) (99. 70) (128. 13)) 2.) cllcllcclcc2loclc~ ((29. 100) (57. 100) (71 . 100) (72. 4) (99. 100) (128. 19)) 3.) cllclcllccc2loclc% ((29. 100) (57. 100) (71 . 87) (99. 87) (128 . 16)) ____________________---------.-------_--_----*LISTOFRANKEDMOLECULES:
I. #2 s=5. ~=(2999577172) u= (29) 2. #l s =4. ~=(29995771) u= (29) Table lO(contd.). Anexample
3. #3 s== 4. ~=(29995771) u= (29) *I.
#NMEANSTHEFIRST...
(see Table 9)
of HEURISTIC
DENDRAL
output: 3-Octanone
We realize that the internal structure ofHEURIsTIc DENDRAL has not been presented in much detail. No very unusual programming has been employed, however; but we have taken full advantage of the facilities of LISP 1.5. What we have tried to present in this paper is the global strategy of the program. Between the global strategy of a program and its coded functions there are many levels of complexity. We have tried to keep an eye on both extremes and to stay roughly mid-way between them in order to show how some of the heuristics of the program work, how the various subroutines are tied together, and how we plan to expand the program to cover cyclic structures and more classes of acyclic structures. DENDRAL Recently we have had some ideas of how to rewrite HEURISTIC to separate more completely the model of chemistry from the graph manipulating processes. This will be our next big programming effort. Hopefully the revised program will handle rings without making them special cases. The program’s poor handling of ringed structures is now its major deficiency. In limited areas, the current program performs its two major tasks with a fair measure of success. ( 1) Using Lederberg’s D END R A L algorithm plus a theory of chemical stability, the STRUCTURE GENERATOR can construct all acyclic isomers (structural variants) of a given composition, either including or rejecting unstable structures. (2) With the more interesting task of explaining the data from a mass spectrometer by finding molecular structures which best account for the data, the program approaches the chemists’ level of sophistication only for a few select classes of molecules. Expanding the program to cover more classes depends upon much interaction with chemists, but no new programming strategies are anticipated. 251
.__lll__--__-.---_ -
-.
MACHINE 7. A
LEARNING
AND
SUMMARY
OF
HEURISTIC THE
DENDRAL
PROGRAMMING ALGORITHM
is a system of topological ordering of organic molecules as tree structures. Proper DENDRAL includes precise rules to maintain the uniqueness and the non-ambiguity of its representations of chemical structures. Each structure has an ordered place, regardless of its notation; the emphasis is upon topological uniqueness and efficient representation of molecular structures. The principal distinction of DENDRAL is its algorithmic character. DENDRAL aims (1) to establish a unique (i.e., canonical) description of a given structure; (2) to arrive at the canonical form though mechanistic rules, minimizing repetitive searches and geometric intuition; and (3) to facilitate the ordering of the isomers at any point in the scan, thus also facilitating the enumeration of all of the isomers. The DENDRAL representation of a structure is made up of operators and operands. The operators are valence bonds issuing from an atom. Each bond looks for a single complete operand. An operand is (recursively) defined as an unbonded atom, or an atom whose following bonds are all satisfied in turn by operands. Hydrogen atoms are usually omitted, but are assumed to complete the valence requirements of each atom in the structure. If the structure has unsaturations (one unsaturation for each pair of hydrogen atoms by which the structure falls short of saturation), these are indicated by locations of double and triple bond operators. Single, double, and triple bonds are represented by . , : , and i respectively. The operator : may be represented by = and the operator i by $. As an example, the molecule DENDRAL
0-CHs N HI-C/ b3 has one unsaturation
and may be written
(1) C.O.C.:NS (2) C.O.C:.SN (3) O..CC.:NS (4) O..C.:NSC (5) C..:O.CNS (6) C.:.O.CSN (7) c.:. Ns0.C (8) C:..SNO.C (9) S:C..O.CN (lo) N.C.:O.CS
in many ways, including:
(canonical)
Each of these ten notations is a non-ambiguous representation of the molecule. However, proper DENDRAL also specifies that the representation be unique. The key to obtaining the unique or ‘canonical’ representation is the 252
BUCHANAN,SUTHERLANDANDFEIGENBAUM
*
recognition of the unique center of any tree structure and the subsequent ordering of successive branches of the tree. The centroid of a tree-type chemical structure is the bond or atom that most evenly divides the tree. A molecule will fall into just one of the following categories, tested in sequence. Let V be the count of non-hydrogen atoms in the molecule. Then either A. Two central radicah of equal count are either ( 1) united by a leading bond ( V is even) or (2) sister branches from an apical node ( V is odd); or B. Three or more central radicals, each counting less than V//2, stem from a single apical node. In the first case, the centroid is a bond, and the canonical representation is an operator followed by two operands. In the other two cases the centroid is an atom, and the canonical representation is an operand in the form of an atom followed by two or more bonds and operands. In every case where two or more bonds follow an atom, the operands must be listed in ascending DENDRAL order. DENDRAL order (or simply ‘weight’) is a function of the composition and arrangement of a structure and finds its primary use when comparing two operands (radicals). The weight of a radical is evaluated by the following criteria (in descending significance): count, composition, unsaturation, next node, attached substructures. Count is the number of skeletal (non-hydrogen) atoms. Of two radicals, the one with the higher count is of higher weight. Composition refers to the atoms contained in the radical. An arbitrary ordering of the atoms makes carbon less than nitrogen less than oxygen less than phosphorus less than sulfur, C < N < 0 < P < S. (This ordering is alphabetical as well as by atomic number.) When comparing two radicals of the same count, the one with the fewer number of carbons has lesser weight. If carbons are equal, the one with the fewer nitrogens is of lesser weight. And so forth. Unsaturation counts the number of extra bonds (1 for a double bond, 2 for a triple bond) in the radical, including those (if any) in the afferent link (the bond leading into the radical). Of two radicals, the one with the greater number of unsaturations has the greater weight. The next node or apical node refers to the first atom in the radical (the one connected to the afferent link). When comparing two apical nodes, the following three criteria are evaluated (in order of decreasing significance): Degree is the number of afferent (attached) radicals. The apical node with the most radicals attached to it has the greater weight. Composition refers to the type of atom. A carbon atom is the lowest apical node, while a sulfur atom is the highest. AfSerent link refers to the bond leading to the apical node. A single bond afferent link is the lowest, a triple bond is the highest. 253
MACHINE
LEARNING
AND
HEURISTIC
PROGRAMMING
If the above criteria fail to determine which of two radicals has the greater weight, then the radicals appendant on the two apical nodes must be arranged in increasing order and compared in pairs. The first inequality in weight of appendant radicals determines the relative weight of the original radicals. The canonical representation for the molecule in the example given earlier is notation #7. It must be a central atom molecule since its count (ignoring hydrogen atoms) is 5; and the non-terminal carbon atom is the only atom which has all its appendant radicals with counts less than 5 /2. Of the three appendant radicals, the one containing two atoms has the highest count and thus is the heaviest. Of the two radicals containing a single atom each, the one with the double bond is the heavier because it has more unsaturations. Even-count molecules may have a bond for center, if the count of the molecule is evenly divided by cutting that bond. Thus, the canonical form for NH2\C~2-~~2/0H
. . c. NC. o, a leading bond, the first dot, calling for is two operands. The collection of rules and conventions described above provides a unique and non-ambiguous representation for any non-ringed chemical structure. In addition, the rules also allow us to construct the ‘lowest’ structure which can be made from a composition (collection of atoms). Once this lowest structure has been made, it may be transformed by a process of rearranging its atoms and unsaturations into the ‘next to lowest’ structure. This ‘incrementing’ process may be continued until the ‘highest’ structure has been made. REFERENCES
AND
READING
A System for Computer Construction, Enumeration and Notation of Organic Molecules as Tree Structures and Cyclic Graphs, Parts I-V.
Lederberg, J. (1964) DENDRAL-64,
Interim Report to the National Aeronautics and Space Administration. Lederberg, J. & Feigenbaum, E. A. (1967) Mechanization of Inductive Inference in Organic Chemistry. Stanford Artificial Intelligence Project, Memo No. 54. Sutherland, G. (1967) DENDRAL-A Computer Program for Generating and Filtering Chemica/ Structures. Stanford Artificial Intelligence Project, Memo No. 49.
254
,