13
Tracing Fluid Origin, Transport and Interaction in the Crust Chris J. Ballentine, Ray Burgess Department of Earth Sciences, The University of Manchester, Manchester, M13 9PL, United Kingdom
[email protected]
Bernard Marty Centre de Recherches Pétrographiques et Géochimique 15 Rue Notre-Dame des Pauvres, B.P. 20 and
Ecole Nationale Supérieure de Géologie Rue du Doyen Roubault 54501 Vandoeuvre les Nancy Cedex, France INTRODUCTION We detail here the general concepts behind using noble gases as a tracer of crustal fluid processes and illustrate these concepts with examples applied to oil-gas-groundwater systems, mineralizing fluids, hydrothermal systems and ancient ground-waters. Many of the concepts and processes discussed here are also directly applicable to the study of young ground and surface-water systems (Kipfer et al. 2002, this volume). Noble gases in the Earth are broadly derived from two sources; noble gases trapped during the accretionary process (often called ‘primitive’, ‘juvenile’ or ‘primordial’ noble gases), and those generated by radioactive processes (e.g., Ballentine and Burnard 2002, this volume). Differentiation of the Earth into mantle and continental crust, degassing and early processes of atmosphere loss has resulted in the formation of reservoirs in which the abundance pattern and isotopic compositions of primitive noble gases have been variably altered. Combined with their different radioelement concentrations (U, Th, K) producing radiogenic noble gases, the mantle, crust and atmosphere are now distinct in both their noble gas isotopic composition and relative elemental abundance pattern. Fluids that originate from these different sources will contain noble gases that are therefore isotopically distinct and resolvable (Fig. 1). Because the noble gases are chemically inert even if these fluids are lost through reaction or masked by addition of similar species from different sources, a conservative record of their presence and origin is preserved by the noble gases. Once resolved, the noble gas abundance patterns from the respective sources are particularly important, as these are sensitive to physical processes of fractionation. For example, from the distinct fractionation patterns it is possible to distinguish between for example, diffusive or advective transport processes. Similarly the abundance patterns enable the interaction of different phases to be identified and quantified. In a system that has fluids sourced from multiple terrestrial reservoirs, a fractionation pattern preserved in one component but not another (or indeed the same pattern preserved in both) gives information both about the processes and relative timing of processes operating on the differently sourced fluids either before or after mixing. Before it is possible to exploit the unique character of the noble gases it is essential to understand how the noble gases behave in the subsurface and how the isotopic systems can be used to unambiguously resolve the different noble gas components in any crustal fluid. To this end we review first the physical chemistry of the noble gases, the various fractionation mechanisms as well as the isotopic techniques and approaches used to resolve the differently sourced noble gas components. 1529-6466/02/0047-0013$10.00
DOI:10.2138/rmg.2002.47.13
540
Ballentine, Burgess & Marty
Figure 1. Schematic diagram of a gas reservoir, illustrating the different noble gas components which may occur in crustal fluids. Atmosphere-derived noble gases (e.g., 20Ne and 36Ar) are input into the gas phase on equilibration with the groundwater system containing dissolved atmospherederived noble gases. Radiogenic noble gases (e.g., 4He, 21Ne and 40Ar) are produced by the natural decay of the radioelements U, Th and K in the crust, and are also incorporated into crustal fluids. Within areas of continental extension or magmatic activity, noble gases derived from the mantle (e.g., 3He) may also be present in crustal fluids. The distinct isotopic and elemental composition of these different noble gas components allows the extent of their contribution to any crustal fluid to be quantitatively resolved and information about volumes, source and transport process of associated fluids to be identified.
PHYSICAL CHEMISTRY OF NOBLE GASES IN CRUSTAL FLUIDS Henry’s law and the assumption of ideality It is impractical to investigate experimentally the noble gas solubilities for the range of temperatures, pressures and chemically complex systems found in the geological environment. The investigation of a few representative systems, combined with thermodynamic analysis, is the only viable approach to predict the noble gas behavior in complex natural systems. Henry’s law governs the solubility of noble gases in solution. It is convenient at this stage to consider the assumptions that have to be made when applying the available data to Henry’s law. A full derivation can be found in most standard texts on thermodynamics and molecular theory of gases and liquids (e.g., Atkins 1978; Nordstrom and Munoz 1985; Denbigh 1986). Assuming ideality in both liquid and gas phase, Henry’s law is pi = Ki xi
(1)
Tracing Fluid Origin, Transport and Interaction in the Crust
541
where pi is the partial pressure of gas i in equilibrium with a fluid containing xi mole fraction of i in solution and Ki is the Henry’s constant. More completely, the non-ideality of species i in both gas and liquid phases needs to be considered, giving ΦI pi = γi Ki xi
(2)
where Φi and γi are the gas phase fugacity coefficient and liquid phase activity coefficient respectively. Non-ideality in the gas phase The real molar volume of the gas can be calculated from empirically derived coefficients (Dymond and Smith 1980; Table 1) for the virial equation of state Vm, where PVm/RT = 1 + B(T)/Vm + C(T)/Vm2
(3)
P is the total pressure, R the gas constant, T the temperature, and B(T) and C(T) the temperature dependent first and second order virial coefficients. Vm can be found by rearranging Equation (3) to a third-order polynomial and solving using Newton’s method of approximation to 10 iterations. The real molar volume is used in turn to find the fugacity coefficient, where Φ (P,T) = exp[ B(T)/Vm + (C(T) + B(T)2)/2Vm2]
(4)
The first and second virial coefficients for pressures and temperatures corresponding to a hydrostatic pressure increase with depth and a temperature gradient of 0.03 K/m are tabulated in Table 1, together with the calculated gas phase fugacity coefficient. The fugacity coefficients for the pure noble gases as well for CH4 and CO2 are plotted as a function of depth in Figure 2. Non-ideality of He and Ne increases almost linearly with depth, showing up to +18% non-ideality in Ne at depths of 4500 m. In contrast, Ar, Kr and Xe show a maximum deviation from ideality at between 1000- to 1500-m depth, varying from -8% for Ar to -20% for Xe. Maximum non-ideal behavior for these gases occurs at high pressure and low temperature. For example, an increase to lithostatic pressure gradients has the effect of reducing the depth of maximum deviation from ideality in Ar, Kr and Xe by a factor of three, and increases the non-ideal behavior of Ar at this depth to -20%. The behavior of all species is coherent with the exception of Xe, which bisects the Kr fugacity at about 1500 m. This does not appear to be due to error in the set of virial coefficients used, as these are in good agreement with other sets (Dymond and Smith 1980), but may reflect the failure of the virial expansion to only the third order for Xe at these higher pressures. Only the fugacity change with respect to pressure and temperature variation has been considered for the pure gases. For a mixed gas system, interactions between the different gas molecules and atoms must also be taken into account. The second virial coefficient, Bm(T), for a binary mixture between molecules 1 and 2 can be expressed as Bm(T) = B11(T)x12 + 2 B12(T)x1x2 + B22(T)x22
(5)
where x1 and x2 are the fractions of gas 1 and 2, B11 and B22 the second order virial coefficients of the pure species, and B12 the interaction coefficient. For an n component mixture Equation (5) can be expressed in the more general form n
n
B m (T) = ∑ ∑ Bab (T)x a x b
(6)
a=1 b= 1
In principle if all the second order virial coefficients of the pure components and the interaction coefficients of all the pairs of the molecules are known, the second order virial coefficient can be calculated. For the third order virial coefficient, 112 and 122 interactions
542
Ballentine, Burgess & Marty Table 1. Noble gas and CH4 + CO2 virial and fugacity coefficients as a function of depth.
Depth(m) P(atm) 300 29 1200 116 2000 194 2800 271 3700 358 4500 436
T(K) 298 323 348 373 398 423
Depth(m) P(atm) 300 29 1200 116 2000 194 2800 271 3700 358 4500 436
T(K) 298 323 348 373 398 423
Depth(m) P(atm) 300 29 1200 116 2000 194 2800 271 3700 358 4500 436
T(K) 298 323 348 373 398 423
Helium Neon B(T) C(T) Φ(P,T) B(T) C(T) Φ(P,T) 11.74 75.1 1.01 11.42 221 1.01 11.58 72.3 1.05 11.86 224 1.05 11.43 94.8 1.08 12.21 224 1.09 11.35 90.5 1.1 12.52 224 1.12 11.24 93.8 1.13 12.86 105 1.15 11.07 109.6 1.15 13.1 197 1.18 Krypton B(T) C(T) Φ(P,T) -52.36 2612 0.94 -42.78 2260 0.846 -35.21 1076 0.839 -28.86 1942 0.861 -23.47 1842 0.894 -18.82 1759 0.93 CH4 B(T) C(T) Φ(P,T) -43.3 2620 0.951 -34.6 2370 0.88 -27.7 2335 0.887 -21.6 2144 0.915 -16.4 1999 0.954 -11.6 1767 0.992
B(T) -15.5 -11.2 -7.14 -3.84 -1.08 1.42
Xenon C(T) 6069 5306 4635 4115 3739 3469 CO2 B(T) C(T) -123 4931 -103 4928
B(T) -130 -110 -94.5 -81.2 -70.1 -60.7
Argon C(T) 991 1230 959 918 877 833
Φ(P,T) 0.982 0.964 0.975 1 1.03 1.07
Φ(P,T) 0.85 0.804 0.883 0.888 0.891 0.886 Φ(P,T) 0.856 0.753
-73
4154 0.833
-52
3046 0.856
The second and third order virial coefficients B(T) and C(T) respectively, are from the compilation by Dymond and Smith (1980). These allow the real molar volume, Vreal, to be calculated by solving (P/RT)Vreal3-Vreal2-B(T)Vreal-C(T) = 0 (Eqns. 3 and 4), by using Newtons method of approximation, which converges at ~ 10 iterations. The fugacity coefficient Φ(PT) = exp[B(T)/Vreal + (C(T) + B(T)2)/2Vreal2] and is calculated from B(T), C(T) and Vreal as a function of depth assuming a temperature gradient of 0.03K/m and hydrostatic pressure to assess the deviation from ideality of the pure gas components up to 4500m depth (Fig.2).
must be considered for a binary mix. In practice, the data set required to calculate the virial coefficients is limited and not of practical use. If however, the assumption is made that the interactions between unlike molecules is insignificant, then a model can be based on the ideal mixing of non-ideal, or real, gases, where for any species the Lewis-Randall rule can be applied where fi = fiθ (P,T) xi (7) θ fi is the gas fugacity, fi is the fugacity of pure i at P and T, and xi the molar fraction. Whilst this assumption is reasonable for a species at high concentration, for a trace gas the dominant interactions will not be with like molecules or atoms. The potential effect of this is illustrated in Figure 3. The activity of CO2 and H2O at a constant temperature is plotted for a binary CO2/H2O mixture against the molar fraction of CO2 for pressures of 1 to 30 kbar (after Nordstrom and Munoz 1985). As the molar fraction of either H2O or CO2 approaches unity, the activity of that species approaches the activity predicted by the Lewis-Randall rule. However, the activity of the minor component can be significantly higher than that predicted by ideal mixing of real gases. Maximum deviation from ideal mixing occurs at low molar fraction, low temperature and high pressure. There is no data available to assess the magnitude of this deviation for the trace noble gas components in CH4/CO2/H2O gases.
Tracing Fluid Origin, Transport and Interaction in the Crust
543
Figure 2. Fugacity coefficients of pure noble gases, CH4 and CO2, calculated from second and third order virial coefficients (Table 1) as a function of depth, taking a temperature gradient of 0.03 K/m and hydrostatic pressure.
Figure 3. For a binary CO2/H2O mixture the activity of each species at a constant temperature is plotted against the molar fraction of CO2 for pressures of 1 to 30 kbar (after Nordstrom and Munoz 1985). As the molar fraction of either H2O or CO2 approaches unity, the activity of that species approaches the activity predicted by the Lewis-Randall rule. However, the activity of the minor component can be significantly higher than that predicted by ideal mixing or real gases. Maximum deviation from ideality occurs at low concentration, low temperature and high pressure.
All solubility calculations to date assume ideal gas behavior for the noble gases irrespective of geological environment. At near surface conditions, Lewis-Randall mixing is a reasonable assumption. It is clear from Figure 2, that the assumption of ideal behavior for He, Ne, and Ar at near surface conditions is also reasonable. More care must be taken with Kr and Xe, where deviation from ideality at 300-m depth is -6% and -15% respectively. Taking a linear extrapolation from 300-m depth to the surface (and ideal conditions) for example, would suggest that at 30-m depth Kr and Xe show -0.6% and -1.5% deviation from ideality. Solubility calculations for moderate depth hydrostatic
544
Ballentine, Burgess & Marty
fluid systems (1000-2000 m) will show the greatest error, with the discrepancy due to nonideality between He and Xe being up to almost 25%. The effects of non-ideal gas phases in high pressure high temperature systems, such as for example the effect on solubility in deep degassing magma is an avenue just starting to be explored (Nuccio and Paonita 2000). In addition, an assessment of the deviation from Lewis-Randall mixing in deep systems is important in achieving confidence in any models requiring solubility calculations. Non-ideality in the fluid phase The dependence of γ on pressure is small if the compressibility of liquids is small over the ranges considered. Temperature dependence is usually assumed to have the most significant effect and the effects of pressure are neglected. This assumption enables workers to investigate the effects of temperature and composition on a system of interest from experimental results derived at lower pressure. There is little information available to assess the error propagated by the assumption of pressure independence in highpressure systems. Unlike gases at low to moderate pressures, the virial series cannot be applied accurately to dissolved gases in a fluid due to short length scale ordering and resulting complex solute/solute and solute/solvent interactions. While a statistical mechanical theory of molecular fluids has been developed to account for such interactions in these phases (e.g., Hirschfelder et al. 1967; Gray and Gubbins 1984), it is as useful and more convenient to assess the potential deviation from ideality in the system of interest from empirically derived data. For example, the effect of electrolytes on gas solubility in solution is given by the Setschenow equation ⎡ So (T) ⎤ ln ⎢ i ⎥ = Ck i (T) ⎣ Si (T) ⎦
(8)
where C is the concentration of the salt in a solution, Soi (T) the solubility of the non electrolyte i in pure water at temperature T, Si (T) the solubility of i in the saline solution at the same temperature and partial pressure of i , and ki (T) is the empirical Setschenow coefficient. The Setschenow coefficient is temperature dependent, but is independent of the pressure and the electrolyte concentration over the range studied. Henry’s law (Eqn. 2) can be rearranged to consider the mole fraction solubility of i in pure water, where γi ~ 1, and the mole fraction solubility of i in a saline solution at the same partial pressure, respectively, enabling the Setschenow equation to be rearranged with respect to the mole fraction solubilities ⎡ ϕ P / Ki (T) ⎤ ln ⎢ i i ⎥ = Cki (T) ⎣ ϕi Pi / γ iK i (T)⎦
(9)
giving γ i = exp[Ck i (T)]
(10)
This satisfies the condition that as C → 0, γi → 1. If ki (T) is negative this results in γi < 1, increasing the solubility of i. If ki (T) is positive, this results in γi > 1, reducing the solubility of i. Although these effects are commonly called ‘salting in’ and ‘salting out’ of the non electrolyte, from Equation (10) it can be seen that these are no more than empirically derived changes in the activity of the dissolved gas. Measurements of noble gas solubilty in water and NaCl solutions have focused on low temperatures (0-40°C) and salinities up to that of seawater (Weiss 1970, 1971; Clever 1979a,b). This data is used in noble gas paleotemperature investigations and is
Tracing Fluid Origin, Transport and Interaction in the Crust
545
Table 2: Noble gas Setchenow coefficients, ki(T) Species
G1
G2
G3
He -10.081 15.1068 4.8127 Ne -11.9556 18.4062 5.5464 Ar -10.6951 16.7513 4.9551 Kr - 9.9787 15.7619 4.6181 Xe T2 -14.5524 22.5255 6.7513 Constants from Smith and Kennedy (1982) to fit ki(T) = G1 + G2/(0.01T) + G3ln(0.01T), where T is temperature in Kelvin and salinity is in units of mol-1(see Eqn. 8)
Figure 4. Setchenow coefficients calculated from Table 2 as a function of T. Only He reaches a minimum in the experimental range, limiting the ability of this data set to be extrapolated to higher temperatures.
tabulated in Kipfer et al. (2002, this volume). To expand the dataset available, specifically to investigate the range of NaCl concentrations and temperatures found in natural brines, Smith and Kennedy (1983) measured the solubilities of the noble gases in 0 to 5.2 molar NaCl solutions between 0 and 65°C. The coefficients and equation used to fit the experimental data are shown in Table 2. The variation of the Setchenow coefficients ki, with temperature T is shown in Figure 4. Over the experimental temperature range, only kHe reaches a minimum. Although the data for the heavier noble gases are fit to the same functional form, it is not possible to assess the error when extrapolating to temperatures higher than 65°C for any gas except He. Although the work of Smith and Kennedy only investigates the effect of NaCl on noble gas solubility, they note that the contribution by individual ions should be additive and in dilute brines it should be possible to estimate the salt effect of multi-electrolyte solutions. While no data exists for Mg++ and Ca++ ions, data for KI solutions show that kAr is independent of the electrolyte species (Ben-Naim and Egel-Thal 1965), suggesting that an NaCl ‘equivalent’ concentration provides a reasonable value from which to calculate the Setchenow coefficient. This relationship has been used in multi-ion mixtures such as seawater and for more concentrated solutions such as the Dead Sea brines (Weiss 1970; Weiss and Price 1989). The effect of non-electrolytes such as other dissolved gases in solution is more difficult to assess due to the lack of empirically derived data. Under near surface conditions, most non-electrolytes are relatively insoluble and will have negligible effect. However, at greater pressures significant amounts of major gas species may be in solution. For example at 190atm and 70°C (hydrostatic pressure and temperature at 2km depth), about 3cm3(STP) of CH4 saturate 1 cm3 of pure water to give a 0.13M CH4 solution (Price 1981). The assumption must be made therefore, that interactions between
546
Ballentine, Burgess & Marty
gaseous non-electrolytes must be small and do not significantly affect the activity coefficient of the noble gases. However, it has been shown that, for example, the CH4 saturation concentration in water does significantly decrease when small quantities of CO2 are present (Price 1981). While the data is not available to assess the magnitude of effect these different major species may have on noble gas solubility, this illustrates the potential shortcoming in assuming that no significant non-electrolyte interactions occur in gas-saturated solutions. Noble gas solubility in water and oil Water. The solubility of noble gases in water has received considerable attention from physical chemists investigating molecular models of solution in liquid water. Eley (1939) first considered the process of noble gas solution as consisting of a two step mechanism involving the creation of a cavity in the fluid. Ben-Naim and Egel-Thal (1965) described the thermodynamic behavior of aqueous solutions of noble gases in terms of a two-structure model and discuss the origin of the ‘stabilized structure of water’ by the noble gases, and the ‘degree of crystallinity’ of the water caused by the addition of electrolytes and non electrolytes to the solution. Comprehensive reviews are given by Wilhelm et al. (1977) and Ben-Naim (1980) with further discussion on the solvation structure of water by Stillinger (1980) who models the clumping tendency of strain free polyhedra cages formed on the solution of non polar gases. A detailed understanding of the noble gas behavior in water has resulted in a statistical thermodynamic model for the solubility of noble gases at varying temperatures based on the distributions of molecular populations among different energy levels (Braibant et al. 1994). Early laboratory determinations of noble gas solubility were neither comprehensive nor over large temperature ranges. Benson and Krause (1976) produced the first complete data set for noble gas solubilities in pure water for the temperature range 0-50°C, but as only helium reaches a minimum in this range no extrapolation from this data is possible to higher temperatures. Potter and Clyne (1978) increased the data set by investigating solubilities up to the critical point of water. However, this work was subject to some error, as shown by the subsequent work of Crovetto et al. (1982) and confirmed by Smith (1985) both of whom have fitted their solubility data to curves with a third order power series between 298K and the critical temperature of water. The fit from Crovetto et al. (1982) has been taken here for Ne, Ar, Kr and Xe while the solubility of He relative to Ar has been taken from Smith (1985) to calculate the Henry’s constants for high temperature aqueous systems (Table 3, Fig. 5). Table 3. Henry's constants for noble gases in water Species
He Ne Ar Kr Xe
Ao
-0.00953 -7.259 -9.52 -6.292 -3.902
A1
0.107722 6.95 8.83 5.612 2.439
A2
A3
0.001969 -1.3826 -1.8959 -0.8881 0.3863
-0.043825 0.0538 0.0698 -0.0458 -0.221
Coefficients for Ne, Ar, Kr and Xe from Crovetto et al. (1981) to fit the equation: ln(Ki) = Ao + A1/(0.001T) + A2/(0.001T)2 + A3/(0.001T)3 where Ki is Henry’s constant in GPa. Coefficients for He are from Smith (1985) to fit the equation: ln(FHe) = Ao + A1/(0.001T) + A2/(0.001T)2 + A3/(0.001T)3 where FHe = (XHe/XAr)liquid/(XHe/XAr)gas. X is the mol fraction. T is temperature in Kelvin. Valid temperature range is from 273K to the critical point of water. 1GPa = 9870 atm. For water, Ki(atm) = 55.6 Kim(atm Kg/mol), where Kim is Henry’s coefficient expressed in terms of molality.
Tracing Fluid Origin, Transport and Interaction in the Crust
547
Figure 5. Henry’s coefficients for noble gases in water, calculated from Table 3 following the molality convection, plotted as a function of temperature. The valid temperature range of this data set is 273K to the critical point of water.
Although it is usual to express the Henry’s constant in units of pressure (Eqn. 1), to enable comparison between oil (in which the mole fraction is difficult to calculate) and water systems, we use here the molality convention where: Kmi = ΦiPi/Ci
(11)
Φi is the gas fugacity coefficient, Pi the partial pressure of i in atm, and Ci the number of moles of i in 1000 g of the liquid phase (water). Oil. Solubility studies of the noble gases in crude oil have mostly been limited to empirical approximations as a function of oil density and temperature (e.g., Zanker 1977; ASTM 1985). The most comprehensive study to date remains that of Kharaka and Specht (1988), who have taken two crude oils of different density and experimentally determined the solubility of He, Ne, Ar, Kr and Xe over the temperature range 278 to 373 K. The respective solubilities are fitted to a linear equation in the form Log(Kmi) = A + BT, where A and B are the experimentally determined coefficients, T the temperature in °C and Kmi is the Henry’s constant following the molality convention (Eqn. 11). The coefficients are given in Table 4 and plotted as a function of temperature in Figure 6. Table 4: Henry's constants for noble gases in oil
Species He Ne Ar Kr Xe
Heavy Oil (API=25) A B 3.25 -0.0054 3.322 -0.0063 2.121 -0.0003 1.607 0.0019 1.096 0.0035
Light Oil (API=34) A B 3.008 -0.0037 2.912 -0.0032 2.03 0.001 1.537 0.0014 0.848 0.0052
The solubility constant of the noble gases in oil is dependent on oil density. Coefficients taken from Kharaka and Specht (1987) for two oils fit the equation Log(Kim) = A + BT where the solubility constant Kim follows the molality convention and is in units of atm Kg mol-1. T is temperature in oC. The valid temperature range for the determination is 25-100 oC.
548
Ballentine, Burgess & Marty
Figure 6. Henry’s coefficients for noble gases in ‘light’ oil (API gravity = 34o), calculated from Table 4 following the molality convention, plotted as a function of temperature. Noble gas solubility constants in more dense oil are higher (Table 4). The valid temperature range of the experimental determination is 298-373 K, although with no apparent minima, extrapolation to higher temperatures is probably reasonable.
The molality convention is followed because crude oil consists of various mixtures of different molecules that make the determination of the gas mole fraction almost impossible to determine. Unlike the studies of noble gas solubilities in water, there is no comprehensive study that has investigated the noble gas solubility in oil as a function of oil density and temperature. While a linear relationship between solubility based on the two oils measured can be assumed (e.g., Ballentine et al. 1996) and to a first order is supported by the empirical approximations (Zanker 1977; ASTM 1985), this remains a limiting factor in the application of noble gas solubility studies involving an oil phase. PHASE EQUILIBRIUM AND FRACTIONATION OF NOBLE GASES Liquid-gas phase partitioning of noble gases Noble gas partitioning and solubility fractionation between equilibrated subsurface phases was initially studied by Goryunov and Kozlov (1940) and further studied (Zartman et al. 1961; Bosch and Mazor 1988; Zaikowski and Spangler 1990; Ballentine et al. 1991; Ballentine et al. 1996; Hiyagon and Kennedy 1992; Pinti and Marty 1995; Torgersen and Kennedy 1999; Battani et al. 2000). Recent reviews are by O'Nions and Ballentine (1993), Ballentine and O'Nions (1994) and Pinti and Marty (2000). Under equilibrium conditions, the distribution of noble gases between gas and liquid phases is given by Henry’s Law (Eqn. 1). Following Goryunov and Kozlov (1940) and Zartman et al. (1961) and assuming ideal behavior in the gas phase, another form of this equation is derived when the concentration i in the gas phase Cgi is related to the concentration in the liquid phase phase Cli by Cgi = Kid Cli
(12) d
Henry’s constant in this form, Ki , is dimensionless. For a fixed volume of gas and liquid, the number of moles in the gas phase [i]g is related to the total number of moles present [i]T and the liquid to gas volume ratio, Vl/Vg, by [i]g = [i]T (Vl/Vg Kid + 1) –1 Taking the limits as Vl/Vg → 0, then [i]g → [i]T, and as Vl/Vg → , then [i]g → 0.
(13)
Tracing Fluid Origin, Transport and Interaction in the Crust
549
It can be seen that Henry’s constants can be dimensionless (Kid, Eqn. 12) expressed in units of pressure, (Ki, Eqn. 2) or take the molaltity format, Kim (Tables 3 and 4). A similar form of Equation (13) for Ki or Kim can be simply derived taking due account of units. For example we consider Henry’s constant, Ki, expressed in units of atm and water as the liquid phase. In this case the mole fraction, xi , can be related to the concentrations in terms of the water density, ρH2O (g/cm3) and the water volume, VH2O (cm3) where xi = 18 ([i]T – [i]g]) (ρH2O VH2O ) –1
(14)
The partial pressure of i, pi, in the gas volume Vg can be expressed in terms of the concentration of i in the gas phase at temperature T (K) assuming that at STP (1 atm, 273 K), 1 mole of gas occupies 22400 cm3 (ideal gas behavior) by pi = [i]g (22400 T) (273 Vg) –1
(15)
Substitution of Equations (14) and (15) into Equation (2) and rearranging gives ⎛ 22400 T ρ H2O VH2O ⎞ [i]g = [i]T ⎜ +1⎟ γi ⎝ 18 × 273 φi Ki Vg ⎠
−1
(16)
Equation (13), but with Henry’s constant in units of molality, Kim (Kg atm/mol), can be similarly derived to give ⎛ ⎞ 22400 T ρ l Vl [i]g = [i]T ⎜ +1⎟ γi m ⎝ 1000 × 273 φi Ki Vg ⎠
−1
(17)
where ρl is the density of liquid l (g/cm3) at the system pressure and temperature, T. This form enables the partitioning of species i between gas and liquid phases to be calculated for any water/gas equilibrium, taking due account of any non-ideal behavior in species i in either the gas or liquid phases. In the simplest case it is possible for example to calculate the volume of gas with which groundwater has equilibrated from one noble gas concentration determination in the water phase, and an estimate of the conditions under which equilibration took place. Similarly, the volume of water with which a gas phase has equilibrated can be quantified from the determination of the concentration of one noble gas in the gas phase. This is discussed in more detail in the following sections. Liquid-liquid phase partitioning of noble gases The partition coefficient Di between two phases for any species i is defined as the equilibrium concentration of i in one phase relative to the other. For two separate liquid phases (we consider here oil and water) the relationship between Di and the Henry’s constants is given as Di = Cioil/CiH2O = Kim(H2O)/Kim(oil)
(18)
where Cioil, CiH2O, Kim(H2O) and Kim(oil) are the number of moles of i in 1000 g of oil, 1000 g of water and the Henry’s constants (atm Kg/mol) of i in water and oil respectively. Substituting Cioil = [i]oil/1000xVoilρoil, CiH2O = [i]H2O/1000 × VH2OρH2O, and [i]T = [i]oil+[i]H2O into Equation (18) (where ρoil, ρH2O, [i]T, [i]oil and [i]H2O are the density of oil and water (g/cm3), total number of moles of i, the number of moles of i in the oil phase and the number of moles of i in the gas phase respectively), and rearranging gives ⎛V ρ ⎞ Km [i]oil = [i ]T ⎜ H2O H20 mi (oil) + 1⎟ ⎝ Voil ρoil K i (H2O) ⎠
−1
(19)
This equation form enables the partitioning of species i between any two liquid phases to be calculated as a function of liquid density and relative volumes. Similar to the gas-
550
Ballentine, Burgess & Marty
liquid system, in the simplest case, determination of the concentration of one groundwater-derived noble gas concentration in either the water or the oil phase enables quantification of a system oil/water volume ratio. This is discussed in detail in the following sections. Relative fractionation Although the absolute concentration and distribution of noble gases between different phases is often useful if the original noble gas concentration in one fluid phase is known (e.g., atmosphere-derived noble gases in groundwater), in many systems the concentration may not be so well determined, but a reasonable estimate of the initial relative concentrations of noble gases in a fluid may be available (e.g., crustal-radiogenic or diluted air/groundwater-derived noble gases). In this case it is often convenient to investigate the relative change in noble gas ratios, or fractionation, from the predicted ratio. By convention fractionation is usually assessed relative to 36Ar. Gas-liquid. From Equation (13), the relative fractionation between, for example, species i and Ar in the gas phase, ([i]/[Ar])g, can be related to the original ratio in the system ([i]/[Ar])T, after Bosch and Mazor (1988), by ⎛ Vg 1 ⎞ ⎜ + d ⎟ ⎛ [i] ⎞ ⎛ [i] ⎞ ⎝ Vl KAr ⎠ ⎜ ⎟ =⎜ ⎟ ⎝ [Ar ]⎠ g ⎝ [Ar ]⎠ T ⎛ Vg 1 ⎞ + d⎟ ⎜ ⎝ Vl K i ⎠
(20)
Taking the limits as Vg/Vl → ∞ then ([i]/[Ar])g → ([i]/[Ar])T, and as Vg/Vl → 0 then ([i]/[Ar])g → ([i]/[Ar])T(Kdi/KdAr). Therefore as Vg/Vl becomes small, the noble gases are fractionated proportionally to their relative solubilities in the liquid phase, or more precisely including the effects of non-ideality on the solubility: ⎛ [i] ⎞ ⎜ Ar ⎟ ⎝ [ ]⎠ g
γi d K Φi i As Vg/Vl → 0, → γ = Fgas ⎛ [i] ⎞ Ar KdAr ⎜ Ar ⎟ Φ Ar ⎝ [ ]⎠ T
(21)
where Fgas is [i]/[Ar] ratio in the gas phase normalized to the original system ratio to give a fractionation factor. An Fgas of 1 indicates that no fractionation from the original system value has occurred. Liquid-liquid. In a similar fashion the relative change in the [i]/[Ar] ratio in a liquidliquid system can be assessed. For example, the high solubility of noble gases in oil relative to water can potentially result in significant and distinct fractionation of the noble gases where equilibrium has occurred between these two phases. Following Bosch and Mazor (1988), the [i]/[Ar] ratio in the oil phase, ([i]/[Ar])oil, is related to the original [i]/[Ar] ratio, ([i]/[Ar])T, the oil/water volume ratio Voil/VH2O and the solubility of the noble gas species in each phase, where ⎛ [i] ⎞ ⎜ ⎟ ⎝ [Ar ]⎠ oil
⎛ V K dAr(oil) ⎞ oil + d ⎜⎜ ⎟⎟ ⎛ [i] ⎞ ⎝ VH2O KAr(H2O) ⎠ =⎜ ⎟ ⎝ [Ar ]⎠ T ⎛ Voil K di(oil) ⎞ + d ⎟⎟ ⎜⎜ ⎝ VH2O K i(H2O) ⎠
Maximum fractionation occurs in the oil phase when
(22)
Tracing Fluid Origin, Transport and Interaction in the Crust
as Voil/VH20 → 0,
⎛ K dAr (oil) ⎞ ⎛ [i] ⎞ ⎜⎜ d ⎟⎟ ⎜ Ar ⎟ ⎝ [ ]⎠ oil ⎝ K Ar (H2O) ⎠ → = Foil ⎛ [i] ⎞ ⎛ K di (oil) ⎞ ⎜ Ar ⎟ ⎟⎟ ⎜⎜ d ⎝ [ ]⎠ T ⎝ K i (H2O) ⎠
551
(23)
The magnitude of the fractionation seen in either phase is therefore proportional to the ratio between the noble gas relative solubilities in the two liquid phases. Equilibrium fractionation of the Ne/Ar ratio: An example. From Equations (20) and (21) and the solubility data presented in Tables 2 and 3, the fractionation of the noble gases between gas and liquid phases can be calculated for a range of Vg/Vl ratios and at temperatures and salinities appropriate to those in an active sedimentary basin. Figure 7a shows the maximum Ne/Ar fractionation in water and gas phases for pure water and a 5M NaCl brine. For pure water, maximum fractionation in the gas phase is 3.4 at 290 K and decreases with increasing temperature, salinity and Vg/Vl. For example, at 290 K and in equilibrium with a 5M NaCl brine, Ne/Ar fractionation in the gas phase has a maximum value of 2.5. The effect of phase equilibrium with an oil phase and the resulting magnitude of fractionation that can occur is illustrated in Figures 7b and 7c. The relative solubilities of the noble gases in an oil phase have a greater range than in water. This range increases with increasing oil density. The effect of this increased difference in solubility between the noble gases is an increase in the magnitude of fractionation that can occur in an oil/gas/water system. For example a gas phase in equilibrium with ‘Heavy’ crude oil (API = 25) at 330 K as Vg/Vl aproaches zero will have a Ne/Ar fractionation factor of 7.1. This decreases to a maximum of 4.3 for a light crude oil (API = 34) at the same temperature (Fig. 7b). Fractionation in any gas phase associated with oil decreases with increasing temperature, Vg/Vl and decreasing oil density. Equilibration between water and an oil phase causes maximum fractionation in the oil phase as the salinity of the water phase approaches saturation and with increasing oil density when Voil/Vwater approaches zero (Fig. 7c). Similarly, maximum fractionation in the water fractionation in the water phase as Voil/Vwater approaches infinity, and as the salinity of the water phase approaches saturation. Unlike liquid/gas phase fractionation, which increases with decreasing temperature, water/oil fractionation reaches a maximum at moderately low temperatures. This occurs, for example, in a pure water/ ‘light’ oil (API = 34) system at 310 K, with a maximum Ne/Ar fractionation of 0.51 and 1.96 in the oil and water phases respectively. This can be compared with a pure water/ ‘heavy’ oil (API = 25) system where at 286 K a maximum Ne/Ar fractionation of 0.27 and 3.69 is obtained in the oil and water phases respectively. Rayleigh fractionation A simple dynamic model. The maximum magnitude of noble gas fractionation that can occur when two phases have been equilibrated is summarized for Ne/Ar in Figure 7. Although the ‘phase equilibrium’ model demonstrates the effect of the physical conditions in a system on the limits of noble gas fractionation, the phase equilibrium model represents only one end-member of the processes that may be occurring in a dynamic subsurface fluid environment. To convey some sense of the relevance of the phase equilibrium model in a dynamic system it is useful to consider the extent to which noble gases partition and fractionate between phases when a gas bubble passes through a column of liquid (Ballentine 1991; Fig. 8).
552
Ballentine, Burgess & Marty
Figure 7. (A) The dependence of Ne/Ar fractionation between water and a gas phase is shown as a function of temperature, salinity and the gas/water volume ratio (Eqns. 20, 21) modified from Ballentine et al. (1991). The maximum equilibrium fractionation in the gas phase occurs when the water phase salinity and temperature is low and as Vg/Vw approaches 0. A graduated scale between pure water and 5 M NaCl brine is shown to illustrate the effect of changing salinity. Graduated scales are also shown to illustrate the effect of changing the Vg/Vw ratio for both the pure water and a 5M NaCl brine. Fractionation of the Ne/Ar ratio in the water phase is the inverse of that in the gas phase, with maximum fractionation occuring at low temperature and salinity as Vg/Vw approaches infinity. (B) The dependence of Ne/Ar fractionation in an oil/gas phase system is shown as a function of temperature (faint line is ‘light’ oil, API = 34; dark line ‘heavy’ oil, API = 25). Maximum fractionation in the gas phase occurs as the Vg/Voil ratio approaches zero. Maximum fractionation occurs in an oil/gas system at low temperature and as the oil density increases.
Tracing Fluid Origin, Transport and Interaction in the Crust
553
Figure 7 caption, continued. Fractionation in the oil phase is the inverse of that occuring in the gas phase, with maximum fractionation occuring as the Vg/Voil ratio approaches infinity. (C) The dependence of Ne/Ar fractionation in an oil/water phase system (‘light’ oil, API = 34) is shown as a function of temperature. Solid lines represent the limit of experminetal data, dashed lines an extrapolation. A fractionation maximum occurs at low temperature, 310 K for ‘light’ oil, and high salinity. In the water phase maximum fractionation occurs at high salinity, high oil density and as the Vwater/Voil ratio approaches zero. Maximum fractionation in the oil phase occurs at high salinity, high oil density and as the Vwater/Voil ratio approaches infinity.
Figure 8. (A) A water column is divided into fifty equal unit cells and it is assumed there is no liquid or dissolved gas between cells. Each cell originally has the noble gas content of airequilibrated water and all calculated Ne/Ar ratios are normalized to this value to obtain a fractionation factor F. The column temperature is taken to be 325 K, which for pure water gives KNe = 133245 atm and KAr = 55389 atm. A gas bubble of constant volume is passed sequentially through the column, equilibrium assumed to occur in each water cell and the Ne and Ar partitioned into the respective gas and water phases (Eqn. 16). The evolution of the Ne/Ar ratio in the gas bubble (bold) and each water phase increment (Faint) is shown for different gas/water volume ratios, Vg/Vl. The gas bubble Ne/Ar ratio approaches the maximum fractionation value predicted for a gas/water phase equilibrium where as Vg/Vl → 0, F → KNe/KAr. The cell Vg/Vl ratio only determines the rate at which this limit is approached. (B) The same water column with a fixed cell Vg/Vl ratio of 0.01. n subsequent bubbles are passed through the column and the He/Ne distribution between phases calculated at each stage. The gas bubble Ne/Ar ratio evolution for n = 1, 10, 20 and 30 is shown in bold, together with the residual Ne/Ar in the water column cells (faint lines). All gas bubbles approach the limit imposed by the phase equilibrium model. The water phase is fractioned in the opposite sense and is fractionated in proportion to the magnitude of gas loss following the Rayleigh fractionation law (Eqn. 24).
554
Ballentine, Burgess & Marty
As a starting point, the liquid can be taken to be water that has equilibrated with air to obtain its noble gas content. Furthermore, it is assumed that the liquid is saturated with respect to the dominant gas species forming the bubble/gas phase. The column is divided into cells and it is assumed that there is no transport of dissolved gases or fluid between the cells. When a gas bubble, initially with no noble gas content, is introduced into the first cell the distribution of both Ne and Ar can be calculated from Equation (16) assuming complete equilibration between the gas and fluid in that cell only. The volume of the bubble is assumed to be constant and, now with a noble gas content, is moved to the next cell. Equilibrium is again assumed, and the resulting distribution of Ne and Ar between the gas and liquid phases calculated. In this manner the Ne and Ar concentrations and Ne/Ar ratio can be calculated for the gas phase and each water cell as the bubble is sequentially passed through the unit cells of the liquid column. The Ne/Ar ratios in both gas bubble and modified water cell are normalized to the air-equilibrated water ratio originally in each water cell to obtain a fractionation factor, F. The effect of varying Vg/Vl ratios in each increment is illustrated in Figure 8a. No gas bubble exceeds the fractionation limit predicted by the equilibrium solubility model where as Vg/Vl → 0, Fgas → KNe/KAr (Eqn. 21). When this value has been reached in the gas phase, the Ne and Ar concentrations in the bubble are in equilibrium with the noble gas content of the unmodified water phase. Neither gas nor water phase will be modified as this bubble passes through additional water ‘cells’ in the column. The only effect of the varying Vg/Vl ratios is the rate at which equilibration between the bubble and water cells is reached. After the first bubble has modified the Ne/Ar content of the water column, another bubble with the same volume and with no initial noble gas content can be passed into the column. The Ne and Ar concentration and Ne/Ar ratio in both the water cell and gas bubble can again be calculated for each cell as the bubble progresses up through the water column. In this manner for any number, n, of subsequent bubbles the noble gas distribution and evolution of each water cell and bubble can be calculated. In Figure 8b, the Ne/Ar fractionation of the water and gas phase is shown for a column with a cell Vg/Vl = 0.001 for n=1, 10, 20 and 30 bubbles. For n = 1, the plotted fractionation in both phases is the same as that shown in Figure 8a. Subsequent gas bubbles initially inherit a lower and lower Ne/Ar ratio as n increases because they equilibrate with the water cells fractionated by the previous bubbles. Nevertheless, the gas bubbles all approach the same F(Ne/Ar) limit predicted by the solubility equilibrium model as they progress through the column. The water column, after each bubble has passed through, becomes increasingly more depleted in noble gas content and retains a more and more fractionated Ne/Ar ratio as the dissolved noble gases preferentially partition into the gas phases. The noble gas ratio in the water phase exceeds the fractionation predicted by the equilibrium model, and is related to the fraction of gas remaining by the Rayleigh fractionation law ⎛ [i] ⎞ ⎛ ⎞ = [i] P (α −1) ⎝ [Ar ]⎠ water ⎝ [Ar ]⎠ o
(24)
P is the fraction of Ar remaining in the liquid (water) phase, ([i]/[Ar])o, the original liquid phase i/Ar ratio and α is the fractionation coefficient given for a gas/liquid system where:
α = (Kiliquid/KArliquid)
(25)
Similarly, the Rayleigh fractionation coefficient used to determine the magnitude of fractionation in a water phase that has interacted with an oil phase (instead of gas) is given by
α = (Kiwater KAroil)/(Kioil KArwater)
(26)
Tracing Fluid Origin, Transport and Interaction in the Crust
555
The K variables are the solubilities of the noble gas i and Ar in oil and water. In summary: • The phase equilibrium model limits the maximum noble gas fractionation that will occur in a gas phase migrating though groundwater. • By direct analogy, noble gas fractionation in an oil phase migrating through groundwater will be similarly limited by the phase equilibrium model. As the phase equilibrium value is approached in either the gas or the oil phase, quantitative information from the magnitude of fractionation about the volume of water that has equilibrated with the non-water phase will be lost (although minimum volumes can be inferred). The path length and time required for either the gas or oil phase to achieve the phase equilibrium limit will depend on the relative availability of the groundwater for equilibration, which in turn is controlled by factors such as porosity, tortuosity and interconnectivity of the rock matrix, as well as the residence time of both the gas or oil and groundwater phases. It is also important to consider scale. For example, the ‘bubble’, can be considered to be as large as a gas or oil field, and its movement only relative to the water. In this case an oil or gas field that equilibrates with an active groundwater system cannot be distinguished from groundwater equilibration during oil or gas phase migration from source rock to trap. In contrast to a migrating gas or oil phase, the residual groundwater phase will be fractionated following Rayleigh fractionation (Eqn. 24; Fig. 9). • Although extensive fractionation in the residual groundwater phase can occur in the opposite sense to that of the migrating phase, the absolute concentration of the fractionated noble gases in the water phase is very much reduced. • Strongly fractionated noble gas ratios can be transferred to the gas or oil phase from previously ‘stripped’ groundwater, but any such oil or gas can only contain low water-derived noble gas concentrations. Re-solution and effervescence A mechanism proposed to increase the magnitude of fractionation in a gas phase over that predicted by the phase equilibrium model limit is that of a multi-stage process of re-solution and effervescence (Zartman et al. 1961). In the simplest case a gas phase, containing a significant concentration of fractionated noble gases in equilibrium with airequilibrated groundwater, could be re-dissolved by a change in physical conditions such as an increase in pressure, a decrease in temperature and salinity, or mixing with unsaturated (with respect to the major gas phase) water. This would create a local increase in both the groundwater noble gas concentration and the magnitude of noble gas fractionation in solution. Subsequent formation of a gas phase in equilibrium with the modified groundwater would show a fractionation relative to air-equilibrated water in excess of that predicted by the single stage equilibrium solubility model. We can consider the volumes and concentrations required for this process through a worked example. In Figure 10, water and gas volumes have been chosen to produce significant fractionation in the final gas phase by a two-stage process of re-solution and effervescence, with a Vg/Vl ratio of 0.001 at each stage. The water is taken to be seawater, which has equilibrated with air at 20°C, now at conditions typical of 700-m depth: a temperature of 310K, hydrostatic pressure (68atm) and with a high salinity (5M NaCl) (KNe = 4.72×10⁵ atm and KAr = 2.33×10⁵ atm). The water is equilibrated with a gas phase and produces a 20Ne/36Ar fractionation value of 1.77 in the gas phase, which can be compared to the phase equilibrium limit of KNe/KAr=2.03 as Vg/Vl → 0. It is assumed that this volume of gas is then re-dissolved in a small volume of unaltered air-equilibrated seawater. The 20Ne/36Ar ratio of the fluid is now 1.72 times greater than the unaltered
556
Ballentine, Burgess & Marty
water and, when equilibrated with a gas phase under the same conditions as the first stage, produces a 20Ne/36Ar fractionation in the gas phase of F = 3.00. This is ~50% greater than the maximum fractionation for a single stage process. Zartman et al. (1961) suggest that this process may be repeated several times to produce highly fractionated noble gas patterns.
Figure 9. Fractionation of the Ne/Ar and Xe/Ar ratios in groundwater is shown by process and interacting phase. Conditions are taken to be 330 K and 2 M NaCl salinity. Water-Gas batch equilibration is shown as a function of Gas/Water volume ratio (Vg/Vl), as well as fraction of Ar remaining in the water phase, P-Ar. Batch noble gas distribution between water and gas phases is calculated following Equation (17). Rayleigh fractionation (faint line) of the water phase by gas is calculated following Equations (24) and (25). The graduated scale shows the fraction of Ar remaining in the groundwater phase. Water-Oil batch equilibration is also calculated for a light crude oil (API = 41, density = 0.82g/cm3, Kharaka and Specht 1988) following Equation (19). The change in Ne/Ar and Xe/Ar ratios is shown as a function of Oil/Water volume ratio (Voil/Vwater), as well as fraction of Ar remaining in the water phase, P-Ar. Rayleigh fractionation (faint line) of the water phase by gas is calculated following Equations (24) and (26). The graduated scale shows the fraction of Ar remaining in the groundwater phase. Tie lines between batch and Rayleigh fractionation resulting in the same P-Ar are also shown for gas-water and oil-water systems. On the same figure we have taken fresh water equilibrated with air at 1atm pressure at 293 K as our reference composition. The figure shows the effect on the fractionation values of variable recharge temperature and air addition. The effect of either a gas phase or an oil phase passing through groundwater will be distict and in principle enables quantification of the respective oil/water or oil/gas ratios.
The first point for consideration in this two-stage model is the re-solution of the gas phase. We use CH4 as an example. 65 m3 CH4 (STP) occupies 1 m3 at a depth of 700 m (68 atm and 310 K). From Price (1981), 14.6 m3 CH4 (STP) saturates 10 m3 of pure water under these. ~40 m3 of pure water, unsaturated with respect to CH4, are therefore required to re-dissolve this gas (more if this were a brine). If this volume is air-equilibrated water, the additional (and unfractionated) noble gas content would have the effect of lowering the final 20Ne/36Ar fractionation value to F = 1.57, less than the maximum fractionation value predicted for a single stage equilibrium. Notwithstanding more complex processes, such as the addition of a phase with no initial noble gas content, it would seem that the
Tracing Fluid Origin, Transport and Interaction in the Crust
557
process of re-solution of the major gas phase provides a major limiting factor when advocating a re-solution and effervescence model. If the fluid in equilibrium with the final gas phase is air-equilibrated water, the concentration of fractionated noble gases in solution must be significantly higher than
Figure 10. Re-solution and effervescence—a 3-stage worked example. Initial: A volume of seawater is equilibrated with air at 20°C and 1 atm, and then buried. The temperature and salinity and temperature is increased and the salinity modified Henry’s constants, KiMki, calculated. Stage 1: The water is equilibrated with a gas phase and the noble gas distribution between the phase calculated (Eqn. 16). Stage 2: The gas phase is re-dissolved in a volume of seawater that has an unmodified noble gas composition. Stage 3: The volume of water containing the re-dissolved noble gases is equilibrated with a gas phase containing no noble gases and the noble gas distribution between the phases re-calculated. The fractionation achieved in the gas phase is approximately 50% higher than that predicted by the phase fractionation model limit, but requires huge quantities of water. The physical process of re-solution of gases is also problematic (see text). When invoking a multi-stage process of re-solution and effervescence to account for highly fractionated noble gas ratios, the geological implications of mass balance and mechanism of re-solution must be very carefully considered.
558
Ballentine, Burgess & Marty
typical meteoric groundwaters. This would also require a proportionally high concentration of noble gases in the gas phase (although this could be masked by subsequent dilution by air-noble gas free gas addition). This is demonstrated in the worked example (Fig. 10), where the final gas phase has an order of magnitude greater concentration of 20Ne and 36Ar than the gas in equilibrium with unaltered air-equilibrated seawater. • Subsurface fluid phases with high noble gas concentrations as well as noble gas fractionation in excess of single step phase fractionation limits may provide field evidence for multi-stage processes of re-solution and effervescence. • The volume of the highly fractionated gas relative to the volume of original groundwater is however, very small. Orders-of-magnitude less fractionated gas is produced relative to the volume of liquid than in a single-stage water/gas equilibrium. • Both the physical re-solution of the major gas phase and also the large mass of the fluid phase required appear to preclude resolution and effervescence as a significant mechanism to fractionation noble gases beyond the soluble equilibrium limit without very careful consideration of the geological context. Multiple subsurface fluid phases The solubility equilibrium model limits the noble gas concentration and relative fractionation in a fluid ‘receiving’ noble gases originally associated with another fluid phase. The residual concentration and fractionation of the noble gases in the ‘donating’ fluid is controlled by Rayleigh fractionation or batch equilibrium depending on whether the system is open or closed to loss of the ‘receiving’ fluid phase (Fig. 9). As soon as a third or more phases are involved, the system become more complex, but is nevertheless still controlled by Rayleigh and batch equilibration limits. For the purpose of discussion we consider a system in which the original fluid phase is groundwater containing airderived noble gases at concentrations fixed during recharge. If the water noble gas content is altered by equilibration with an oil phase, subsequent equilibration of a gas phase with either the oil or water will result in a fractionation value in the gas phase that will reflect the salinity, temperature, oil density and gas/water/oil volume ratios and type of equilibration—either open or closed system The limits imposed by closed system interaction between water, gas and oil phases on the range of the gas phase 20Ne/36Ar ratios, originally derived from the air-equilibrated water, can be assessed (Bosch and Mazor 1988). For example at 310 K, KNe and KAr are 8471 atm kg/mol and 4155 atm kg/mol respectively in a 5M NaCl brine, and KoilNe and KoilAr are 622 atm Kg/mol and 117 atm Kg/mol. Maximum positive Ne/Ar fractionation in a gas phase occurs when the oil phase equilibrates with a small volume of water, transferring the noble gas content of the water into the oil phase with minimal fractionation. Subsequent equilibration of the oil with a small volume of gas will produce a fractionation value of F(Ne/Ar)gas = 622/117 = 5.3 (Eqn. 21), compared with the maximum fractionation of F(Ne/Ar)gas = 8471/4155 = 2.03 predicted for a water/gas system under the same conditions (Fig. 7a). Maximum gas phase Ne/Ar fractionation, in the opposite direction, occurs when the oil phase equilibrates with a large volume of water to produce F(Ne/Ar)oil = (117/4155)/(622/8471) = 0.31 (Eqn. 23). The addition of one extra phase, crude oil, to a gas/water system more than doubles the range of fractionation that can occur in any associated gas phase, from between F(Ne/Ar)gas = 1.0 to 2.03 to between F(Ne/Ar)gas = 0.31 to 5.3. In the case of an open system, fractionation in the residual phase will be even more extreme, and reflected in much lower concentrations (Battani et al. 2000). While it is possible to envisage a myriad of different interactions between water, gas and oil phases, depending on the order of interaction, open or closed system behavior and the relative fluid volumes, it is not a
Tracing Fluid Origin, Transport and Interaction in the Crust
559
useful exercise at this point to consider all of the possibilities, as other factors may also play a role in constraining the physical model development. For example, stable isotope information from the hydrocarbon gases may rule out the involvement or association with an oil phase (Schoell 1983), and systems must be considered on a case-by-case basis. Diffusion or kinetic fractionation In a gas phase. Gaseous diffusion processes can generate both elemental and isotopic fractionation in natural gases. Marty (1984) reviews the processes that can affect noble gases after Present (1958) and distinguishes among: a) free-molecule diffusion; b) mutual diffusion; and c) thermal diffusion. (a) Free-molecule diffusion takes place when a gas is traveling through a conduit in which gas-wall collisions are more frequent than gas-gas collisions. For this to occur the conduit diameter must be smaller than the mean free path of the gas atoms. Because the mean speed of particles is proportional to m-1/2 , where m is the mass of the gas atom, in the case of a binary mixture the lightest component will be enriched at the outlet of a conduit. It is shown that the fractionation coefficient, α, between two elements of masses m1 and m2 is approximated by:
α = [(m2/m1)1/2]
(27)
For a system depleted by a free-molecule diffusive process the Rayleigh fractionation law can again be applied. Taking m1 as the mass of gas i and m2 as the mass of Ar: ⎛ [i] ⎞ ⎛ ⎞ = [i] P ( α−1) ⎝ [Ar ]⎠ gas ⎝ [Ar ]⎠ o
(28)
where P is the fraction of Ar remaining in the gas reservoir, ([i]/[Ar])o, the original gas phase i/Ar ratio and α is the fractionation coefficient in Equation (27). It should be noted that for natural gases the dimension of the conduit needs to be very small (diameter < 10-8 m). Because the mean free path of the gas atoms is proportional to temperature and inversely proportional to pressure, this will decrease with depth. Fractionation through free molecular diffusion therefore, will only be significant in special circumstances and when the pressure of the system is low (approaching atmospheric pressure). (b) Mutual diffusion describes the diffusion of two or more gas species when the dominant interactions are gas-gas collisions. When a gas i with mass m1 diffuses through a gas with an average molecular mass mg, the diffusion coefficient of i is proportional to [m1 × mg) /(m1 + mg)]-1/2 = (m1*)-1/2
(29)
where m1* is the ‘reduced mass.’ The mean velocity of gas i is proportional to its diffusion coefficient. Therefore, for a second gas j with a mass of m2 the relative velocity between i and j provides the fractionation coefficient α that can be used in Equation (28), where
α = (m2*/m1*)1/2 = (m2/m1)1/2 × [(m1 + mg)/(m2 + mg)]1/2
(30)
These equations are only strictly relevant in the subsurface to a single phase gas system undergoing diffusive loss and remains to be applied in any noble gas study. (c) Thermal diffusion occurs when a gas mixture is in a non-equilibrium state because of a tendency for lighter molecules to be concentrated at the high temperature
560
Ballentine, Burgess & Marty
boundary. It is shown that the fractionation factor, f, in a steady state is: f = (T’/T)β
(31)
where T’ and T are the highest and lowest temperature and β is the element or isotope pair specific thermal diffusion parameter. Isotope enrichment can only be obtained by preferential extraction of either the cold or hot gas (e.g., Clusius and Dickel 1938). Marty (1984) considers various scenarios in the subsurface where isotopic fractionation may occur in light of the results of Nagao et al (1979, 1981). From both theoretical considerations (see above) and observed isotopic anomalies, this author concluded that the most likely cause of rare gas isotopic fractionation in natural gases is mutual diffusion taking place between atmospheric gases in soil pores and volcanic/geothermal gases ascending through the upper level of the crust and sediments. In water. The two principle controlling factors for gas diffusion processes in liquids are the gas mass and its activation energy for diffusion. The diffusion activation energy in turn is controlled by the extent of interaction of the gas molecule or atom with the liquid phase. For noble gases, because they are monatomic and have a stable electron shell, there is little interaction with water and the rate of diffusion is almost entirely controlled by their respective masses. This is in contrast with species such as CO2 and CH4 where interaction occurs with water molecules through induced dipole-dipole moments. Because this is in addition to mass, these species diffuse significantly more slowly in water than noble gases of similar mass (Table 5, Fig. 11). Gas
Table 5. Diffusion coefficients* in water (Jähne et al. 1987). Medium Ea A 1σ error 1σ error
He Ne Ar ** Kr Xe Rn H2 CH4 CO2
water seawater water water water water water water seawater water water
Kj/Mol
%
10-5 cm2/s
%
11.70 12.02 14.84 17.30 20.20 21.61 23.26 16.06 14.93 18.36 19.51
5 5 8 10 3 5 11 3 9 4 2
818 886 1608 3141 6393 9007 15877 3338 1981 3047 5019
2.1 1.8 3.5 5 1.6 3.5 11 1.6 4.3 2.7 1.3
* To fit equation D = A exp(-Ea/RT) where D is the diffusion coeficient, T the temperature in Kelvin, and R the gas constant ** Extrapolated, see text
The most complete study of noble gas diffusion rates in water remains the experimental determination by Jähne et al. (1987). In this work the diffusion coefficient in water was determined for systems between 0 and 35°C and the results expressed in terms of the diffusion constant, A (cm2/s), and diffusion activation energy, Ea (Kj/Mol) (Table 5), to provide a temperature dependent expression for the determination of the gas diffusion coefficient, D (cm2/s), at variable temperature following D = A e-Ea/RT
(32)
Tracing Fluid Origin, Transport and Interaction in the Crust
561
R and T are the gas constant and temperature in Kelvin respectively. For any one temperature it can be shown that the diffusion coefficient for the noble gases are well correlated with the square roots of their masses (Fig. 11). Although Ar has not been experimentally determined in this study, this clear relationship enables the values of A and Ea for Ar to be readily interpolated from the other noble gas values. The interpolated values for Ar are also shown in Table 5. The correlation of diffusion coefficient with the square root of their masses also allows the relative mass fractionation of noble gases to be calculated using Equations (27) and (28).
Figure 11. Diffusion coefficients for noble and selected active gases measured in water at 25°C, shown as a function of mass (after Jähne et al 1987).
Jähne et al. (1987) also investigated isotopic specific diffusion coefficients for 3He and the change in δC13(CO2) during diffusive gas loss from water. The increase in He diffusivity for the 3He compared to 4He was in agreement with the ratio of the square-root of their masses. This result provides further supporting evidence that the diffusion coefficients for individual isotopic noble gas species can reasonably be determined as a function of mass from Table 5 for variable temperatures. This is in contrast with the results for the study of δC13(CO2), which showed a fractionation factor far lower than the value predicted from the square root of the reduced mass. This discrepancy indicates that in the case of active gases the difference is not just an effect of mass but of the isotope specific interaction energy with the water molecules. The effect of salinity on gas diffusion rates is not quantitatively determined except for He and H2 in seawater (Table 5), showing a reduction in diffusion rate with an increase in salinity. In a water-filled porous medium. As soon as diffusion in a water-filled porous medium is considered, the effects of porosity, tortuosity, permeability as well as any interaction with the porous medium must also be considered. This enables us to define the first order ‘apparent’ diffusion coefficient, Da (cm2/s), where: Da = D/(R×Rf)
(33)
Rf is the retardation factor caused by the porous medium geometry and R the retardation factor due to physical or chemical interaction between the gas and porous medium. For the case of noble gases these latter interactions are usually insignificant and R = 1. Rf, determined for different rock varies over orders of magnitude but has not been correlated with physical rock properties to enable an assessment of all rock types. For example, Rf values of between 1.5 and 2.5 have been estimated for He and Ar in deep-sea sediments
562
Ballentine, Burgess & Marty
with a porosity of 70-80% (Ohsumi and Horibe 1984). Krooss and Leythaeuser (1988) have measured diffusion coefficients for light hydrocarbons in sedimentary rocks and calculated Rf values of between 20-50 for argillaceous sediments. Bourke et al. (1989) using both iodine and tritiated water diffusion in London clays calculates a similar value (Rf ~ 30). This is in contrast with Neretnieks (1982) who reports Rf values ranging from 100 to 1000 in compacted bentonite for hydrogen and methane diffusion. Rebour et al. (1997) review the literature describing gas diffusion in a porous medium as a ‘double’ porosity process. In this model, gas diffusion is affected by the increase in water viscosity when in the close vicinity of clay minerals. This produces an environment in which the gas diffusion rate is expected to be variable in the porous network depending on the local tortuosity and grain-size distribution. In modeling this type of system, diffusion is considered to occur along a direct pathway. These ‘fast’ routes interconnect ‘slow’ regions, into and out of which gas also diffuses. Experimental work by the same authors (Rebour et al. 1997) determines Rf = 200 for a clayey marl from Paris basin Callovo-Oxfordian sediments that have a porosity and permeability of 23% and 10-22 m-2, respectively. The isotopic fractionation in hydrocarbon gases by diffusive processes is a topic of current research (e.g., Zhang and Krooss 2001; Prinzhofer and Pernaton 1997), but is masked in natural systems by the variability of source values. As yet no work linking noble gases with stable isotope fractionation has been undertaken. • Despite the uncertainty regarding absolute rates of diffusion for noble gases in a water-filled medium, the relative rates remain a direct function of mass. In principle, for example, the extent of diffusive gas loss for any reservoir can be determined by the magnitude of fractionation of known noble gas elemental ratios using Equation (24) and the appropriate mass fractionation coefficient (Eqn. 27). RESOLVING DIFFERENT NOBLE GAS COMPONENTS IN CRUSTAL FLUIDS Terrestrial noble gases are dominated by three reservoirs: the atmosphere, crust and mantle. The isotopic compositions of noble gases produced by radioactive decay in the crust are distinct from noble gases derived from the mantle, which in turn are distinct from those in the atmosphere (Fig. 1). • Notably, the isotopes of 20Ne, 36Ar, 82Kr and 130Xe are not produced in significant quantities by radioactive processes in the crust (Ballentine and Burnard 2002, this volume) and, in the absence of a magmatic contribution, are almost entirely dominated by atmosphere-derived sources. Two-component mixing. The atmosphere however, does contain a significant amount of noble gases, such as 21Ne, 40Ar and 136Xe that are also derived from crustal/radiogenic sources. To distinguish which of these species are derived from the immediate crustal system from those that are derived from atmosphere sources, the isotopic ratios can be compared with the atmospheric ratio to identify the crustal ‘excess.’ In a two-component crust/air mixture [21Ne]crust = [21Ne]tot x [1-(21Ne/20Ne)air/(21Ne/20Ne)s] 40
40
40
36
40
36
Xe)air/(
136
[ Ar]crust = [ Ar]tot x [1-( Ar/ Ar)air/( Ar/ Ar)s] 136
[
136
Xe]crust = [
Xe]tot x [1-(
136
Xe/
130
Xe/
130
(34) (35)
Xe)s]
(36)
The subscripts crust and tot refer to the crustal and total concentrations while the subscripts air and sample refer to the isotopic composition of the atmosphere (Ozima and Podosek 1983) and sample respectively.
Tracing Fluid Origin, Transport and Interaction in the Crust
563
U and Th decay in both the mantle and crust to produce 4He. However, the Earth’s mantle has also preserved a significant quantity of ‘primitive’ 3He during accretion (e.g., Porcelli and Ballentine 2002, this volume). Because 3He is not produced in significant quantities by radioactive decay processes, mantle-derived He has a far higher 3He/4He ratio than crustal sources and even small magmatic additions to crustal fluid systems are readily resolvable (Poreda et al. 1986; Oxburgh et al. 1986). In contrast to the heavier noble gases, He, because of thermal escape from the atmosphere, has only a low abundance in the atmosphere. It is nevertheless necessary to correct any measured He isotopic composition for air-derived contributions by using the observed air-derived 20Ne concentration following (Craig et al. 1978) where (3 He/ 4 He)c =
( 3 He/ 4 He)s ×( 4 He/ 20 Ne)s /( 4 He/ 20 Ne)air −(3 He/ 4 He) air ( 4 He/20 Ne) s /(4 He/ 20 Ne) air − 1
(37)
Subscripts c, s and air refer to the corrected, measured and air-derived ratios, respectively. The (4He/20Ne)air elemental ratio, unlike isotopic ratios, is subject to elemental fractionation. In applications where the air correction is large and/or critical the (4He/20Ne)air ratio has to be determined with care. For example, in a groundwater that has not undergone phase fractionation this value can be determined from the recharge temperature and estimate of air in excess of recharge equilibrium or ‘excess air’ (e.g., Kipfer et al. 2002, this volume). In less critical applications where the air-derived component reasonably has a groundwater origin the measured (4He/20Ne)air = 0.288 in 10°C air-equilibrated water is often used (e.g., Craig et al. 1978). In many old groundwaters and hydrocarbon fluids, (4He/20Ne)s is large and the correction is negligible. In this case (3He/4He)c ≈ (3He/4He)s. Once corrected for atmosphere-derived He, the 3He/4He ratio represents the sum of only two components; the crust and the mantle. The contribution of crustal 4He is then given by [4 He]crust =
[ 4 He] tot × [( 3 He/ 4 He) mantle −( 3He/ 4He) c ] [(3 He/ 4He) mantle −( 3 He/ 4 He)crust ]
(38)
Subscripts mantle, crust and c refer to the mantle, crust and air-corrected values. Although (3He/4He)crust is well defined (~1×10⁻⁸, Ballentine and Burnard 2002, this volume), the choice of (3He/4He)mantle has to be made with care: 3He/4He for local subcontinental lithospheric mantle recorded in mantle xenoliths ranges between 8.54×10⁶ to 6.53×10⁻⁶ (Dunai and Baur 1995; Dunai and Porcelli 2002, this volume), input from the convecting mantle typical of that supplying mid ocean ridges would have higher values at 3He/4He = 1.12×10⁻⁵ (e.g., Graham 2002, this volume), while mantle regions beneath the crust influenced by a high 3He/4He plume, such as Yellowstone USA (Kennedy et al. 1985), may have yet higher 3He/4He values. Quoted errors need to reflect the degree of end-member uncertainty. Three-component mixing. When a significant magmatic component is present in a crustal fluid, in addition to the ubiquitous air-derived noble gases, there will also be a significant contribution from purely crustal radiogenic sources. In principle a similar approach to the resolution of the three-component He mixture can be taken (Eqns. 37, 38), by first correcting for atmosphere-derived contributions by reference to an unambiguously air-derived isotope. As above, the accuracy of this correction is entirely dependent on how well the elemental ratio of the air-derived pair is known. In many systems of interest elemental fractionation may have occurred and this approach for a single sample is then no longer appropriate. In the case of Ar, negligible 36Ar contributions to either crust or mantle components enable the atmosphere 40Ar to be corrected following Equation (35), although in this case
564
Ballentine, Burgess & Marty
the 40Ar excess is the sum of crustal and mantle contributions. Negligible or unresolvable differences among mantle, crust and air ratios of 38Ar/36Ar make it impossible for this isotope pair to be effectively used in resolving the mantle and crustal 40Ar components. In the case of Ne, the 21Ne/22Ne and 20Ne/22Ne ratios of all three components are significantly different, and given three isotopes and three components the contribution from each source to each isotope can be calculated (e.g., Ballentine and O'Nions 1992) where [20]air = 20 Total
(39) 21 x - 21 + 22 22 mntl 22 rad 20 meas 21 - 21 + 22 x 22 mntl 22 rad 20 air
21 22 21 22
x 20 rad 22 x 20 rad 22
- 21 mntl 22 - 21 mntl 22
x 20 mntl 22 x 20 mntl 22
rad rad
+ 21 20 + 21 20
x 20 - 20 meas 22 rad 22 mntl x 20 - 20 air 22 rad 22 mntl
[21]mntl =
21 Total
(40)
20 - 20 + 22 x 22 air 22 rad 21 meas 20 - 20 + 22 x 22 air 22 rad 21 mntl
21 22 21 22
x 20 22 x 20 air 22 air
- 20 22 - 20 rad 22 rad
x 21 22 x 21 air 22 air
rad rad
+ 20 21 + 20 21
x 21 - 21 22 rad 22 air x 21 - 21 mntl 22 rad 22 air meas
[22]rad = 22 Total
(41) 20 x 21 - 20 x 21 + 21 x 22 air 22 mntl 22 mntl 22 air 22 meas 20 x 21 - 20 x 21 + 21 x 22 air 22 mntl 22 mntl 22 air 22 rad
20 22 20 22
- 20 22 - 20 mntl 22 mntl
air air
+ 20 22 + 20 22
x 21 - 21 22 air 22 mntl 21 - 21 x rad 22 air 22 mntl meas
The parentheses subscripts crust, air, mntl and meas refer to the isotopic composition of the crust, air mantle and sample respectively. The square bracket subscripts crust, mntl, air, and Total, refer to the concentration of the crust, mantle and air component relative to the total isotopic contribution, respectively. Xe is another noble gas isotopic system where the crust, mantle and air end-members are significantly different. Substitution of the appropriate Xe isotopic end-member compositions into Equations (39)-(41) enables the end-member contributions to be derived for the three component Xe isotopic system. Element ratio mixing lines. Although it is not possible to resolve mantle and crustal Ar contributions in a single sample, this is possible with multiple samples from environments in which the elemental ratios from the respective end-member sources are constant and unaffected by subsequent fractionation. This is achieved by extrapolation, of an element-ratio/isotope-ratio mixing line to the isotope-defined end-members. For example, a plot of 3He/4He vs 40Ar*/4He (where there are negligible air contributions to He and 40Ar* is the 40Ar corrected for air-derived 40Ar, Eqn. 35), represents an isotope ratio and elemental pair whose component parts have only two sources – the crust and the mantle. For a system in which the mantle and crustal components have constant 40Ar/4He, a mixing line will be defined. Extrapolation to mantle and crustal 3He/4He end-member isotope compositions enables resolution of the respective 40Ar/4He component ratios (e.g., Stuart et al. 1995) (Fig. 12). • This technique is applicable to all noble gas systems that allow reduction to two component element-ratio/isotope-ratio mixing lines. 40
Tracing Fluid Origin, Transport and Interaction in the Crust
565
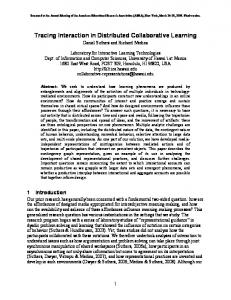
Figure 12. 40Ar*/4He vs 3He/4He measured in Dae Hwa (S. Korea) W-Mo deposit fluid inclusions after Stuart et al. (1995). Extrapolation of the mixing line defined by the samples from different mineralization zones to known end-member 3He/4He isotopic compositions enables end-member 4He/40Ar ratios to be determined. In this example the mantle 40Ar/4He = 0.69±0.06 and is typical of unfractionated samples from the mantle (e.g., Graham 2002, this volume), in contrast the crustal 40Ar/4He = 0.007. The latter value is far higher than crustal production ratio of ~0.2 and typical of a fluid derived from shallow cool regions of the crust (e.g., Ballentine and Burnard 2002, this volume).
Isotope ratio mixing lines. In cases where the elemental ratios may have been variably altered, by for example phase fractionation, the element-ratio mixing lines discussed above will not be preserved. Isotopic ratios are unaffected by this form of fractionation and isotope-ratio only mixing lines can be constructed. Ballentine (1997) for example, use this approach to identify the mantle He/Ne ratio of magmatic fluids in natural gases (Fig. 13). In this study a data inversion was used to identify the best fit mixing line and crustal 21Ne/22Ne production ratio for natural gases from gas fields around the world. The Ne isotopic composition, corrected for the atmospheric contribution using Equations (39)-(41), then represents a two component mix of mantle and crustal-derived Ne. Similarly, air contributions to the 3He/4He are negligible and this ratio represents a mix of mantle and crustal-derived He. The air-corrected Ne, (21Ne/22Ne)c, plotted against 3He/4He falls on a single mixing line for almost all samples and defines the mixing constant, r, where:
r = (4He/21Ne)crust/(4He/21Ne)mntl
(42)
(4He/21Ne)crust and (4He/21Ne)mntl are the 4He/21Ne ratio of the crust and mantle components before mixing respectively. Further examples of isotope mixing relationships and three-dimensional approaches when resolving three components from the isotope systematics are detailed in the section Description and analysis of multi-component noble gas mixtures in ore fluids. NOBLE GASES IN HYDROCARBON GAS AND OIL RESERVOIRS
In the context of playing a role in hydrocarbon exploration or field development noble gas studies are in their infancy. In principle noble gas fractionation in groundwater can provide a sensitive and quantitative tool with which to identify both natural gas
566
Ballentine, Burgess & Marty
3
He/4He (R/Ra)
Figure 13. Plot of (21Ne/22Ne)c vs. measured 3He/4He (R/Ra) for natural gases containing a significant mantle-derived component (Ballentine 1997). All data falls within 2σ error of a remarkably well defined mixing line between crustal and mantle derived endmember values. The hyperbolic mixing constant, D, determined from the mixing line is defined by D = (He/Ne)crust/(He/Ne)mantle. As (He/Ne)crust is reasonably well defined (e.g., Ballentine and Burnard 2002, this volume) the mixing line enables the magmatic He/Ne ratio in these crustal systems to be calculated. This is quite distinct from the mixing line involving an unfractionated mantle source bounded by a mantle He/Ne ratio with ‘Solar’ or ‘Popping rock’ values (hatched region). The difference has been ascribed to only partial degassing and solubility related fractionation of the noble gases in the magmatic source supplying volatiles to the crustal system. This appears to be a common feature in many extensional systems (see also Fig. 18).
(Zaikowski and Spangler 1990) and oil migration pathways—in the absence of either the gas or oil phase (Fig. 9). In practice, the acquisition of groundwater samples that are uncontaminated by drill fluids from boreholes is difficult for commercial reasons. The extension of this type of study to groundwater trapped in fluid inclusions is at the limit of current experimental techniques and remains unexplored. Most studies to date have focused on the information available from noble gases that are readily determined in natural gas and oil samples from actively producing fields. Of particular interest is the quantification of the amount of water that has equilibrated with an oil or a gas phase. This provides an understanding of the role that groundwater has played in both the secondary migration of oil and gas (where primary migration is expulsion from the source rock, and secondary migration is transport to the reservoir) and diagenetic processes associated with groundwater movement during hydrocarbon migration or emplacement. An equally important use of noble gases has been in identifying the origin of non-hydrocarbon gases such as CO2 and N2 by relating these species to mantle-derived and crustal-radiogenic gases, respectively.
Tracing Fluid Origin, Transport and Interaction in the Crust
567
Identifying and quantifying groundwater/gas/oil interaction The origin of atmosphere-derived noble gases in the subsurface. The introduction of atmosphere-derived noble gases into the subsurface is dominated by noble gases dissolved in groundwater. In the case of meteoric waters this occurs at recharge. The physical processes controlling the concentrations of noble gases in the meteoric groundwater phase are well constrained and include temperature, altitude, and salinity at recharge in addition to a small portion of air in excess of recharge equilibrium values (Kipfer et al. 2002, this volume). Figure 9 shows the typical range of Ne/Ar and Xe/Ar ratios in fresh water normalized to air-equilibrated water at 10°C.
Water associated with the sedimentary burial process (‘formation’ water) or density driven sinking plumes from highly saline lakes have both also equilibrated with the atmosphere, contain dissolved air noble gases, and contribute to the subsurface inventory (Zaikowski et al. 1987). These latter sources remain poorly constrained. Podosek et al. (1980, 1981) have shown that atmosphere-derived Kr and Xe can be preferentially trapped in shales. Recently, Torgersen and Kennedy (1999) have found correlated Kr and Xe enrichments in oil-associated natural gases that are consistent with this trapped sedimentary origin of atmosphere-derived Kr and Xe. The range, type and condition of rock sequences that preferentially trap Xe and Kr, and the conditions of their release, remain poorly constrained (Table 6). Phase fractionation. In a simple two-phase system, the recipient phase equilibrating with the groundwater will be the sampled oil or gas. The magnitude of fractionation in the oil or gas from the original groundwater values will therefore be controlled by the equilibrium solubility law (Eqns. 20, and 22) and reflect the subsurface conditions of temperature, water salinity and gas/water or oil/water volume ratio. The most uncertainty Table 6. Fractionated atmosphere-derived Ne, Kr and Xe measured in carbon-rich crustal rocks (after Torgersen and Kennedy, 1999). Reference
F(22Ne)
F(84Kr)
F(132Xe)
[36Ar] ×10-8 cm3 STP/g
Bogard et al. 1965
4.6-1010
0.7-1145
1600-45000
0.15-45
Frick and Chang 1977
7.6-15.6
220-261
2955-4345
n.a.
Podosek et al 1980
0.1-11.3
0.8-20.5
4-1300
0.1-1.0
in making this calculation is attached to the estimation of the elemental ratios before fractionation occurred. For example in the case of a meteoric water-gas system, even though a reasonable estimate of recharge temperature may sometimes be made, the amount of ‘excess air’ can be highly variable (Fig. 9). In principle, given four observables (Ne, Ar, Kr, Xe) three unknowns can be resolved using a data inversion technique similar to that developed to investigate paleotemperature calculations from noble gas concentrations in groundwater (Ballentine and Hall 1999; Kipfer et al 2002, this volume). If reasonable estimates of the subsurface conditions can be made the variables may include for example, temperature of groundwater recharge (derived from the gas phase albeit with large errors!) excess air and the gas/water volume ratio. One of the principle advantages of such an approach is the rigorous propagation of errors through to the derived values, including errors due to measurement as well as errors associated with an incomplete model formulation. Development of this technique is the focus of current research (Ballentine et al. 1999). Without a full data inversion workers to
568
Ballentine, Burgess & Marty
date have typically relied on elemental ratio pairs and an assumed range for their original value. In this respect the non atmosphere-derived noble gases can play a role in testing the robustness of a calculation because the magnitude of fractionation of non atmospherederived noble gases in the groundwater will be subject to the same fractionation process and show coherent fractionation with the atmosphere-derived gases (Fig. 14). The underlying assumptions in using this robustness check are two-fold: (1) the radiogenic noble gas composition has not itself been subject to fractionation (e.g., Ballentine and Burnard 2002, this volume); and (2) the radiogenic noble gases were indeed in the fluid system prior to the fractionating process.
Figure 14. Plot showing radiogenic 21Ne*/40Ar* vs 20Ne/36Ar and 4He/21Ne* vs. 20Ne/36Ar in the Hajduszoboszlo gas field, Hungary, after Ballentine et al. (1991). Left hand side figure: The crustal derived 21Ne*/40Ar* fractionates coherently with the groundwater-derived 20Ne/36Ar ratio (Line B) showing that these two differently sourced noble gas pairs were mixed before the fractionating processes. Right hand side figure: In contrast the crustal-derived 4He/21Ne* shows little fractionation from the predicted source ratio (Lines A). This is explained by a solubility based fractionation process, because although Ne and Ar have very different solubilities in groundwater the solubilities of He and Ne in water under subsurface conditions are similar. This will result in negligible fractionation of the He/Ne ratio.
Identifying the phase of transport. The hydrogeologic system can play an important role in the transport of gas from source to trap and identification of this process can influence exploration strategies (Toth 1980; Toth and Corbett 1986). Identification of whether or not groundwater has played a significant role in natural gas transport is possible by considering the concentration of noble gases derived from the groundwater that are now in the natural gas. For example, if we consider a groundwater that has not undergone phase separation or equilibration, its concentration of atmosphere-derived noble gases, as discussed above, fall in a relatively tight range and remain constant. The saturation limit for a major gas species (we consider here CH4) is a function of pressure and temperature (depth) as well as water salinity. The point at which CH4 saturation is reached will result in CH4 gas phase formation. The noble gases will partition between the gas and water phase. Because the volume of the gas phase at this stage is small relative to the water the relative abundance of the noble gases will be fractionated following Equation (20). The solubility of Ar however is similar to that of CH4 under typical subsurface conditions. The gas phase will therefore preserve an unfractionated CH4/36Ar ratio of the groundwater at the point (depth) at which saturation occurred (Ballentine et al. 1991; Fig. 15).
Gas reservoirs that preserve the ‘saturation’ CH4/36Ar ratio consistent with their
Tracing Fluid Origin, Transport and Interaction in the Crust
569
formation depth may have been transported to the trapping site dissolved in the groundwater. Case studies
We review here selected case studies to illustrate some of the main applications of noble gases to natural gas and oilbearing systems. Groundwater and natural gas transport, the Pannonian basin, Hungary. The Pannonian basin forms the Great Hungarian Plain and is an extensional basin formed in the Middle Miocene that has developed into a series of deep basins separated by shallower basement blocks. Oil and gas fields are found through-out the basin, with most to-date being Figure 15. CH4/36Ar plotted as a function of depth for gas found on the basin margins or fields in the Vienna basin, Austria (Ballentine 1991), above the uplifted basement Pannonian basin, Hungary (Ballentine et al. 1991) and the blocks. Several noble gas Po Basin, Italy (Elliot et al. 1993). These values are compared with the ‘saturation’ CH4/36Ar value calculated studies have focused on the for seawater containing 7.5×10⁻⁷ cm3 (STP) 36Ar, a basin aquifer systems (Oxburgh salinity of 0.23M NaCl equivalent, a temperature gradient et al. 1986; Martel et al. 1989; of 0.03 K/km and at hydrostatic pressure (Solid line). The Stute and Deak 1989; Stute et dashed line is the saturation value if the salinity increases al. 1992). Noble gas studies of to 3 M NaCl equivalent. The gases in the Pannonian and Po basin studies lie on the saturation line for their depth, the natural gas reservoirs are by are closely linked to the groundwater system, and may Ballentine and O'Nions (1992), have exsolved from solution. These contrast with the Sherwood Lollar et al. (1994, Vienna basin gases that have had far less contact with the 1997). We focus here on the groundwater system. Hajduszoboszlo gas field study by Ballentine et al. (1991). This field is a stacked gas field producing at various intervals between 700- to 1300-m depth and occupies a portion of the sub-basin high to the north west of the Derecske sub-basin. 3He/4He, 20Ne/22Ne, 21Ne/22Ne and 40Ar/36Ar were determined as well as He, Ne and Ar abundance. The 3He/4He ratios of between 0.18 to 0.46Ra show that between 2 to 5% of the He is mantle derived. 21Ne/22Ne and 40Ar/36Ar ratios range between 0.299-0.46 and 340-1680. These are all in excess of atmosphere derived values (0.0290 and 295.5) due to the addition of crustal radiogenic 40Ar and 21Ne (40Ar* and 21Ne*) contributing 3-15% and 32-82% of the 21Ne and 40Ar respectively. The greatest contribution of crustal-derived gases is clearly correlated with the deepest samples.
Coherent fractionation is observed in a plot of 21Ne*/40Ar* (crustal component) against 20Ne/36Ar (atmosphere-derived) pointing to a fractionation process operating on the system after mixing of these differently sourced species (Fig. 14). Plotting 4He/21Ne* (crustal component) against 20Ne/36Ar no coherent fractionation is seen (Fig. 14). This is the classic pattern for a solubility equilibrium fractionation process. Negligible fractionation between 4He/21Ne* is observed because their solubilities in water under reservoir conditions are very similar. There is no resolvable mass fractionation, and diffusion as a significant transport process in this system can therefore be neglected.
570
Ballentine, Burgess & Marty
Making the assumption that the natural gas originally contained no 36Ar, the 36Ar now in the natural gas requires a minimum volume of groundwater to have interacted with the gas phase. This is a minimum estimate because this assumes quantitative degassing of the groundwater phase, yet the observed 20Ne/36Ar fractionation discussed above occurs during partial degassing. The volume of water estimated from typical groundwater 36Ar concentrations would occupy 1000 km3 of rock at 15% porosity, some 670 times larger than the current reservoir volume. • The mass balance clearly indicates an interaction between the gas now in the field and the regional groundwater system. • CH4/36Ar ratios between 1.1 to 3.5×10⁶ in the natural gas are indistinguishable from the ‘saturation’ CH4/36Ar ratio for the depth of production and therefore consistent with gas transportation to the trapping site dissolved in the regional groundwater system (Ballentine et al. 1991; Fig. 15). Hydrocarbon migration and water-oil interaction in a quiescent basin: The Paris Basin, France. The Paris Basin provides a unique opportunity to study the characteristics of hydrocarbons that originated from a common source-rock lithology and migrated into different sedimentary layers, where they subsequently interacted with fluids of contrasting compositions. As described in the section Noble gases in ancient groundwaters and crustal degassing, the Paris Basin is a post-Variscan intra-cratonic basin in which a multi-layered aquifer system has developed. Of interest in this context are the Upper Triassic (Keuper) Chaunoy fluvial sandstones and the Middle Jurassic oolitic limestone reservoirs. The Middle Jurassic aquifer is separated from the Triassic aquifer by 400-700 m of low-permeability Lower Jurassic (Lias) mudrocks and shales, which are the source-rocks of oils in the Paris Basin. The Middle Jurassic contains lowenthalpy geothermal waters (from 50 to 80°C) and oil accumulations. The Triassic aquifer contains waters at temperatures up to 120°C associated with oil accumulations. Oil primary migration took place from the Liassic shales upward to the Jurassic limestone and laterally to the Triassic sandstone, during the Paleocene-Oligocene time (Espitalié et al. 1988). Vertical faults, affecting the Mesozoic cover of the Paris Basin and reactivated by tectonic post-Alpine stresses, have played an important role in oil secondary migration. These vertical faults constitute the preferential pathways for oil flow through the Lias. An important hydrodynamic component flowing in the Jurassic and the Triassic aquifers and contemporary with oil migration seems to have affected both the distribution of oil pools in the Paris Basin (Poulet et Espitalié 1987) and the loss of ~90% of the hydrocarbon (Espitalié et al. 1988). Cross-formational fluid flow in the Paris Basin is also apparent in the common source of salinity (halite deposited in the eastern part of the Triassic aquifer) for both Jurassic and Triassic groundwaters (Worden & Matray 1995).
Both groundwater and oil accumulations have been studied for noble gases (Marty et al. 1993; Pinti and Marty 1995, 1998; Pinti et al. 1997). The main noble gas feature in the Paris Basin fluids is the presence of a resolvable mantle-derived noble gas component, which is weaker than the one measured in the younger and tectonically active Pannonian Basin (Ballentine et al. 1991). An important in situ contribution of radiogenic noble gases is masking progressively the traces of a large-scale fluid flow, which affected the Paris Basin probably in early Tertiary time. It is likely that this episodic fluid flow introduced deep-seated mantle-derived and radiogenic noble gases into the basin, and possibly triggered the hydrocarbon primary and secondary migration within the basin (Pinti and Marty 1998). The relationship between the helium 3He/4He ratios and the total amount of 4 He in the basement, Trias and Middle Jurassic groundwaters, suggests that there are at least three sources of helium occurring in the Paris Basin. The first source is fluids circulating in the southern crystalline basement and characterized by high 3He/4He ratios (0.12-0.14 Ra) due to addition of mantle-derived 3He. The second source is Triassic
Tracing Fluid Origin, Transport and Interaction in the Crust
571
groundwaters located at the center of the basin, which is characterized by 3He/4He ratios intermediate between the basement and the Middle Jurassic fluids (3He/4He = 0.08 Ra). The third source is water located east of the Middle Jurassic aquifer, with low 3He/4He isotopic ratios (3He/4He = 0.02 Ra) resulting from the production of helium in the local reservoir’s rocks (Bathonian-Callovian limestones). The transport of radiogenic helium, argon and neon (and associated mantle-derived helium) from the Trias to the Middle Jurassic aquifer is apparent in the distribution of the radiogenic 4He/40Ar* and 21Ne*/40Ar* isotope ratios among Triassic and Middle Jurassic oil-field brines (see section Noble gases in ancient groundwaters and crustal degassing and Fig. 28, below). The 4He/40Ar* and 21Ne*/40Ar* isotope ratios clearly show a correlation and indicate mixing between the Trias and the Middle Jurassic groundwaters. The variation of the radiogenic noble gas isotope ratios can be attributed to the initial ratio of the parent elements 238,235U, 232Th and 40K in minerals and rocks, which varies for different lithologies, or to preferential diffusion of 4He and 21Ne* relative to 40Ar* from the mineral to the fluid phase. This in turn depends on the thermal and tectonic regime of the basin. The Trias groundwaters show 4He/40Ar* ratios of 4-7 and 21Ne*/40Ar* ratios of 2.5-4×10⁻⁷. These ratios could correspond to a source having a K/U ratio of about 35,000 and which releases He, Ne and Ar in water close to their production ratio. This source could be the Triassic sandstones, the crystalline basement, or both. The second source of radiogenic noble gases has high 4He/40Ar* ratios of 40 and 21Ne*/40Ar* ratios of 65×10-7 and could correspond to the carbonate, which is characterized by very low K/U ratios. In the Middle Jurassic oils, the elemental fractionation of atmosphere-derived noble gases was found to be consistent with oil/water phase equilibrium partitioning (Pinti and Marty, 1995). In the Triassic oils, the noble gas fractionation trends indicate a more complicated history, notably involving degassing of hydrocarbons previously equilibrated with groundwaters. Pinti and Marty (1995) have interpreted this degassing episode as the result of processes of gas stripping due to oil washing (Lafargue and Barker, 1988). Calculations indicated that both Middle Jurassic and Triassic oils have seen much larger quantities of waters with oil/water ratios possibly ranging between 0.2 and 0.01, whereas the present-day oil/water ratios in the Middle Jurassic and Triassic oil fields average ~ 1. Assuming a mean groundwater residence time of few Ma in the center of the Paris Basin (Marty et al., 1993), where most of the oil accumulations reside, and an integrated mean oil/water ratio in oil reservoirs lower by one order of magnitude than those presently observed, then the residence time of oils in their reservoirs should also be an order of magnitude higher than those of flowing waters and could be of the order of ~20-40 Ma. Such a figure is in qualitative agreement with current estimates for the timing of oil migration in the Basin (Paleocene-Oligocene, Poulet et Espitalié 1987; Espitalié et al. 1988). Groundwater and diagenesis, the Magnus oil field, North Sea. The Magnus oilfield is located in the East Shetland Basin, northern North Sea. The field consists of a single oil phase with no associated gas cap and contained an estimated in-place oil reserve of 2.65×10⁸ m3 oil (STP). Hydrocarbon accumulation occurs in Middle Jurassic sandstones located on the dipping flank of a tilted Jurassic fault block. Petrographic and isotopic evidence from diagenetic minerals show that minerals in the crest of the reservoir grew in pore water containing significantly more meteoric water than those down dip, which are dominated by seawater (Emery et al. 1993; Macaulay et al. 1992). Cementation of the Magnus sandstone appears to have occurred concurrently with reservoir filling at ~72-62 Ma (Emery et al. 1993). Models addressing the role of groundwater in effecting regionally observed cementation of oil-bearing systems appeal to either local dissolution
572
Ballentine, Burgess & Marty
and reprecipitation or require the regional flow of groundwater (e.g., Bethke et al. 1988; Gluyas and Coleman 1992; Aplin et al. 1993). Because the Magnus system filling occurred at the same time as the cementation it is reasonable to assume that the noble gases in the oil phase preserve a record of the groundwater volumes during the quartz precipitation. Depressurization during production results in both gas and oil phases being present at the surface. A pilot study determined that He, Ne and Ar are almost quantitatively partitioned into the gas phase under separator conditions. Given the flow rate of both oil and gas, the analyses of the gas phase alone enables an accurate reconstruction of the subsurface and single oil phase noble gas composition. Gas samples across the Magnus field were taken and the He, Ne and Ar isotopic ratios and abundances in the oil were determined (Ballentine et al. 1996). Both the He and the Ne isotope systematics require a contribution from a mantle source. If the mantle end-member is modeled using midocean ridge values (Graham 2002, this volume), 2.3 to 4.5% of the 4He and 4.3 to 6.2% of the 21Ne in the Magnus oil is mantle-derived. The remainder of the 4He and 9.0 to 12.0% of the 21Ne is crustal-radiogenic, and the remaining 21Ne is atmosphere-derived. The quantity of radiogenic noble gas associated with the Magnus oil/groundwater system can only be accounted for by production predominantly from outside the volume of the Magnus Sandstone aquifer/reservoir drainage area and the associated Kimmeridge Clay source rock formation and together with the mantle-derived noble gases, provides strong evidence for cross formational communication with deeper regions of the crust. This is not the case for the groundwater-derived noble gases. The 20Ne and 36Ar have been input into the oil phase by interaction with an airequilibrated groundwater. Because the Magnus oil field has no gas cap, this is a simple two-phase system. Similarly, because the groundwater, with the exception of a small amount of meteoric water incursion at the crest of the system, is dominated by seawater there is no variable excess air component to consider. In principle, knowing the original noble gas concentration in the seawater and the temperature and salinity of water on equilibration with the Magnus oil, together with either the 20Ne or 36Ar concentration and their respective solubilities in the oil enable Equation (19) to be used to determine the system oil/water volume ratio. In practice the noble gas solubility database for different oils is limited, and KmAr(oil) and KmNe(oil) are not known for the Magnus oil. Nevertheless noble gas solubility data is available for two oils of different density (Kharaka and Specht 1988; Table 4). If it is assumed that at any one temperature and over a small density range the relative change in solubility of both Ne and Ar is proportional, an equation can be developed that links the KmAr(oil) to KmNe(oil) in the Magnus oil (Ballentine et al. 1996). This then leaves two unknowns, the linked solubility term and the oil/water volume ratio. With two separate equations for 20Ne and 36Ar derived from the general Equation (19), these can be solved. • Noble gas partitioning between a seawater-derived groundwater and the oil phase at the average Magnus Sandstone aquifer temperature requires a subsurface seawater/oil volume ratio of 110(±40) to account for both the 20Ne and 36Ar concentrations in the central and southern Magnus samples. • The volume of groundwater that has equilibrated with the Magnus oil is indistinguishable from the static volume of water estimated to be in the down-dip Magnus aquifer/reservoir drainage volume. This suggests that the Magnus oil has obtained complete equilibrium with the groundwater in the reservoir drainage volume, probably during secondary migration, and further suggests that the concurrent cementation of the Magnus sandstone aquifer has occurred with little or no large-scale movement of groundwater through the aquifer system. Tracing the CO2 source in the west Texas Permian basin, USA. CO2 in natural
Tracing Fluid Origin, Transport and Interaction in the Crust
573
gases can originate from a number of sources including methanogenesis and oil field biodegradation, kerogen decarboxilation, hydrocarbon oxidation, decarbonation of marine carbonates and degassing of magmatic bodies. The δ13C(CO2) signature can be used to distinguish between these different sources, with the exception of magmatic and carbonate-derived CO2, which have overlapping δ13C(CO2) (Jenden et al. 1993; Sherwood Lollar et al. 1997). Although methanogenesis or oil field biodegradation can sometimes result in gas fields with up to 40% CO2 by volume, kerogen decarboxilation and hydrocarbon oxidation rarely result in gas containing more than a few percent CO2. This is in distinct contrast to decarbonation/magmatic sources, which can result in gas fields containing up to 100% by volume CO2. Noble gases can be used to distinguish between decarbonation/magmatic sources (Fig. 16; Sherwood Lollar et al. 1997; Ballentine et al. 2001).
Figure 16. CO2/3He vs. fraction of CO2. The main figure shows the range of CO2/3He values found in pure magmatic samples. CO2/3He values above this range, irrespective of CO2 content, can only be attributed to a CO2 source containing no 3He and provides an unambiguous identification of crustal-sourced CO2. Values within this range or below contain a magmatic CO2 component but have been subject to possible CO2 loss, dilution (e.g., addition of CH4 or N2), and/or crustal CO2 addition (after Sherwood Lollar et al. 1997). Inset shows the values found in CO2 rich natural gases in the JMBB field, west Texas Permian basin, which vary within the magmatic range (after Ballentine et al. 2001). Vectors A, B and C show the effect of crustal CO2 addition, CO2 loss through reaction or precipitation and dilution respectively. Near constant δ13C(CO2) rules out either loss or addition of CO2 and requires the range to be due to magmatic source variation (Fig. 18).
The west Texas Permian basin was formed as a result of the late Palaeozoic collision of South America with North America that also resulted in the Marathon-Ouachita orogenic belt as well as widespread interior continental deformation. The Val Verde basin is a foreland sub-basin of the west Texas Permian basin, and lies between the Central basin platform and the Marathon thrust belt (Fig. 17). Natural gas reservoirs show a systematic regional increase in CO2 content towards the Marathon thrust belt,
574
Ballentine, Burgess & Marty
varying from an average of about 3% in the basin center to as high as 97% on the foredeep margin of the thrust belt. The main producing formation in the JM-Brown Bassett (JMBB) field is brecciated Ordovician Ellenberger dolomite. This field reflects the regional spatial trend in natural gas CO2 content, with samples increasing from 20% to 55% CO2 towards the Marathon thrust belt. The remaining gas is dominated by CH4.
Figure 17. Showing coherent spatial variation in %CO2 and CO2/3He in CO2-rich natural gases in the Val Verde basin, part of the west Texas Permian basin (after Ballentine et al. 1991). Arrows show the direction of the regional increase in CO2 content and CO2/3He ratio towards the Marathon thrust belt. Inset shows the location of the Val Verde basin relative to the major Permian uplift and basinal features. Basins: 1, Delaware; 2, Midland; 3, Palo-Duro; 4, Anadarko; 5, Arkoma; 6, Ft Worth; 7, Kerr. Uplifts: A, Sierra Diablo; B, Central basin; C, Ozona; D, Concho arch; E, Llano; F, Devils River.
Samples from across the field were analyzed for their C, He, Ne and Ar isotopes as well as the abundance of He, Ne, Ar and major gas species. 3He/4He varies between 0.24 and 0.54 Ra. If it is assumed that the magmatic and crustal components have 8.0 and 0.02 Ra composition respectively, the measured ratios correspond to between 3.2 and 6.8% of the helium being derived from the mantle. In reality, sub-continental mantle 3He/4He ratios are believed to be slightly lower than the mantle supplying mid-ocean ridges (Dunai and Baur 1995) and the percentage mantle contributions to the JMBB are
Tracing Fluid Origin, Transport and Interaction in the Crust
575
therefore a lower limit. Similarly from the 21Ne/22Ne and 40Ar/36Ar ratios the crustal components can be resolved (4He*, 21Ne* and 40Ar*) showing 4He*/40Ar* and 4 He*/21Ne* ratios indistinguishable from average crustal production (Ballentine and Burnard 2002, this volume). This result indicates that no fractionation process has operated on these species either during release from their source, on transport, or during their residence time in the trapping structure (eliminating for example, significant diffusive loss since trapping). It was not possible to investigate the groundwater-derived noble gases due to significant amounts of air contamination on sampling (sampling procedures used were for stable isotopes, not noble gases).
Figure 18. Evolution of δ13C(CO2) and CO2/3He calculated for the gas phase of a degassing magma body (after Ballentine et al. 1991). Two models are shown: (i) The composition of the gas evolving from the magma by a Rayleigh fractionation process; and (ii) The composition of this gas in an accumulating reservoir. The model undegassed magma is taken to have δ13C(CO2) = -4.7‰ and CO2/3He = 2×10⁹, and is within the range estimated for the mantle source. The tick marks are the percentage loss of CO2 from the magma body. δ13C(CO2) fractionation between a CO2 gas phase and magma is taken to be 2‰ (Mattey 1991), and the relative solubility of He/CO2 = 5 (Bottinga 1991). Both CO2/3He and δ13C(CO2) of the JMBB field are consistent with partial degassing of the source magma body (Ballentine et al. 2001). In this context, samples with the highest CO2/3He are from the earliest stages of outgassing.
The 3He/4He correlates directly with percent CO2, showing clear two-component mixing between the hydrocarbon gas containing crustal-derived He and a CO2 component with an elevated 3He/4He. CO2/3He for all samples are within the magmatic range but vary systematically with percent CO2 (Fig 16). Various models were investigated to account for the CO2/3He variation, including crustal CO2 addition, precipitation or a combination of the latter combined with CH4 addition/dilution. None of these models were able to satisfy both the very small variation in δ13C(CO2) and the mixing vectors shown in Figure 16. A magma-degassing model was constructed that accounted for both δ13C(CO2) and CO2/3He (Fig. 18). In the context of a magma-degassing model (Figs. 13 and 18), samples with the highest CO2/3He are from the earliest stages of outgassing and are located closest to the Marathon thrust belt. A simple filling model in which reservoirs closest to the magma source are filled and then diluted by subsequent outgassing (lower CO2/3He) predicts that the highest CO2/3He ratios are furthest from the degassing magma,
576
Ballentine, Burgess & Marty
ruling out the Marathon thrust belt as the source of magmatic CO2 in the Val Verde basin. Tertiary volcanism is associated with the Basin and Range province to the west of the Val Verde basin, and some 100 km away from the JMBB study. Although this is a potential source of magmatic volatiles, this source is not consistent with the inferred direction of filling (Fig. 17). The increase in CO2 content as the MTB is approached can be accounted for if CO2 emplacement pre-dates CH4 generation in the hydrocarbon `kitchens' to the north of the gas fields. Assuming simple filling, the traps closest to these `kitchens' would have the highest CH4 content. CO2 charging, therefore, pre-dates the onset of hydrocarbon generation in the basin, which occurred about 280 Myr ago. Maximum uplift of the Central basin and Ozona platforms (Fig. 17) occurred between 310 and 280 Myr ago in response to the MTB loading. Associated deep volatile release would provide the appropriate timing, mechanism and required spatial consistency to be the source of the magmatic CO2 preserved in the Val Verde basin. • The Rayleigh fractionation model proposed to account for regional CO2/3He variation provides an important tool to identify the direction of magmatic CO2 input into a basin system; this model also accounts for the higher CO2/3He and heavier δ13C(CO2) often found in intracrustal manifestations of magmatic gas (Griesshaber et al. 1992; Weinlich et al. 1999) compared with the values in pristine mantle samples (Javoy and Pineau 1991). • Diffusion experiments on other systems have been used to estimate the residence time of natural gas in a trapping structure (Kroos et al. 1992; Schlomer and Kroos 1997). The age of emplacement inferred from this study suggests that calculations of natural gas residence times based on these diffusion experiments seriously underestimate the storage efficiency of some trapping structures, and provide support for the viability of natural gas exploration in deeper, older, and therefore more unconventional, locations. The origin of 4He-associated N2 in the Hugoton-Panhandle giant gas field, USA. The most abundant non-hydrocarbon gas in sedimentary basins is nitrogen. In the USA, 10%, 3.5% and 1% of natural gases contain >25%, >50% and >90% by volume nitrogen respectively (Jenden and Kaplan 1989). Nevertheless, the dominant sources and mechanisms responsible for focusing and enrichment of nitrogen within natural gas fields are poorly constrained. This is in part due to the multiple sources of nitrogen in the subsurface including atmosphere-derived nitrogen dissolved in groundwater, nitrogen released from sedimentary organic matter, nitrogen released from metasediments during metamorphism and, in areas of magmatic activity, an igneous or mantle nitrogen origin. The overlapping range of nitrogen isotopic values for the respective systems has meant that nitrogen isotopes alone cannot be used to quantify the contribution of these different sources to natural gas systems. Nitrogen gas associated with high radiogenic 4He concentrations is particularly common (Gold and Held 1987; Jenden and Kaplan 1989; Jenden et al. 1988; Pierce et al. 1964; Poreda et al. 1986; Stilwell 1989; Hiyagon and Kennedy 1992; Hutcheon 1999). Because of the association of 4He, and therefore other crustal noble gases such as 21Ne* and 40Ar*, the noble gases are particularly appropriate for tracing the origin of He-associated nitrogen (N2*) (Ballentine and Sherwood Lollar 2002).
The Hugoton-Panhandle giant gas field is the case type example of a system containing N2* (Pierce et al. 1964). Extending 350 km across SW Kansas and the Oklahoma/Texas Panhandles this field contained more than 2.3×10¹² m3 (STP) of recoverable gas, and produces from Permian carbonates between 400-900m depth on the south and western margins of the Anadarko basin. The isotopic compositions of the hydrocarbon gases across the entire field are indistinguishable, are hence co-genetic and
Tracing Fluid Origin, Transport and Interaction in the Crust
577
reasonably originate from the Anadarko sedimentary basin. N2 concentrations throughout the field vary between 5-75%, averaging ~15%. The highest concentrations of nitrogen in the Texas Panhandle are found on the SSW margin of the field, on the side of the field furthest from the Anadarko basin hydrocarbon ‘kitchen’. In the Oklahoma and Kansas Hugoton, the highest nitrogen content is found to the north and west of the field, again on the opposite edge of the field to the Anadarko basin. The nitrogen is locally proportional to the 4He content, although the 4He/N2 systematically increases from 0.02 in the Kansas Hugoton to 0.077 in the Texas-Panhandle (Gold and Held 1987; Jenden et al. 1988; Pierce et al. 1964). Ballentine and Sherwood Lollar (2002) show that the nitrogen isotopic composition also changes systematically in this field, decreasing from δ15N(N2) = +9.4‰ in the Kansas Hugoton to δ15N(N2) = +2.7‰ in the Texas-Panhandle. 3He/4He, 21Ne/22Ne and 40 Ar/36Ar ratios enable noble gas contributions from mantle, crustal and groundwater sources to be resolved and quantified in the samples. Crustal radiogenic 4He/21Ne* and 4 He/40Ar* ratios show a 60% excess of 4He compared to predicted crustal production values, and are typical of noble gases released from the shallow crust (Ballentine and Burnard 2002, this volume). Although significant and resolvable mantle and groundwater-derived noble gases are present, mantle 3He/N2 and groundwater 36Ar/N2 values rule out significant mantle or atmosphere contributions to the gas field N2, which is crustal in origin.
4
He/N2
Figure 19. Plot of 20Ne/N2 vs. 4He/N2 in natural gases from the Giant Hugoton-Panhandle gas field in Texas-Oklahoma-Kansas, USA after Ballentine and Sherwood Lollar (2002). This natural gas field is the case-type system in which N2 content is related to 4He concentration. Most samples fall on a line indicating simple two-component mixing between one nitrogen component that is associated with both crustal 4He and groundwater-derived 20Ne (N2*) and another nitrogen component that has no resolvable association with any noble gases. Identifying one He/N2 end-member ratio enables the relative contribution of these two nitrogen components to any one sample to be calculated. The nitrogen isotopes also vary systematically with He/N2 and from the noble gas mixing relationship, the end-member nitrogen isotopic compositions can also be determined (see text).
578
Ballentine, Burgess & Marty
A plot of 4He/N2 vs. 20Ne/N2 shows that almost all samples lie on a simple mixing line between two crustal nitrogen components (Fig. 19). One N2 component is associated with the crustal 4He and groundwater-derived 20Ne (N2*). The other nitrogen component has no resolvable association with either crustal- or groundwater-derived noble gases. An end-member 4He/N2* = 0.077 (Pierce et al. 1964) is used to define the He-associated component and enables the relative contribution of non-He associated nitrogen to each sample to be calculated (Fig. 19). In turn this enables the δ15N(N2) for each end-member to be calculated, where δ15N(N2)=-3‰ and +13‰ for N2* and the non-He associated N2 respectively. The δ15N(N2*) value is not compatible with a crystalline or high grade metamorphic source and, similar to the 4He, probably originates from a shallow or low metamorphic grade source rock. 4He mass balance nevertheless requires a regional crustal source; its association with a resolvable magmatic 3He contribution pointing to a source to the recently active Sierra Grande uplift to the west of the gas field, in the opposite direction to the Anadarko basin hydrocarbon source which is unlikely to be a source of magmatic 3He. The ratio of radiogenic 4He to groundwater-derived 20Ne is almost constant throughout the entire system and clearly indicates a link between the crustal-derived 4He (and hence the N2*) and the groundwater system. To place perspective on the volume of groundwater constrained by the 20Ne mass balance this is equivalent to the water in a 100m thick static aquifer that covers three times the area of the Anadarko basin. This in no way suggests that this is the source of the groundwater (see below) but clearly shows that a regional groundwater system is involved and that this can provide the collection, transport and focusing mechanism for a diffuse crustal 4He and N2* flux. The N2*/20Ne ratio is three times lower than the gas field ‘saturation’ ratio (in the same way as 36 Ar/CH4) and shows that the N2* transport must be in the aqueous phase. The degassing mechanism of the groundwater can be accounted for by contact between the regional groundwater system and a pre-existing reservoir hydrocarbon gas phase. • The regional groundwater cover traps 4He and N2* released from shallow sediments and low grade metamorphic rocks during the thermal hiatus generated by the Sierra Grande uplift (source of 3He) some 200-300 km to the west of the HugotonPanhandle. • West-East migration of the groundwater (note the Anadarko basin is to the North and east of the gas field) containing the dissolved magmatic and crustal-derived gases contacts a pre-existing gas phase in the form of the Hugoton-Panhandle gas field resulting in degassing of the groundwater. • Noble gases have enabled the resolution of two different nitrogen sources and their respective isotopic compositions in this field and generated a simple model to account for the source, transport and relative timing of the 4He-associated gas input into the gas field. Sediment-derived atmospheric noble gases in the Elk Hills oil field, USA. The Elk Hills oil field is located in the southern San Joaquin valley, and is located about 30 km southeast of Bakersfield, California, USA. Production to date from the Elk Hills anticline has exceeded 2 billion barrels of oil from five producing intervals ranging from the ‘Dry Gas Zone’ (2-5 Ma) to the ‘Santos Oil Zone’ (30-35 Ma). Samples were collected from gas-oil separators and 4He, 36Ar, 22Ne, 84Kr and 132Xe abundance determined (Torgersen and Kennedy 1999). These workers did not tabulate the isotopic compositions, with the exception of 4He and 40Ar*, but report that the Ne, Kr and Xe isotopes are consistent with an atmosphere-derived source. Torgersen and Kennedy give the concentrations normalized to 36Ar and relate this to the air value to obtain a fractionation value where F(nNg)= {[nNg]/[36Ar]sample}/{[nNg]/[36Ar]air}. There is an increasing enrichment related to
Tracing Fluid Origin, Transport and Interaction in the Crust
579
atomic number where F(22Ne) < F(84Kr) < F(132Xe). Although such enrichments have been previously noted in oil-related systems (Bosch and Mazor 1988; Hiyagon and Kennedy 1992; Pinti and Marty 1995), the Elk Hills study shows an average Xe enrichment factor of ~30, with the highest ratio 576 times the air ratio representing the highest 132Xe/36Ar ratio yet measured in a terrestrial fluid.
Figure 20. The Kr/Ar and Xe/Ar ratios normalized to air values to give F(84Kr) and F(132Xe) from the Elk Hills oil wells (California, USA) are plotted after Torgersen and Kennedy (1999). The filled triangles represent the composition of air and air-equilibrated water at 20°C (ASW). The open triangles represent the ratios predicted for oil-water equilibration at different oil/water volume ratios, and the shaded region labeled ‘Rayleigh Fractionation’ the range of values predicted after continuous gas loss from either the water or oil phase. The dashed line shows the weighted least squares fit through the Elk Hills data, forced through the ASW value. This data cannot be accounted for by solubility equilibrium or open system fractionation of groundwater-derived atmospheric noble gases. The data is explained by a trapped sedimentary source for atmospheric Kr and Xe that is released into the oil phase during oil formation and primary migration. The values measured in the Elk Hills samples can be compared with those measured in carbon rich extracts from cherts measured by Frick and Chang (1977).
F(84Kr) is strongly correlated with F(132Xe), but unlike earlier observations, such as the Paris Basin (Pinty and Marty 1995), the Elk Hills data cannot be attributed to fractionation from an oil-water-gas system (Fig. 20). Torgersen and Kennedy argue that the extreme values observed in the Elk Hills system are due to the preferential trapping of Xe > Kr by carbon rich sediments (the oil source rocks) which are subsequently released from the sediment during oil formation and primary migration. This argument is supported by observations of very high F(84Kr) and F(132Xe) values in a variety of carbon rich rocks including chert, thucolite and shale (Bogard et al. 1965; Frick and Chang 1977; Podosek et al 1980; Table 6). A model is proposed that considers mixing and dilution of the highly fractionated sediment-derived Kr and Xe with groundwater-derived species, and relates the decrease in F84Kr and F132Xe with an increase in 36Ar concentration in the hydrocarbons that is proportional to the groundwater/hydrocarbon ratio. This correlation is not yet well established.
580
•
Ballentine, Burgess & Marty
The identification of sediment-derived atmospheric Kr and Xe in some sample types means that the extension of solubility fractionation models (that assume a priori a groundwater origin for all atmospheric noble gases) to include Kr and Xe has to be assessed with caution on a case-by-case basis. 3
He/ 4He closure and 20Ne/ 36Ar fractionation in the Indus basin, Pakistan. The Indus basin is bound by the Pakistan foldbelt to the northwest and the Indian shield to the southeast and extends NE-SW for over 1200 km. The basin can be separated into Southern, Middle and Upper sub-basins. Rifting from Triassic times until collision with the Afghan blocks during the upper Cretaceous and Paleogene generated both the Middle and Southern Indus sub-basins. Hydrocarbon trapping structures may have been formed as early as the Cretaceous but most were formed by post collisional deformation during the Pliocene between 4.5-3.5 Ma. The sedimentary infill is dominantly marine in origin, with hydrocarbon source rocks identified mainly in Jurassic, Cretaceous and Eocene sequences. All potential source rocks have reached a high degree of maturity in the study area, with vitrinite reflectance values of between 0.85 and 0.93 Ro. There are no trapping structures producing oil and hydrocarbon reservoirs are dominated by thermogenic methane. A few fields in the middle Indus sub-basin in addition to hydrocarbon gas contain up to 70% CO2 and 23% N2. Battani et al. (2000) collected gas samples from the Middle and Southern Indus sub-basins and determined their composition, d13C(CO2, CH4, C2-C4), 4He, 20Ne, 36Ar, 3He/4He and 40Ar/36Ar. 3
He/4He ratios range between 0.009 and 0.056 Ra and are dominated by crustal radiogenic He. Battani et al. use this observation to rule out any significant magmatic contribution to either the N2 or CO2. They note that many extensional systems contain a resolvable magmatic He contribution (Oxburgh et al. 1986; Poreda et al. 1986; Ballentine et al. 1991), and in particular that old trapping structures can preserve a mantle 3He/4He signature for tens if not hundreds of million years (Ballentine et al. 1996; also see Ballentine et al. 2001). Battani et al (2000) argue that the lack of a resolvable magmatic 3 He/4He signature in the extensional Indus basin can only be explained if the basinal fluid system was open during rifting, and that no significant amounts of magmatic fluid have been preserved in the present day hydrocarbon traps. This is entirely consistent with the late development of trapping structures within the basin. Figure 21. Plot of 20Ne/36Ar vs. 1/36Ar for natural gases from the middle Indus subbasin, Pakistan (after Battani et al. 2000). Mixing is observed between two components, one with high 20Ne/36Ar and low 36Ar and the second with 20Ne/36Ar similar to unfractionated groundwater. Battani et al. have explored a variety of models to account for the high 20Ne/36Ar and conclude that the most viable mechanism is a two-stage process involving an oil phase. The first stage is Rayleigh fractionation of the residual noble gases in the groundwater after interacting with oil. The second stage is transfer of a small amount of the noble gases, accompanied by further fractionation, into the gas phase. Model conditions are discussed in the text.
Tracing Fluid Origin, Transport and Interaction in the Crust
581
20
Ne/36Ar ratios and 36Ar concentrations provides another important perspective on this system. In a plot of 20Ne/36Ar vs. 1/36Ar, there is clear mixing between a gas component that is characterized by low 36Ar and high 20Ne/36Ar values, and a second component that has higher 36Ar and groundwater 20Ne/36Ar values (Fig. 21). Battani et al interpret the low 20Ne/36Ar values to have an unfractionated groundwater source. The origin of the high 20Ne/36Ar values, up to 1.3 compared with a groundwater range of 0.13 to 0.19, is investigated in more detail. Other workers have also observed high 20Ne/36Ar values in both natural gases (e.g., Ballentine et al. 1991) and waters (Castro et al. 1998). Battani et al. note that a single stage equilibrium model for fractionation between groundwater and a gas (Bosch and Mazor 1988; Ballentine et al. 1991) cannot produce 20 Ne/36Ar values greater than ~0.6. This limit also applies for the gas phase during Rayleigh fractionation of a simple water-gas system. Battani et al. also investigate the possibility of a process of re-solution and effervescence. This would result in high 36Ar being correlated with high 20Ne/36Ar in the gas phase and can be discounted. Battani et al. (2000) argue that if groundwater is first equilibrated with an oil phase, the concentration of atmosphere-derived noble gases in the water phase will be reduced and the 20Ne/36Ar ratio increased due to the higher relative solubility of Ar in the oil phase. If this process is by a Rayleigh distillation process, the fractionation in the residual water can be extreme. Subsequent gas-water interaction can produce much more highly fractionated 20Ne/36Ar ratios than a single water-gas phase system, and the most highly fractionated values would correlate with the lowest 36Ar concentrations. Battani et al. model this process for a variety of conditions. They consider for example, the conditions required to account for the CO2-N2 rich gases in the middle Indus. The oil-water distillation process is taken to have left 30% of the 36Ar in the groundwater at ~120°C and at a depths of 3700m. Subsequent gas-water Rayleigh fractionation is modeled as leaving 90% of the 36Ar in the groundwater phase, at a temperature of 29°C and at a depth of 630 m (Fig. 21). There are clearly many variables in this modeling process that include the density of the oil and the salinity of the groundwater in addition to the parameters that have been varied to obtain a fit to the data set. In this respect it is not straightforward to assess the uniqueness of the model parameters used. Nevertheless, the model is sensitive to the depth of the gas water equilibration (pressure has a large effect on the water/gas volume ratio) and the model depths of 5 Ma) for the latter. From the concentration gradient of 4He between the
590
Ballentine, Burgess & Marty
shallow and the deep systems and assuming a Quaternary age for the former, they derived a regional 4He flux one order of magnitude lower than the whole crust flux. Tolstikhin et al. (1996) proposed the occurrence of stagnant groundwater in a study of helium and argon in waters and rocks in sedimentary Tertiary to Permocarboniferous and crystalline rocks from Northern Switzerland. They noted a general extreme loss of helium from aquifer minerals and, assuming a closed system, that associated groundwater has also lost helium generated in the porosity rock by three orders of magnitude. This implies sweep-ing out of He from the system by water circulation. Based on He and Ar isotope measure-ments in rocks and fluids (Fig. 27), they outlined the role of intra-basinal sources filled with old, stagnant waters from where He was diffusing into freshwater circulating along more permeable layers consti-tuting the aquifers. They also concluded that no external source was required in their case study. Pinti and Marty (1998) argued also that, if the Dogger waters of the Paris basin are very ancient, as suggested by stable isotope and NGT data, then in situ producFigure 26. Noble gas recharge temperatures (NGT) versus δD and δ18O values for four wells tapping groundwaters tion and production in the from the Dogger aquifer in the central area of the Paris underlying Liassic shales can Basin (after Pinti et al. 1997). Both stable isotope become a significant source of compositions and NGT indicate that these waters were radiogenic He. Such contrirecharged during a much warmer climate than today, most bution could account for the likely during the Tertiary, which demonstrates that basin aquifers can store groundwaters for long geological periods. elevated 4He/40Ar* ratios up to 100 measured in the Dogger waters, whereas the 4He/40Ar* ratios of the Triassic aquifer below the Dogger aquifer, and separated by the Liassic shales, are close to the radiogenic production ratio, providing evidence for exchange with the underlying basement. Advective versus diffusive transfer of noble gases in basins These studies illustrate the complex problem of the nature of noble gas transfer in basins. There is no doubt that both advection and diffusion play major roles, but the respective strengths of each process are very different depending on the scale of observa-
Tracing Fluid Origin, Transport and Interaction in the Crust
591
tion. Diffusion allows quantitative transfer of noble gas isotopes from minerals to waters and is a temperature-, and atomic radius-dependent process (see Ballentine and Burnard 2002, this volume). At larger scales such as that of basins or even that of the whole continental crust, we have seen in this section that contrasting conclusions can be drawn. High He contents in deep aquifers can be accounted for only by mixing between stagnant waters sampling aquitards and waters flowing in aquifers, or by advocating the occurrence of large-scale He fluxes from the whole continental crust. The main difficulty of this problem is the efficiency of helium transfer in the water-saturated crust and in overlying sediments. The diffusion rate of any species (e.g., He) in semipermeable layers can be expressed as the product of the species diffusivity at local tempera-ture by a coefficient taking into account the geometry of the transfer path, and often defined as the tortuosity of the medium. The tortuosity can be reliably estimated for permeable sedimentary rocks that have a well-characterized porosity, such as oolithic limestone, porous sandstones, etc. In this case the diffusion rate is higher and comparable to the diffusivity in water. The problem is much more difficult in the case of semi-permeable or even impermeable layers such as shales or marls where the connectivity between pockets of interstitial water is uncertain and difficult to evaluate from laboratory measurements. Labor-atory experiments indicated either relatively high He mobility in analogs of deep-sea sediments at rates comparable to, although slightly lower than, diffusion in water (1.33.0×10-9 mol/m2.s, Ohsumi and Figure 27. Measured and computed He contents of Horibe 1984). However, Rebour et al. groundwaters in sedimentary Tertiary to Permo(1997) designed a new diffusion Carboniferous sequence of Northern Switzerland after Tolstikhin et al. (1996). The measured He experiment for estimating diffusion of contents of rocks and waters are much lower than He from He-saturated water through those expected for a closed system, pointing to loss cm-thick shale discs and found an of helium by groundwater circulation. These authors extremely low diffusivity for a shale concluded that no He source external to the aquifers sample from the Callovo-Oxfordian were required and that the He contents of sampled groundwaters could all be accounted for by mixing aquitard of the Paris basin of 2×10-12 between circulating groundwaters and old, stagnant mol/m2s. Considering an aquitard waters. thickness of typically 300 m in the Paris basin, it would take helium about 1 Ma to diffuse through the aquitard using the Ohsumi and Horibe (1984) value, and about 1 Ga using the Rebour et al. (1997) measurement. Even taking into account the increase of temperature with depth, it can be concluded either that noble gases can diffuse quantitatively through semi permeable layers, or that shales can constitute
592
Ballentine, Burgess & Marty
efficient traps for noble gases over geological periods, depending on which diffusion value is adopted. The case of high diffusivity of He in sediments supports models advocating large scale vertical diffusion of helium through basins (e.g., Andrews et al. 1985a, Castro et al. 1998b, Torgersen and Clarke 1985). Notably, Castro et al. (1998a,b) proposed that the difference of 21Ne*/40Ar* and 4He/40Ar* ratios between the Trias, where these ratios are close to the radiogenic production values of the crust, and the overlying Dogger aquifer groundwaters, where these ratios exceed the production values up to an order of magnitude, are due to noble gas elemental fractionation by diffusion in the inter-bedded Liassic shales. Without ascribing to a deep crustal He flux, Tolstikhin et al. (1996) suggest an intrabasinal origin for radiogenic helium. Pinti and Marty (1998) and Winckler et al. (1997) predict that impermeable layers can accumulate and store noble gases over geologically significant periods of time. Recently, Dewonck et al. (2001) noted that Triassic groundwaters of the Eastern part of the Paris basin contain a significant amount of 3He, in relation to the nearby Rhine graben tectonic activity, whereas the Dogger waters separated by the Liassic shales from the Trias do not yet show such a signal. Since the magmatic activity in the Rhine graben started at least in the Miocene, Dewonck et al. suggested that the Liassic shales acted as an impermeable barrier since at least the end of the Tertiary. The occurrence of noble gas horizontal barriers in basins requires noble gas vertical transport by advection through, e.g., faults and major tectonic events. The intrabasinal transport of solute species has been demonstrated for salinity, Sr and C isotopes in the Paris basin (Worden and Matray 1995). Pinti and Marty (1995) noted that there exists a relationship between 21Ne*/40Ar* and 4He/40Ar* ratios in Dogger waters (Fig. 28) that is consistent with mixing between a Triassic end-member presenting radiogenic ratios close to the crustal ones, and a Dogger end-member enriched in 4He and 21 Ne* and partly produced in situ or in adjacent shales (the U/K ratio of Dogger limestone is higher than that of the crust by one order of magnitude). They furthermore noted the distribution of noble gas ratios was consistent with those of salinity and Sr isotope values, outlining the zones of mixing. Tentative synthesis The quantification of the 4He flux and its application to deep groundwater studies, if based only on hydrological modeling or laboratory analogs, would give disparate answers. Nevertheless, a large of number of case studies have accumulated pertinent observations. In the following we attempt a synthesis of these, taking into account the tectonic and structural contexts of each case study. Concerning the estimation of deep groundwater movement using noble gases: It does not appear possible to assume a priori a He accumulation rate in aged groundwaters. The studies presented in this section show that the 4He accumulation rates are highly variable, from virtually no external 4He contribution required, to 4He accumulation rates apparently exceeding the 4He flux from the whole continental crust. Hence the expectation that the 4He flux from the crust into aquifers could be used to estimate groundwater residence time is not valid. Noble gases studies suggest that flow rates in basins are discontinuous and variable in time and space. For example, the water velocity in the Triassic aquifer of the Paris basin decreases drastically with distance from the recharge area and therefore with depth (Dewonck et al. 2001). Stute et al. (1992) also noted a similar decrease of water movement with depth in the case of the Great Hungarian Plain. It has also been suggested that deep fluid movement is controlled by tectonic events affecting the basins (Ballentine et al. 1991, 2001; Pinti and Marty 1995).
Tracing Fluid Origin, Transport and Interaction in the Crust
593
Figure 28. Relationship shown between 21Ne*/40Ar* and 4He*/40Ar* in groundwaters from the Dogger (open circles) and the Trias (black squares) aquifers, Paris Basin, France (after Pinti & Marty 1995). The average crustal production and the Dogger limestone production values are indicated by filled and open stars, respectively. The Trias values can be accounted for by contribution of crust-derived noble gases, whereas the Dogger values illustrate cross-formational fluid circulation allowing mixing between Trias and Dogger groundwaters.
It is possible in some cases to extend the geochronology of groundwaters beyond the range of ages addressed by 14C using 4He accumulation. At present this requires calibration by an external constraint on water residence time (e.g., stable isotopes, noble gas paleotemperatures) or a simple hydrological model that enables the assumption of continuity in the groundwater flow to be made. A more detailed understanding of the processes that control this calibration have the potential to increase the utility of this dating tool. Unique information about groundwater residence times and cross formational flow can be derived from noble gases. The occurrence of 3He excesses that cannot be accounted for by production in the crust or in basins and are attributed to a mantle origin demonstrate without ambiguity the occurrence of cross formational flows. 4 He/21Ne*/40Ar* ratios close to the production values found in shallow aquifers can hardly be established in situ because it would require temperatures much in excess of those prevailing in these aquifers (Ballentine et al., 1994; Ballentine and Burnard 2002, this volume). They instead provide evidence for a contribution of a fluid component coming from much deeper regions of the basins or of the crust. Noble gas paleotemperatures coupled with stable isotope data indicate that basins can host waters for geologically significant periods of time. In two studies of Northern Poland (Zuber et al. 1997) and the Paris basin (Pinti et al. 1997), stable isotope data and NGT up to 25 °C require waters in deep aquifers to have been recharged in much warmer periods than the Quaternary, implying residence times of several Ma at least. This would translate to groundwater (Darcy) velocities on the order of a cm/yr. It is probable that in these conditions, the water flows cannot be modeled simply using
594
Ballentine, Burgess & Marty
Darcy’s law and may be discontinuous, with periods of more rapid circulation under favorable tectonic conditions alternating with quiescent periods during which waters are stagnant. Table 7. He flux from different continental regions. Heat flux: n = normal, mod = moderate. Not req’d = not required. Area
Method
Residence time
GW = groundwater Accum = accumulation
continents global (relative to total Earth's surface)
Heat flux
U,Th in crust
4
3
He flux
He flux
Ref.
10-6 mol/m2.yr
10-12 mol/m2yr
1.4-1.6
0.03
1-3
0.18
2
3,4
3
He excess in oceans 14
Great Artesian Basin Australia
GW Accum
C < 50 Kyr
n
not req’d
-
2
Great Artesian Basin Australia
GW Accum
hydrologic > 100 kyr
n
1.6
0.1
2
Auob sanstone Namibia
GW Accum
n
0.4-1.5
-
2,5
Northern Taiwan
3
-
mod
1.3-1.4
2-4
6
14
He/4He in gas wells
C
4
Great Hungarian Plain Hungary
GW Accum
He gradient discharge area
high
0.03-0.24
0.09-0.26
7
Great Hungarian Plain Hungary
GW Accum
Total water discharge X 4He
high
4.1
3.8
8
Molasse basin Upper Austria
GW Accum
geochemistry
n
~ 0.1
not reported
9
Molasse Northern Switzerland
GW Accum
noble gas mass balance
n
not req’d
not req’d
10
Paris basin, centre France
GW Accum
multi-layer model 14 C in Albian
n
0.2
0.02
11
Paris basin, centre France
GW Accum
stable isotopes NGT
n
< 0.2
< 0.02
12,13
Paris basin, centre France
GW Accum
2-D model noble gas calib.
n
2
0.2
14
Eastern Paris basin Lorraine, France
GW Accum
mod
2-8
1-3
15
14
C
1) O'Nions and Oxburgh 1983; 2) Torgersen and Clarke 1985; 3) Torgersen and Clarke 1987; 4 : Craig et al. 1975; 5) Heaton 1984; 6) Sano et al, 1986; 7) Stute et al. 1992; 8) Martel et al. 1989; 9) Andrews 1985; 10) Tolstikhin et al. 1996; 11) Marty et al. 1993; 12) Pinti and Marty, 1995; 13) Pinti et al. 1997; 14) Castro et al. 1998; 15) Dewonck et al. 2001
Tracing Fluid Origin, Transport and Interaction in the Crust
595
Concerning the magnitude of noble gas fluxes in the continental crust and through basins (Table 7): Estimating the flux of He isotopes using groundwater requires us to have constraints on groundwater residence times. The best of these is 14C groundwater dating but is generally limited to groundwater recharge areas and enables the derivation of He fluxes only for these areas (Dewonck et al. 2001; Heaton 1984; Torgersen and Clarke 1985). Hydrologic (Darcy) ages are often not applicable because variations in hydrolic conductivity along the flow path cannot be quantitatively estimated. Independent constraints such as stable isotope signatures or noble gas paleotemperatures can help in constraining water residence time in a qualitative way (Pinti et al. 1997; Zuber et al. 1997). Volumetric estimates of groundwater discharges (Martel et al. 1989; Stute et al. 1992) or 3He/4He isotope gradients with depth (Sano et al. 1986) offer promising opportunities to derive quantitative estimates of He isotope fluxes. The magnitude of He flux from the continental crust is related to the volcano-tectonic setting. 3He and 4He fluxes tend to be higher in areas having experienced Tertiary and Quaternary volcanism and/or being affected by active tectonics such as rifting and/or stretching (Rhine graben; eastern margin of the Paris Basin; Dewonck et al. (2001), Taiwan; Sano et al. (1986), Pannonian basin; Martel et al. (1989), Ballentine et al. (1991), Stute et al. (1992)). In these areas, not only does 3He degassing underline the occurrence of magmatism at depth, but also enhanced degassing of crustal 4He takes place at rates that are comparable to, or higher than, that representing degassing of the whole continental crust (Sano et al. 1986; Ballentine et al. 1991, Dewonck et al. 2001). The degassing flux is not continuous as previously proposed. High 4He fluxes from active regions suggest that thermal and tectonic events allow degassing of radiogenic 4He stored in the crust during quiescent periods. Crustal degassing is therefore intermittent and not in a steady state. Concerning He isotope fluxes in stable continental areas, the situation is less clear. Whereas studies of the Auob sandstone, Namibia, and the Great Artesian basin, Australia, concluded that a 4He flux similar to that produced by the whole continental crust was required, those of the Paris basin in its central part led to contrasting conclusions, requiring either limited 4He flux (0.1 times or less than the whole crust one, (Marty et al. 1993; Pinti and Marty 1998)), or similar to the latter (Castro et al. 1998b), depending on the approach adopted. The high 4He fluxes for the GAB and the Paris basin were derived mostly from estimates of hydrologic parameters combined with noble gas measurements, whereas the low flux of the Paris basin was derived from independent geochemical arguments (14C dating, stable isotope and noble gas paleotemperatures). For deep groundwater in southern Poland, a flux one order of magnitude lower than the whole crust flux was derived. For aquifers in the peri-Alpine Molasse, a low flux was derived from water geochemistry constraints (Andrews et al. 1985b) or no flux was required from a noble gas mass balance approach (Tolstikhin et al. 1996). For these basins, the 3He flux from the mantle was found to be two orders of magnitude lower than that estimated for global mantle degassing.
This area of research certainly deserves more investigation, given its importance in the fields of noble gas geochemistry and of groundwater research. It can be anticipated that the increasing shortage in water resources and the underground waste disposal programs will promote well-focused case studies in the not-far future. MAGMATIC FLUIDS IN THE CRUST Mantle degassing in the continental crust: The noble gas imprint
Noble gases in the mantle are trapped in minerals and, without magma generation
596
Ballentine, Burgess & Marty
and transport, could not reach the Earth's surface because diffusion, even at mantle temperatures, does not enable significant transport distances over geological time (Ballentine and Burnard 2002, this volume). It is likely that the occurrence of mantlederived 3He in basin fluids indicates the generation and the degassing of magmas at depth (Oxburgh et al. 1986). In fluids present in the continental crust, the isotopic ratio of helium varies widely between the isotopic composition of radiogenic helium (~0.02 Ra, Ballentine and Burnard 2002, this volume) and that of mantle helium (8Ra for the upper mantle, Graham 2002, this volume). 3He/4He ratios higher than 0.1 Ra provide strong evidence for the presence of mantle-derived fluids. 3He/4He ratios between 0.02 Ra and 0.1 Ra are more ambiguous to interpret. He isotope fractionation may occur during helium transfer from minerals to rocks, although a detailed study of the Carnmenellis granite, S.W. England has indicated that 4He is released into crustal fluids preferentially to 3He (Martel et al. 1990). Because 3He is produced by the thermal neutron activation of 6Li which produces 3 H and then 3He, the 3He/4He due to natural nuclear reactions in crustal rocks is a direct function of the Li content of rocks and minerals (Ballentine and Burnard 2002). In order to get 3He/4He ratios in the range 0.1 Ra in the producing rocks, several hundreds of ppm Li are required, which represent exceptional situations for continental rocks. Consequently, 3He/4He ratios higher than 0.02 Ra may also be interpreted as representing addition of mantle-derived He (Marty et al. 1993). It has become clear in recent years that the isotopic composition of helium, dissolved in continental groundwaters or other near-surface fluids, can vary markedly from place to place. This variation appears to correlate with geological setting: stable regions are characterized by helium generated by radioactive decay processes within the continental crust while that collected in zones of active extension or young volcanism is everywhere marked by the presence of a mantle-derived component (e.g., Hooker et al. 1985b, Mamyrin and Tolstikhin 1984; Martel et al. 1989; Sano and Wakita 1985). A review of the relationship between helium isotopic ratios and tectonic settings can be found in Polyak and Tolstikhin (1985). Two recent studies have addressed the relationship of helium isotope ratios with tectonics in the continental crust. Polyak et al. (2000) have shown that there existed for the western Caucasus a correlation between the heat flow and 3He/4He ratios of fluids. Such relationship can be understood as two different consequences of a common cause: the development of rifting and mantle decompression beneath a thinned continental crust, which ultimately allows partial melting and mantle degassing. Without magma generation, it would be impossible for the mantle to lose its volatile elements since the process of even grain boundary diffusion is too slow to enable quantitative extraction of noble gases (Ballentine and Burnard 2002, this volume). Another example of a relationship between He isotopes and tectonics is given by the western Alps and their adjacent regions (Marty et al. 1992). It is evident from Figure 29 that mantle helium degassing occurs in the crust peripheral to the Alpine orogenic belt and that the occurrence of mantle-derived helium on an European wide scale coincides approximately with the recent volcanic provinces around the Alps. Furthermore, helium presenting radiogenic isotopic ratios is often found in nitrogen-rich gases of presumably crustal origin whereas He enriched in mantle-derived 3He is associated with CO2 having an isotopic composition typical of mantle-derived carbon (δ13C around -5‰). Thus the isotopic composition of helium in natural gases and waters enables the unambiguous determination of the areas where mantle degassing is taking place through the continental crust. The coincidence between the geographic distribution of He isotopic ratios and the recent volcanic provinces around the Alps is consistent with the view that the release of deep-seated gases occurs in regions where partial melting has taken place (Oxburgh et al.
Tracing Fluid Origin, Transport and Interaction in the Crust
597
1986). In these cases, mantle-derived helium and undoubtedly other volatiles released during melting are emplaced in the crust and reach the near surface. In contrast, the thickened crust of the Alpine block shows little or no evidence of mantle 3He or indeed associated volcanism.
Figure 29. Distribution of 3He/4He ratios (expressed as R/Ra, where Ra is the atmospheric value) measured in fluids (mineral spings, natural gases) in the western Alps and adjacent regions (after Marty et al. 1992). Fluids sampled in the Alpine regions where the Moho depth exceeds 30 km have 3He/4He ratios dominated by crustal helium (R/Ra < 0.2) whereas fluids sampled in the peripheral regions subject to rifting, Tertiary to Quaternary volcanism, and lithospheric thinning are characterized by the contribution of mantlederived helium rich in 3He.
On a regional scale, the area over which mantle gas escapes exceeds that of surface volcanism. For example, mantle He is already apparent in the Drôme region 60 km away from the first volcanic center. Likewise, mantle He is present in the Lorraine groundwaters about 100 km west of the Rhine graben (Dewonck, 2001), which demonstrates that groundwater circulation is likely to be responsible for lateral transport of mantle-derived volatiles in the continental crust. Helium isotope data from the sedimentary basins around the Alps are consistent with the view that active extensional basins (e.g., the Pannonian basin) are associated with igneous activity and are degassing helium that has a clear mantle signature while loading basins (e.g., the Po basin) often have helium that is of crustal origin. Because helium can be used as a sensitive tracer of the contribution of mantlederived volatiles, its isotopic composition in basinal waters bears important information on the tectonic context having led to the formation of basins, on the origin of the heat flux through basins, and on cross formational flows within basins (e.g., Martel et al. 1989; Marty et al. 1993; O'Nions and Oxburgh 1988; Sano et al. 1986; Stute et al. 1992). Figure 30a-c represents the statistical distribution of He isotopic ratios in fluids sampled in different basins worldwide. In the case of Europe, basins developing in extensional domains such as the Pannonian Basin (Martel et al. 1989), the Vienna Basin (Ballentine 1997), or the North Sea rifting systems (Ballentine et al. 1996), show the highest mantle3 He contributions, whereas a loading basin like the Po Basin in the foreground of the Alpine orogenesis contains purely radiogenic helium (Elliot et al. 1993). In many gas fields of Canada and the U.S., mantle He is found (Hiyagon and Kennedy 1992, Jenden et
598
Ballentine, Burgess & Marty
al. 1988, 1993; Ballentine and Sherwood Lollar 2002), and the highest mantle signals are observed in hydrocarbon fields trapped in the Green Tuffs of Northeast Japan (Sano and Wakita 1985). • The detection of mantle-derived helium in sedimentary fluids (water and hydrocarbon) suggests the occurrence of large-scale upward fluid migration and helium sources external to the aquifers. Moreover, the presence of mantle-derived 3He often implies the occurrence of still active tectonics under the concerned basins, since it requires mantle melting and the generation of magma to transport efficiently 3He and other volatiles to the Earth's surface.
Figure 30. Histograms showing the distribution of 3He/4He ratios measured in fluids (hydrocarbons, groundwaters) sampled in various sedimentary basins worldwide. a - Europe; b- North America; c China and Japan (see relevant references in the text). In most cases 3He/4He ratios vary between a radiogenic end-member characteristic of crustal or sedimentary production, and a mantle endmember enriched in 3He, suggesting the contribution of mantle-derived fluids and possibly of mantle-derived heat in some cases.
NOBLE GASES IN MINERAL DEPOSITS AND HYDROTHERMAL FLUIDS
The conservative behavior and chemical inertness of noble gases has led to their extensive use to provide information on the fluxes, movement and interactions of contemporary crustal fluids. A major advance has been in extending these studies to characterize ancient waters in fluid inclusions (Turner et al. 1993). The principal aims of these studies are to provide data on the noble gas geochemistry of inclusion fluids and understand the observations in terms of likely sources and interactions. This information provides novel insight into a palaeofluid’s evolutionary history and can assist in discriminating between different models for the formation of hydrothermal mineral deposits. Because of the large differences in end-member isotopic and elemental compositions, He and Ar are the most informative and widely studied noble gases in
Tracing Fluid Origin, Transport and Interaction in the Crust
599
Table 8. Important nuclear reactions for Ar-Ar methodology. Reactiona
Approximate conversion: element/product (mole/mole)b
Approximate detection limit of parent element (g)c
37
Cl(n,γ)38Cl(β)38Ar
10-6
10-10
39
K(n,p)39Ar
10-7
10-9
40
Ca(n,α)37Ar
10-7
10-9
79
Br(n,γ)80Br(β)80Kr
10-5
10-12
81
Br (n,γ)82Br(β)82Kr I(n,γ)128I(β)128Xe
10-6
10-12
U(n, fission)Kr and Xe isotopesd
10-5
10-12
127 235
a) All products listed stable except 39Ar (t½ = 269 days) and 37Ar (t½ = 35.04 days) b) Conversion factors depend upon isotopic abundance of parent isotope, fast and thermal neutron flux and neutron cross sections. Approximate values shown are for typical fast and thermal neutron fluxes of 1018 and 1019 cm-2 respectively. c) Detection limits based upon 10× typical blank or background level product noble gas isotope in MS1 mass spectrometer (University of Manchester). d) Detection limit of 235U based upon production of 134XeU.
mineralizing fluids (Simmons et al. 1987; Stuart and Turner 1992; Stuart et al. 1995; Burnard et al. 1999). Furthermore, the use of 40Ar-39Ar methodology provides a means to combine noble gases with a range of geochemically important elements in the inclusion fluids including K, Ca, Cl, Br and I (Table 8). In a series of groundbreaking studies, Turner and co-workers showed how 40Ar-Cl and K-36Ar correlations could be used to disentangle mixtures of Ar components in order to determine the origin of the fluids, the source of salinity and the age of mineralization (Kelley et al. 1986; Turner 1988; Turner and Bannon 1992). The method was soon extended to include measurements of Br, I and noble gas isotopes of Kr and Xe (Bohlke and Irwin 1992a). Halogens (Cl, Br and I) are particularly important constituents of crustal fluids. They can be used to fingerprint individual fluid sources, but are especially useful for identifying modification processes such as seawater evaporation, halite precipitation and interaction with organic-rich or evaporite-bearing units. Moreover, halogens do not exhibit changes in elemental ratios as the result of vapor phase separation (e.g., boiling), a mechanism whereby noble gas concentrations and elemental ratios can become strongly modified. The main difficulty with applying noble gas studies to ancient fluids has been: (1) the presence of atmospheric noble gases as a ubiquitous contaminant; and (2) assessing modifications to noble gas isotopes by post-entrapment processes including in situ production and diffusion in the inclusion fluids and host minerals. Lower abundance and higher mobility means that post-entrapment processes are more serious for He than Ar. A persistent and seemingly intractable problem with noble gas studies of hydrothermal fluids is the presence of modern-day atmospheric noble gases in the samples. Atmospheric gases are either adsorbed on the mineral surfaces, or sealed in
600
Ballentine, Burgess & Marty
voids and cracks within mineral grains. This problem can be partially alleviated by appropriate choice of noble gas extraction technique and most often in vacuo crushing, or laser microprobe to target groups of related inclusions, are employed to preferentially extract gases from fluid inclusions (Bohlke and Irwin 1992a, Kendrick et al. 2001a). However, the difficulty remains of resolving a mixture of atmospheric and air saturated water (ASW) noble gases. Post-entrapment modification of He and Ar isotopes
He and Ar isotopes that are trapped within minerals can be modified in one of four ways and must be either ruled out as significant sources or a correction applied before interpretation can be made: (1) U, Th and K may be present in solution or in daughter minerals within fluid inclusions. 4 He and 40Ar produced from decay since mineral precipitation may therefore be released with the inclusion fluids. The production of 4He and 40Ar can be calculated using Equations (13) and (19) in Ballentine and Burnard (2002, this volume), respectively. Alternatively, if the proportion of fluid-derived 4He and 40Ar can be determined, then the excess 40Ar or 4He may be used to calculate a deposit age. (2) Radioactive decay of U and Th and their radioactive daughter products within the lattice of a sample produces 4He, which may diffuse or recoil (~20 μm) into fluid inclusions. The amount of He entering fluid inclusions will depend on the inclusion size distribution, the distribution of the parent elements and on the He diffusion processes within the host mineral, all of which are difficult to quantify. Shorter recoil lengths and lower diffusivity make this mechanism unimportant for 40Ar. Significant volume diffusion of He in host minerals can be identified by progressively lower 3 He/4He ratios during sequential crushing consistent with smaller fluid inclusions having higher radiogenic He contents because of their higher surface area/volume (Stuart et al. 1995). In these cases it is only the 3He/4He of the initial crush that provides a minimum value for the fluid 3He/4He at the time of trapping, as this stage releases the largest inclusions. Dense, poorly cleaved sulfides (e.g., pyrite) appear to be the best retainers of noble gases and hence noble gas isotopic and elemental signatures. The incorporation of lattice trapped 40Ar would be expected to create an increase in the 40Ar/36Ar ratio with crush step, however, decreasing contamination of air or the rupturing of increasingly primary inclusions would also have the same effect. (3) Nucleogenic production of 3He dominantly via the reaction Li(n,α)3H(β)3He (Morrison and Pine 1955). The principal source of neutrons is from (α,n) reactions on light elements. The α-particles are supplied from decay of U and Th and decay products. Production of 3He is controlled by the Li content (Mamyrin and Tolstihkin 1984). The concentration of these elements can be measured within each sample and appropriate correction applied if necessary. (4) Cosmogenic He is produced in the uppermost 1 m of the Earth’s surface with a 3 He/4He of about ~0.1 and may be a very important post-entrapment mechanism. Therefore, it is essential that samples are mined at depth and have spent very little (if any) time at the Earth’s surface. The effects of these modification mechanisms will obviously increase with sample age and with lithophile element content. Previous studies have shown that the postentrapment production of 3He and 4He within sulfides (pyrite, sphalerite and galena) is insignificant when compared to the measured values. Thrower (1999) studied sulfides from deposits of the Colorado mineral belt (60-15 Ma) and determined post-entrapment isotope production to be 8000) and is formed by mixing of mantle and crustal components prior to mineralization. The modified ASW end-member has low 3He/4He (0.01 Ra) and low 40Ar/36Ar (≥296) formed by mixing of atmosphere (Ar) and crustal He most likely during heating and interaction of meteoric fluid heated during mineral deposit formation. The mixing line A is constructed by making assumptions about the end-member He/Ar ratio and the 40Ar/36Ar value of the mantle component. The line has curvature, r = 1400 (modified from Burnard et al. 1999).
Figure 32. 40Ar/36Ar vs. Cl/36Ar for vein quartz samples from the Globe Miami copper prophyry deposit, Arizona, USA. Solid symbols - quartz samples from the inner zone of the deposit; open symbols - quartz samples from the outer zone of the deposit. Data from both zones are compatible with mixing of a low salinity meteoric end member (high 36Ar) and a high salinity magmatic end member (high 40Ar and Cl). Samples from the inner zone are characterized by having a higher magmatic component (higher 40Ar*/Cl value) compared to those from the outer zone. Data fields shown for comparison: (A) Mantle fluids in diamonds (Johnson et al. 2000; Burgess et al. 2002); (B) Copper porphyry deposits (Kendrick et al. 2001b, Irwin and Roedder 1995); (C) Crustal fluids (Kelley et al. 1986; Bohlke and Irwin 1992b,c, Turner and Bannon 1992; Burgess et al. 1992; Polya et al. 2000; Gleeson et al. 2001; Kendrick et al. 2002a).
Tracing Fluid Origin, Transport and Interaction in the Crust
603
indicates mixing between a high salinity magmatic fluid and low salinity meteoric fluid. The magmatic component in Figure 32 has elevated 40Ar/36Ar and a 40Ar*/Cl given by the slope of the correlation. Samples from interior zones of the deposit are dominated by the magmatic component with 40Ar*/Cl up to 57×10-6. In contrast outer zones of the deposit are dominated by ASW and have lower 40Ar*/Cl of 19×10-6. Wide variations exist in 40 Ar*/Cl compositions of fluids enabling likely sources to be identified. Mantle fluids in diamond show high 40Ar*/Cl values in the range 550-1350×10-6 (Johnson et al. 1999; Burgess et al. 2002). In contrast, typical crustal fluids exhibit 40Ar*/Cl values between 30 and 2,500 times lower (0.6-5×10⁻⁶; Turner and Bannon 1992) while 40Ar*/Cl of porphyry copper deposits are intermediate. Higher 40Ar*/Cl are predicted for metamorphic fluids which may acquire high concentrations of excess 40Ar by thermal release from minerals without a concomitant release of Cl. The effects of atmospheric Ar can be examined using the Cl/36Ar ratio. The concentration of atmospheric Ar can be calculated if absolute abundances of chlorine in the inclusions can be determined by an independent method. The main limitation to this approach is in the accuracy with which the bulk salinity of the fluid inclusion can be obtained. This is done using thermometric analyses of individual fluid inclusion types combined with a qualitative assessment of their abundance. The concentration of 36Ar in inclusion fluids can be considerably above ASW values (10-6 cm3/g H2O) probably reflecting the presence of trapped modern atmosphere. Furthermore, it is difficult to resolve air and ASW mixtures because of their similar isotopic compositions. Elemental noble gas ratios are important for partially distinguishing these components, for example, the low salinity end-member (Cl/36Ar ≤ 106) in the Globe Miami porphyry copper deposit (Fig. 32) has 40Ar/36Ar ~ 296, but 84Kr/36Ar are between the values for air (0.02) and ASW (0.04) indicating it is a mixture of meteoric water and air (see Fig. 6 in Kendrick et al. 2001b). The present data do not enable distinction between modern-day air and palaeoatmospheric Ar, and it is possible that both are present in the samples. The effect of boiling. Evolution of a hydrothermal fluid may involve boiling and gas loss, this leads to fractionation of noble gases from Cl, but does not affect the isotopic signature. After boiling the fluid has higher salinity but is depleted in noble gases that are preferentially partitioned into the vapor phase. An interesting example is Bingham Canyon copper porphyry deposit, Utah which contains a high proportion of vapor phase inclusions and low 36Ar concentration in the fluid of 0.2-0.6×10⁻⁶ cm3/g, below that of ASW (Irwin and Roedder 1995; Kendrick et al. 2001b). The Kr/Ar and Xe/Ar ratios of these fluids are significantly higher than ASW and Cl/36Ar are an order of magnitude higher than in similar porphyry copper deposits from Arizona (Kendrick et al. 2001b). These characteristics are most easily explained as the effects of boiling (Kendrick et al. 2001b), rather than being indicative of a magmatic fluid (Irwin and Roedder 1995). Radiogenic nobles gases (40Ar* and 4He). The effects of atmosphere and ASW can be removed in order to investigate the relative contributions of the crustal and mantle components by considering only the radiogenic noble gases. The mantle beneath the crust has 40Ar*/4He = 0.5 and R/Ra = 6-8, while the crustal values are 40Ar*/4He = 0.2 and R/Ra = 0.01-0.05. Thus, mixing between crust and mantle components will form linear mixing trends on a plot of 3He/4He versus 40Ar*/4He (Figs. 12, 33). However, fractionation of He and Ar will produce a horizontal trajectory on the figure. Extrapolation of mixing trends to known 3He/4He values for each end-member can give 40Ar*/4He values or fractionation state of a given end-member. Available data indicate that Ar and He in both mantle and crustal end-members are fractionated. Mississippi Valley-type (MVT) deposits from the
604
Ballentine, Burgess & Marty
Pennine orefield, UK, show low 3He/4He and 40Ar*/4He values consistent with models of formation from basinal brines in which a mantle component is absent (Stuart and Turner 1992; Kendrick et al. 2002a,b). The 40Ar*/4He values are lower than the crustal value consistent with chemical leaching and incorporation of crustal He by low temperature fluids (Fig. 33). This is supported by fluid inclusion homogenization temperatures that are mostly between 90-200°C (Kendrick et al. 2002a and references therein), below the closure temperature for Ar in most crustal minerals (McDougall and Harrison 1999). In contrast, fluids associated with porphyry copper deposit mineralization, intrusion-related hydrothermal systems where magmatic fluids are invaded and progressively dominated by meteoric water, show magmatic 3He/4He ratios, but have 40Ar*/4He above the mantle production ratio (Fig. 33). The intrusion will have a high temperature thermal front associated with it, which may be capable driving 4He from the crustal basement rocks more efficiently than 40Ar; assimilation of this crust will lead to a high 40Ar*/4He ratio. Other deposit types show mixing trends between the fractionated crust and mantle endmembers (Fig. 33). Combined with the Cl abundance, the 40Ar*/Cl ratio obtained from irradiated samples can be used to calculate the concentration of excess 40Ar in the inclusion fluids. After appropriate correction for radiogenic 40Ar formed by in situ decay of K in the inclusions, the remainder is excess 40Ar carried by the brines from which the host mineral was precipitated. The concentration of excess 40Ar is useful as a measure of the extent of fluid-rock interaction (Kelley et al. 1986), residence time of the fluid in an aquifer (Turner and Bannon 1992) and for evaluating fluid circulation patterns in sedimentary basins (Kendrick et al. 2002a).
Figure 33. 3He/4He vs. 40Ar*/4He for inclusion fluids in different ore deposits. Estimates of the 40Ar*/4He ratios for the crust and mantle are plotted on the figure. The data in most deposits are compatible with mixing between a high 3He/4He fluid having a mantle-like 40Ar*/4He and a fluid enriched in 4He. It is assumed that this fluid is low temperature ASW capable of releasing 4He (but not 40Ar*) during circulation in the crust. Data sources: Mojiang, Zhenyuan and Daping (Ailaoshan Au deposits, China; Burnard et al.1999); Machangquing Cu deposit, China (Hu et al. 1998); Dae Hwa W-Mo deposit, South Korea (Stuart et al. 1995); Cu-porphyry deposits, USA (Kendrick et al. 2001b); Pennine MVT deposits (Stuart and Turner 1992; Kendrick et al. 2002a).
Tracing Fluid Origin, Transport and Interaction in the Crust
605
Age of mineralization. Radiogenic 40Ar arises from in situ decay of K within inclusions and can, in principle, be used to calculate a K-Ar age. In practice, the most accurate ages have come from radiogenic 40Ar located in small authigenic micas or Kfeldspar trapped in the fluid inclusions (Kelley et al. 1986; Turner and Bannon 1992; Irwin and Roedder 1995; Qui 1996; Kendrick et al. 2001a). Dating of quartz veins that host the mineralization is advantageous as it is likely to give a more accurate mineralization age than isotopic dating of host rock alteration minerals. A successful approach to dating quartz vein samples has been used by Kendrick et al. (2001) whereby in vacuo crushing initially releases excess 40Ar, followed by stepped heating to preferentially release radiogenic 40Ar and K-derived 39Ar from solid inclusions. When plotted on a 40Ar/36Ar-Cl/36Ar-K/36Ar diagram the data define a mixing plane (Fig. 34). Intersection of the mixing plane with the 40Ar/36Ar-K/36Ar axes gives the 40Ar/K ratio and hence K-Ar age of the mineralization. Further developments 3-D characterization of He and Ar in ore-deposit systems. Ore fluids are multicomponent mixtures that can be analyzed using 3D linear mixing diagrams in which, linear mixing forms planes and trends that are constrained by data. A useful advantage of this approach is in describing the changing composition of a fluid composition during mineralization reflecting the progressive change in dominance from one fluid type to the next (e.g., from mantle to crust or ASW). Thrower (1999) has provided a method to represent and analyze the contributions and trends involving ASW, crustal and mantle components on a 36Ar/40Ar-3He/4He-3He/40Ar mixing diagram (Fig. 35). 40Ar is used as the denominator in this diagram as it is the only isotope present in all three components. On such a three-dimensional mixing plot, each end-member is clearly distinguished (Fig. 35a). Mantle and crustal components are effectively positioned on the basal x-y plane defined by their respective 3He/4He and 3He/40Ar values. The vertical position is effectively controlled by 36Ar content and hence indicates ASW contribution
Figure 34. 40Ar/36Ar-Cl/36Ar-K/36Ar mixing diagram for combined in vacuo crushing and stepped heating analyses of vein quartz from the Silverbell copper porphyry deposit, Arizona, USA. Data form a plane representing a mixture of atmosphere, fluid and solid components. The orientation of the plane depends on the balance of radiogenic and excess 40Ar, Cl and K. Data obtained by in vacuo crushing show relatively high excess 40Ar and Cl contents and are aligned along the Cl/36Ar axis, while data obtained by step heating has variable K/Cl, and higher K/36Ar and are positioned on the plane. Projection of the plane onto the 40Ar/36Ar–K/36Ar axes enables determination of the 40 Ar/K ratio and a K-Ar age of 56±2 Ma (after Kendrick et al. 2001).
606
Ballentine, Burgess & Marty
Elemental fractionation (e.g., boiling) alters both the 4He/40Ar and the 3He/40Ar values and, since the 40Ar/36Ar value remains unchanged, results in horizontal movement from the plane. In deposits containing contributions from all three end-members data will form a unique mixing plane for that mineralization type and also for each mineralization stage, if the fluid sources change between each stage. Figure 35 illustrates this point using data from samples representing early, main and late stage mineralization of the Black Cloud
Figure 35. (a) 36Ar/40Ar-3He/4He-3He/40Ar mixing diagram showing the position of mantle, ASW and crustal end-members and the mixing plane between them. Data for sulfide samples are shown in (b) for early (c) for main and late stage mineralization stages of the Black Cloud replacement Pb-Zn deposit, Colorado mineral belt. End-member compositions vary between stages forming separate mixing planes. Mixing trends are evident during early (X-Y) and main (W-Z) stages (modified from Thrower 1999).
Tracing Fluid Origin, Transport and Interaction in the Crust
607
Pb-Zn deposit, Colorado mineral belt (Thrower 1999). Early stage samples formed from a magmatic fluid with 3He/4He of 4.1 Ra and ASW (36Ar/40Ar = 0.0034). Continued addition of a crustal component during deposition further lowered the 3He/4He to 1.6 (main stage minerals) and 0.05 for the late stage barite. A more detailed explanation of the data is beyond this review but it is worth pointing out that early, main and late stage minerals lie on different mixing planes that have a progressively more horizontal aspect reflecting the increasing importance of the ASW component as mineralization proceeded. Halogens (Br/Cl and I/Cl). In this review we have concentrated on some of the most important geological information that can be elucidated from combined noble gashalogen studies. For separate reviews of halogens as fluid tracers see Worden (1996) and for their specific application to studies of mineral deposits see Bohlke and Irwin (1992b) and Wilkinson (2001). Our aim here is to show the complimentary nature of noble gas and halogen data using as an example, halogen data for replacement Pb-Zn deposits of the Colorado mineral belt (Fig. 36; Thrower 1999). On a plot of Br/Cl versus I/Cl (Fig. 36) data lie on a mixing trend between mantle and crustal fluid sources and provide evidence for a genetic relationship between these deposits. Furthermore, data for different stages of mineralization of the Black Cloud deposit clearly show the relative change in influence of these two fluid sources throughout ore deposition. It is noted that the latter observation is in excellent agreement with the He and Ar systematics of Black Cloud sulfide samples (see discussion above and Fig. 35). Other examples of the combined use of noble gases and halogens as fluid tracers in ore deposits include studies of Mississippi Valley Type deposits (Turner and Bannon 1992; Bohlke and Irwin 1995; Kendrick et al. 2002a,b), copper porphyry deposits (Kendrick et al. 2001b), graniterelated systems (Bohlke and Irwin 1992b, Burgess et al. 1992; Turner and Bannon 1992; Polya et al. 2000; Gleeson et al. 2001), geothermal (Bolke and Irwin 1992b), and Au deposits (Bohlke and Irwin 1992b).
Figure 36. Br/Cl vs. I/Cl quartz and barite vein data for replacement Pb-Zn deposits of the Colorado mineral belt (Thrower 1999). The data are compatible with mixing between a mantle component similar in composition to fluids in diamond, and a crustal component with higher Br/Cl and I/Cl values. Note that Black Cloud deposit quartz and barite are co-genetic with sulfide samples shown in Figure 5. Shaded area labeled “mantle” defined by the range determined for fluids in diamonds (Burgess et al. 2002).
608
Ballentine, Burgess & Marty ACKNOWLEDGMENTS
CJB thanks Keith O’Nions, Alex Halliday, Max Coleman, Barbara Sherwood Lollar and Martin Schoell for their inspiration, support and collaboration in this field. RB thanks Clint Thrower, Mark Kendrick, Pete Burnard, Grenville Turner and Richard Pattrick for assistance and discussions. BM thanks Daniele Pinti, Max Coleman, Jean-Michel Matray, Christian Fouillac, Richard Worden and Frédérique Walgenwitz for support and collaboration over five years and more. We thank Zhou Zheng for many useful comments, Don Porcelli for his detailed review and editorial handling, and Richard Hartley for drafting many of the figures. REFERENCES Andrews JN (1983) Dissolved radioelements and inert gases in geothermal investigations. Geothermics 12:67-82 Andrews JN, Lee DJ (1979) Inert gases in groundwater from the Butter sandstone of England as indicators of age and trends. J Hydrol 41:233-252 Andrews JN, Goldbrunner JE, Darling WG, Hooker PJ, Wilson GB, Yougman MJ, Eichinger L, Rauert W, Stichler W (1985) A radiochemical, hydrochemical and dissolved gas study of groundwaters in the Molasse basin of Upper Austria. Earth Planet Sci Lett 73:317-332 Aplin AC, Warren EA, Grant SM, Robinson AG (1993) Mechanisms of quartz cementation in North Sea sandstone: Constraints from fluid compositions. In Diagenesis and Basin Development. Horbury A, Robinson AG (eds) AAPG Studies in Geology 36:7-22 ASTM (1985) Standard methods for estimating solubility of gases in petroleum liquids. In Annual Book of ASTM Standards, American Society of Testing and Materials, p 669-673 Atkins PW (1979) Physical Chemistry. Oxford University Press, Oxford, UK Ballentine CJ (1991) He, Ne and Ar isotopes as tracers in crustal fluids. PhD dissertation, University of Cambridge, Cambridge, UK Ballentine CJ (1997) Resolving the mantle He/Ne and crustal 21Ne/22Ne in well gases. Earth Planet Sci Lett 152:233-249 Ballentine CJ, Burnard PG (2002) Production and release of noble gases in the continental crust. Rev Mineral Geochem 47:481-538 Ballentine CJ, Hall CM (1999) Determining paleotemperature and other variables by using an errorweighted, non-linear inversion of noble gas concentrations in water. Geochim Cosmochim Acta 63:2315-2336 Ballentine CJ, O'Nions RK (1992) The nature of mantle neon contributions to Vienna Basin hydrocarbon reservoirs. Earth Planet Sci Lett 113:553-567 Ballentine CJ, O'Nions RK (1994) The use of He, Ne and Ar isotopes to study hydrocarbon related fluid provenance, migration and mass balance in sedimentary basins. In Geofluids: Origin, migration and evolution of fluids in sedimentary basins. Parnell J (ed) Geol Soc Spec Publ 78:347-361 Ballentine CJ, Sherwood Lollar B (2002) Regional groundwater focussing of nitrogen and noble gases into the Hugoton-Panhandle giant gas field, USA. Geochim. Cosmochim. Acta 66:2483-2497 Ballentine CJ, O'Nions RK, Oxburgh ER, Horvath F, Deak J (1991) Rare gas constraints on hydrocarbon accumulation, crustal degassing and groundwater flow in the Pannonian Basin. Earth Planet Sci Lett 105:229-246 Ballentine CJ, Mazurek M, Gautschi A (1994) Thermal constraints on crustal rare gas release and migration—evidence from alpine fluid inclusions. Geochim Cosmochim Acta 58:4333-4348 Ballentine CJ, O’Nions RK, Coleman ML (1996) A Magnus opus: Helium, neon, and argon isotopes in a North Sea oilfield. Geochim Cosmochim Acta 60:831-849 Ballentine CJ, Aeschbach-Hertig W, Peeters F, Beyerle U, Holocher J, and Kipfer R. (1999) Inverting noble gas concentrations in natural gas: Determination of gas/groundwater interaction and a test for conceptual models of gas transport and emplacement. EOS, Trans Am Geophys Union 80:f1168 Ballentine CJ, Schoell M, Coleman D, Cain BA (2001) 300 million year old magmatic CO2 in West Texas Permian Basin natural gas reservoirs. Nature 409:327-331 Bard E, Hamelin B, Fairbanks RG, Zindler A (1990) Calibration of the 14C timescale over the past 30,000 years using mass spectrometric U-Th ages from Barbados corals. Nature 345:405-409 Battani A, Sarda P, Prinzhofer A (2000) Basin scale natural gas source, migration and trapping traced by noble gases and major elements; the Pakistan Indus Basin. Earth Planet Sci Lett 181:229-249 Bethke CM, Harrison WJ, Upson C, Altaner ST (1988) Supercomputer analysis of sedimentary basins. Science 239:261-267
Tracing Fluid Origin, Transport and Interaction in the Crust
609
Ben-Naim A (1980) Hydrophobic Interactions. Plenum Press, New York Ben-Naim A, Egel-Thal M (1965) Thermodynamics of aqueous solutions of noble gases I-III. J Sol Chem 69:3240-3253 Benson B, Krause DJ (1976) Empirical laws for dilute aqueous solutions of non-polar gases. J Chem Phys 64:689-709 Bogard DD, Rowe MW, Manuel OK, Kuroda PK (1965) Noble gas anomalies in the mineral thucholite. J Geophys Res 70:703-708 Bohlke JK, Irwin JJ (1992a) Laser microprobe analyses of noble gas isotopes and halogens in fluid inclusions: Analyses of microstandards and synthetic inclusions in quartz. Geochim Cosmochim Acta 56:187-201 Bohlke JK, Irwin JJ (1992b) Laserprobe analyses of Cl, Br, I, and K in fluid inclusions: Implications for the sources of salinity in some ancient hydrothermal fluids. Geochim Cosmochim Acta 56:203-225 Bohlke JK, Irwin JJ (1992c) Brine history indicated by argon, krypton, chlorine, bromine, and iodine analyses of fluid inclusions from the Mississippi Valley type lead-fluorite-barite deposits at Hansonburg, New Mexico. Earth Planet Sci Lett 110:51-66 Bosch A, Mazor E (1988) Natural gas association with water and oil depicted by atmospheric noble gases: case studies from the southern Mediterranean Coastal Plain. Earth Planet Sci Lett 87:338-346 Bottinga Y, Javoy M (1991) MORB degassing: bubble growth and ascent. Chem Geol 81:255-270 Bourke PJ, Gilling D, Jeffries NL, Lever DA, Lineham TR (1989) Laboratory experiments of mass transfer in London clay. Proc Material Res Soc Symp 127:805-812 Braibant A, Fisicaro E, Dallevalle F, Lamb JD, Oscarson JL, Rao RS (1994) Molecular thermodynamic model for the solubility of noble gases in water. J Phys Chem 98:626-634 Burgess R, Taylor RP, Fallick AE, Kelley SP (1992) 40Ar-39Ar laser microprobe study of the fluids in different colour zones of a hydrothermal scheelite crystal from the Dae Hwa W-Mo mine, South Korea. Chem Geol 102:259-267 Burgess R, Layzelle E, Turner G, Harris JW (2002) Constraints on the age and halogen composition of Siberian coated diamonds. Earth Planet Sci Lett (in press) Burnard PG, Hu R, Turner G, Bi XW (1999) Mantle, crustal and atmospheric noble gases in Ailoshan Gold deposits, Yunnan Province, China. Geochim Cosmochim Acta 63:1595-1604 Castro MC, Jambon A, de Marsily G, Schlosser P (1998a) Noble gases as natural tracers of water circulation in the Paris Basin 1. Measurements and discussion of their origin and mechanisms of vertical transport in the basin. Water Resources Res 34:2443-2466 Castro MC, Goblet P, Ledoux E, Violette S, de Marsily G (1998b) Noble gases as natural tracers of water circulation in the Paris Basin 2. Calibration of a groundwater flow model using noble gas isotope data. Water Resources Res 34:2467-2483 Clever HL (1979a) Helium- and neon-gas solubilities. In Solubility Data Series, Vol 1. Intl Union of Pure and Applied Chemistry (IUPAC). Pergamon Press, Oxford Clever HL (1979b) Krypton, Xenon, and Radon - gas solubilities. In Solubility data series, Vol 2. Intl Union of Pure and Applied Chemistry (IUPAC). Pergamon Press, Oxford Clusius K, Dickel G (1938) Neues Verfehren zur Gasentmischung und Isotopentrennung. Naturwissenschaften 26:546 Craig H, Clarke WB, Beg MA (1975) Excess 3He in deep waters on the East Pacific Rise. Earth Planet Sci Lett 26:125-132 Craig H, Lupton JE, Horibe Y (1978) A mantle helium component in circum Pacific volcanic gases: Hakone, the Marianas, and Mt Lassen. In Terrestrial rare gases. Alexander EC, Ozima M (eds), Japan Sci Societies Press, Tokyo, p 3-16 Crovetto R, Fernandez-Prini R, Japas ML (1982) Solubilities of inert gases and methane in H2O and in D2O in the temperature range of 300 to 600 K. J Chem Phys 76:1077-1086 Davis SN, DeWeist RJM (1966) Hydrology. Wiley, New York Denbigh K (1986) The principles of chemical equilibrium. Cambridge University Press, Cambridge, UK Dewonck S, Marty B, France-Lanord C (2002) Geochemistry of the Lorraine groundwaters, France: Paleoclimatic record, mantle helium flux and hydrodynamic implications. Geochim Cosmochim Acta submitted Dunai TJ, Baur H (1995) Helium, neon and argon systematics of the European subcontinental mantle: Implications for its geochemical evolution. Geochim Cosmochim Acta 59:2767-2783 Dunai TJ, Porcelli D (2002) The storage and transport of noble gases in the subcontinental mantle. Rev Mineral Geochem 47:371-409 Dymond JH, Smith EB (1980) The virial coefficients of gases and mixtures. Clarendon Press, Oxford, UK Eley DD (1939) Aqueous solutions of noble gases. Trans Faraday Soc 35:1281
610
Ballentine, Burgess & Marty
Emery D, Smalley PC, Oxtoby NH (1993) Synchronous oil migration and cementation in sandstone reservoirs demonstrated by quantitative description of diagenesis. Phil Trans R Soc London A 344: 115-125 Espitalié J, Maxwell JR, Chenet Y, Marquis F (1988) Aspects of hydrocarbon migration in the Mesozoic of the Paris Basin as deduced from an organic geochemical survey. Organic Geochem 13:467-481 Fontes JC, Garnier JM (1979) Determination of the initial 14C activity of total dissolved carbon: a review of existing models and a new approach. Water Resources Res 15:399-413 Frick U, Chang S (1977) Ancient carbon and noble gas fractionation. Proc Lunar Sci Conf 8:263-272 Gleeson SA, Wilkinson JJ, Stuart FM, Banks DA (2001) The origin and evolution of base metal mineralizing brines, South Cornwall, U.K. Geochim Cosmochim Acta 65:2067-2079 Gluyas J, Coleman M. (1992) Material flux and porosity changes during sediment diagenesis. Nature 356:52-54 Goryunov MS, Kozlov AL (1940) Voprosy geokhimie gelinosnykh gazov i usloviya nakopleniya geliya v eyemnoy kore (A study of the geochemistry of helium-bearing gases and the conditions for the accumulation of helium in the Earth's crust.) State Sci-Tech Pub Co Oil and Solid Fuel Lit, LeningradMoscow Gold T, Held M (1987) Helium-Nitrogen-Methane systematics in natural gases of Texas and Kansas. J Petrol Geol 10:415-424 Graham DW (2002) Noble gas isotope geochemistry of mid-ocean ridge and ocean island basalts: Characterization of mantle source reservoirs. Rev Mineral Geochem 47:247-318 Gray CG and Gubbins KE (1984) Theory of molecular fluids. Clarendon Press, Oxford, UK Griesshaber E, O'Nions RK, Oxburgh ER (1992) Helium and carbon isotope systematics in crustal fluids from the Eifel, the Rhine Graben and Black Forest, F.R.G. Chem Geol 99:213-235 Heaton THE (1981) Dissolved gases: some applications to groundwater research. Trans Geol Soc Afr 84:91-97 Heaton THE (1984) Rates and sources of 4He accumulation in groundwater. Hydrol Sci J 29:29-47 Heaton THE, Vogel JC (1979) Gas concentrations and ages of groundwaters in the Beaufort group sediments, South Africa. Water S A 5:160-170 Hirschfelder JO, Curtiss CF, and Bird RB (1967) Molecular theory of gases and liquids. John Wiley & Sons Ltd, London, UK Hiyagon H, Kennedy BM (1992) Noble gases in CH4-rich gas fields, Alberta, Canada. Geochim Cosmochim Acta 56:1569-1589 Hu R, Burnard PG, Turner G, Bi X (1998) Helium and argon isotope systematics in fluid inclusions of Machangquing copper deposit in west Yunnan province, China. Chem Geol 146:55-63 Hutcheon I (1999) Controls on the distribution of non-hydrocarbon gases in the Alberta Basin. Bull Can Petrol Geol 47:573-593 Irwin JJ, Roedder E (1995) Diverse origins of fluid inclusions at Bingham (Utah, USA), Butte (Montana, USA), St. Austell (Cornwall, UK) and Ascension Island (mid-Atlantic, UK), indicated by laser microprobe analysis of Cl, K, Br, I, Ba + Te, U, Ar, Kr, and Xe. Geochim Cosmochim Acta 59: 295-312 Jähne B, Heinz G, Dietrich W (1987) Measurement of the diffusion coefficient of sparingly soluble gases in water. J Geophys Res 92:10,767-10,776 Javoy M, Pineau F (1991) The volatiles record of a popping rock from the Mid-Atlantic Ridge at 14degrees-N—Chemical and isotopic composition of gas trapped in the vesicles. Earth Planet Sci Lett 107:598-611 Jenden PD and Kaplan IR (1989) Origin of natural-gas in Sacramento Basin, California. AAPG Bull 73:431-453 Jenden PD, Kaplan IR, Poreda RJ, Craig H. (1988) Origin of nitrogen rich gases in the Californian Great Valley: Evidence from helium, carbon and nitrogen isotope ratios. Geochim Cosmochim Acta 52: 851-861 Jenden PD, Hilton DR, Kaplan IR, Craig H (1993) Abiogenic hydrocarbons and mantle helium in oil and gas fields. In Howel DG (ed) The future of energy gases. U S Geol Surv Prof Paper 1570, U S Geological Survey, p 31-56 Kelley S, Turner G, Butterfield AW, Shepherd TJ (1986) The source and significance of argon isotopes in fluid inclusions from areas of mineralization. Earth Planet Sci Lett 79:303-318 Kendrick MA, Burgess R, Pattrick RAD, Turner G (2001a) Halogen and Ar-Ar age determinations of inclusions within quartz veins from porphyry copper deposits using complementary noble gas extraction techniques. Chem Geol 177:351-370 Kendrick MA, Burgess R, Pattrick RAD, Turner G (2001b), Fluid inclusion noble gas (He, Ar, Kr, Xe) and halogen (Cl, Br, I) evidence on the origin of Cu-Porphyry mineralising fluids. Geochim Cosmochim Acta 65:2641-2658
Tracing Fluid Origin, Transport and Interaction in the Crust
611
Kendrick MA, Burgess R, Pattrick RAD, Turner G (2002a) The origin of a fluorite rich MVT brine: combined noble gas (He, Ar, Kr) and halogen (Cl, Br, I) analysis of fluid inclusions from the South Pennine Orefield, U.K. Econ Geol (in press) Kendrick MA, Burgess R, Leach D, Pattrick RAD (2002b) Hydrothermal fluid origins in Mississippi Valley-Type ore deposits: Noble gas and halogen evidence from the Illinois-Kentucky Fluorspar district, Viburnum Trend and Tri-State deposits, Mid-continent, U.S.A. Econ Geol (in press) Kennedy BM, Lynch MA, Reynolds JH, Smith SP (1985) Intensive sampling of noble gases in fluids at Yellowstone: I. Early overview of the data; regional patterns. Geochim Cosmochim Acta 49: 1251-1261 Kharaka YK and Specht DJ (1988) The solubility of noble gases in crude oil at 25-100°C. Appl Geochem 3:137-144 Kipfer R, Aeschbach-Hertig W, Peeters F, Stute M (2002) Noble gases in lakes and ground waters. Rev Mineral Geochem 47:615-700 Krooss BM, Leythaeuser D (1988) Experimental measurements of the diffusion parameters of light hydrocarbons in water-saturated sedimentary rocks, II. Results and geochemical significance. Organic Geochem 11:193-199 Krooss BM, Leythaeuser D, Schaefer RG (1992) The quantification of diffusive hydrocarbon losses through cap rocks of natural gas reservoirs—a re-evaluation. AAPG Bull 76:403-406 Lafargue E, Barker C (1988) Effect of water washing on crude oil composition. AAPG Bull 72:263-276 Langmuir CH, Vocke RD Jr, Hanson GN, Hart SR (1978) A general mixing equation with applications to Icelandic basalts. Earth Planet Sci Lett 37:380-392 Macaulay CI, Haszeldine RS, Fallick AE (1992) Diagenetic pore waters stratified for at least 35 Million years: Magnus oil field, North Sea. AAPG Bull 76:1625-1634 Mamyrin, BA, Tolstikhin IN (1984) Helium isotopes in nature. Elsevier, Amsterdam Marine IW (1979) The use of naturally occurring He to estimate groundwater velocities for studies of geological storage waste. Water Resources Res 15:1130-1136 Martel DJ, Deak J, Dövenyi P, Horvath F, O'Nions RK, Oxburgh ER, Stegena L, Stute M (1989) Leakage of helium from the Pannonian basin. Nature 342:908-912 Marty B (1984) On the noble gas isotopic fractionation in naturally occurring gases. Geochem J 18:157162 Marty B, Torgersen T, Meynier V, O'Nions RK, de Marsily G (1993) Helium isotope fluxes and groundwater ages in the Dogger Aquifer, Paris Basin. Water Resources Res 29:1025-1035 Mattey D (1991) Carbon-dioxide solubility and carbon isotope fractionation in basaltic melt. Geochim Cosmochim Acta 55:3467-3473 Morrison P, Pine J (1955) Radiogenic origin of helium isotopes in rocks. Ann N Y Acad Sci 62:71-92 Nagao K, Takaoka N, Matsubayashi O, (1979) Isotopic anomalies of rare gases in the Nigorikawa geothermal area, Hokkaido, Japan. Earth Planet Sci Lett 44:82-90 Nagao K, Takaoka N, Matsubayashi O (1981) Rare gas isotopic ratios in natural gases of Japan. Earth Planet Sci Lett 53:8175-188 Neretnieks I (1982) Diffusivities of some dissolved constituents in compacted wet bentonite clay-MX80 and the impact of radionuclide migration in the buffer. SKBF/KBS Teknisk Rapport, Stockholm, p 8287 Nordstrom DK, Munoz L (1985) Geochemical thermodynamics. Benjamin-Cumming Publ Co, London Nuccio P, Paonita A (2000) Investigation of the noble gas solubility in H2O-CO2 bearing silicate liquids at moderate pressure II: the extended ionic porosity (EIP) model. Earth Planet Sci Lett 183:499-512 Ohsumi T, Horibe Y (1984) Diffusivity of He and Ar in deep-sea sediments. Earth Planet Sci Lett 70: 61-68 Oliver BM, Bradley JG, Farrar IV H (1984) Helium concentration in the Earth's lower atmosphere. Geochim Cosmochim Acta 48:1759-1767 O'Nions RK, Ballentine CJ (1993) Rare gas studies of basin scale fluid movement. Phil Trans R Soc London 344:144-156 O'Nions RK, Oxburgh ER (1983) Heat and helium in the Earth. Nature 306:429-431 O'Nions RK, Oxburgh ER (1988) Helium, volatile fluxes and the development of the continental crust. Earth Planet Sci Lett 90:331-347 Oxburgh ER, O'Nions RK, Hill RI (1986) Helium isotopes in sedimentary basins. Nature 324:632-635 Ozima M, Podosek FA (1983) Noble gas geochemistry. Cambridge University Press, Cambridge, UK Pierce AP, Gott GB, Mytton JW (1964) Uranium and helium in the Panhandle gas field, Texas, and adjacent areas. U S Geol Surv Prof Pap 454-G:1-57 Pinti DL, Marty B (1995) Noble gases in crude oils from the Paris basin, France—Implications for the origin of fluids and constraints on oil-water interactions. Geochim Cosmochim Acta 59:3389-3404
612
Ballentine, Burgess & Marty
Pinti DL, Marty B (1998) The origin of helium in deep sedimentary aquifers and the problem of dating very old groundwaters. In Parnell J (ed) Dating and duration of fluid flow and fluid-rock interaction. Geol Soc Spec Publ 144:53-68 Pinti DL and Marty B (2000) Noble gases in oil and gas fields: Origin and processes. In Kyser K (ed) Fluids and Basin Evolution. Mineral Soc Can Short Course 28, Mineralogical Society of Canada, Toronto, p 160-196 Pinti DL, Marty B, Andrews JN (1997) Atmosphere-derived noble gas evidence for the preservation of ancient waters in sedimentary basins. Geology 25:111-114 Podosek FA, Honda M, Ozima M (1980) Sedimentary noble gases. Geochim Cosmochim Acta 44: 1875-1884 Podosek FA, Bernatowcz TJ, Kramer FE (1981) Adsorption of xenon and krypton on shales. Geochim Cosmochim Acta 45:2401-2415 Polya DA, Foxford KA, Stuart F, Boyce A, Fallick AE (2000) Evolution and paragenetic context of low δD hydrothermal fluids from the Panasqueira W-Sn deposit, Portugal: new evidence from microthermometric, stable isotope, noble gas and halogen analyses of primary fluid inclusions. Geochim Cosmochim Acta 64:3357-3371 Porcelli D, Ballentine CJ (2002) Models for the distribution of Terrestrial noble gases and the evolution of the atmosphere. Rev Mineral Geochem 47:411-480 Poreda R, Jenden PD, Kaplan IR, Craig H (1986) Mantle helium in Sacramento Basin natural gas wells. Geochim Cosmomochim Acta 50:9-33 Potter RWI, Clyne MA (1978) The solubility of the noble gases He, Ne, Ar, Kr and Xe in water up to the critical point. J Solution Chem 7:837-844 Poulet M, Espitalié J (1987) Hydrocarbon migration in the Paris Basin. In Doligez B (ed) Migrations of hydrocarbons in sedimentary basins. Editions Technip, Paris, p 131-171 Present RD (1958) Kinetic Theory of Gases. McGraw Hill, New York Price LC, Blount CW, MacGowan D, Wenger L (1981) Methane solubility in brines with application to the geopressured resource. In Proc 5th Conf Geopressured Geothermal Energy, Baton Rouge, Louisiana, p 205-214 Prinzhofer A, Pernaton E (1997) Isotopically light methane in natural gas: bacterial imprint or diffusive fractionation? Chem Geol 142:193-200 Qui H-N (1996) 40Ar-39Ar dating of the quartz samples from two mineral deposits in western Yunnan (SW China) by crushing in vacuum. Chem Geol 127:211-222 Rebour V, Billiotte J, Deveughele M, Jambon A, le Guen C (1997) Molecular diffusion in water saturated rocks: a new experimental method. J Cont Hydrol 28:71-93 Sano Y, Wakita H, Huang CW (1986) Helium flux in a continental land area from 3He/4He ratio in northern Taiwan. Nature 323:55-57 Savchenko VP (1935) The problems of geochemistry of helium. Natural Gases 9:53-197 (in Russian) Sherwood Lollar B, O'Nions RK, Ballentine CJ (1994) Helium and neon isotope systematics in carbon dioxide-rich and hydrocarbon-rich gas reservoirs. Geochim Cosmochim Acta 58:5279-5290 Sherwood Lollar B, Ballentine CJ, O'Nions RK (1997) The fate of mantle-derived carbon in a continental sedimentary basin: Integration of C/He relationships and stable isotope signatures. Geochim Cosmochim Acta 61:2295-2307 Schlomer S, Kroos BM (1997) Experimental characterisation of the hydrocarbon sealing efficiency of cap rocks. Marine Petrol Geol 14:563-578 Schoell M (1983) Genetic characterisation of natural gases. AAPG Bull 67:2225-2238. Simmons SF, Sawkins FJ, Sclutter DJ (1987) Mantle-derived helium in two Peruvian hydrothermal ore deposits. Nature 329:429-432 Smith SP (1985) Noble gas solubility in water at high temperature. EOS, Trans Am Geophys Union 66:397 Smith SP Kennedy BM (1983) The solubility of noble gases in water and in NaCl brine. Geochim Cosmochim Acta 47:503-515 Solomon DK, Hunt A, Poreda RJ (1996) Source of radiogenic helium-4 in shallow aquifers: Implications for dating young groundwater. Water Resources Res 32:1805-1813 Stillinger FH (1980) Water revisited. Science 209:451-457 Stilwell DP (1989) CO2 resources of the Moxa Arch and the Madison Reservoir. In Eisert JL (ed) Gas Resources of Wyoming. Wyoming Geol Assoc 40th Field Conf, Casper, p 105-115 Stuart FM, Turner G (1992) The abundance and isotopic composition of the noble gases in ancient fluids. Chem Geol 101:97-109 Stuart FM, Turner G, Duckworth RC, Fallick AE (1994) Helium isotopes as tracers of trapped hydrothermal fluids in ocean-floor sulphides. Geology 22:823-826
Tracing Fluid Origin, Transport and Interaction in the Crust
613
Stuart FM, Burnard PG, Taylor RP, Turner G (1995) Resolving mantle and crustal contributions to ancient hydrothermal fluids: He-Ar isotopes in fluid inclusions from Dae Hwa W-Mo mineralization, South Korea. Geochim Cosmochim Acta 59:4663-4673 Stute M, Deak J (1989) Environmental isotope study (12C, 13C, 18O, D, noble gases) on deep groundwater circulation systems in Hungary with reference to paleoclimate. Radiocarbon 31:902-918 Stute M, Sonntag C, Deak J, Schlosser P (1992) Helium in deep circulating groundwater in the Great Hungarian plain: Flow dynamics and crustal and mantle helium fluxes. Geochim Cosmochim Acta 56:2051-2067 Thrower CD (1999) The evolution of mineralizing fluids in the Colorado mineral belt, defined by combined noble gas and halogen analyses. PhD dissertation, University of Manchester, Manchester, UK Tolstikhin IN, Lehmann BE, Loosli HH, Gautschi A (1996) Helium and argon isotopes in rocks, minerals, and related groundwaters: A case study in northern Switzerland. Geochim Cosmochim Acta 60: 1497-1514 Torgersen T (1980) Controls on pore fluid concentration of 4He and 222Rn and the calculation of 4He/222Rn ages. J Geochem Explor 13:57-75 Torgersen T, Clarke WB (1985) Helium accumulation in groundwater. I: an evaluation of sources and the continental flux of crustal 4He in the Great Artesian Basin, Australia. Geochim Cosmochim Acta 49:1211-1218 Torgersen T, Clarke WB (1987) Helium accumulation in groundwater. III: Limits on helium transfer across the mantle-crust boundary beneath Australia and the magnitude of mantle degassing. Earth Planet Sci Lett 84:345-355 Torgersen T, Ivey GN (1985) Helium accumulation in groundwater. II: a model for the accumulation of crustal 4He degassing flux. Geochim Cosmochim Acta 49:2445-2452 Torgersen T, Kennedy BM (1999) Air-Xe enrichments in Elk Hills oil field gases: role of water in migration and storage. Earth Planet Sci Lett 167:239-253 Torgersen T, Kennedy BM, Hiyagon H, Chiou KY, Reynolds JH, Clarke WB (1989) Argon accumulation and the crustal degassing flux of 40Ar in the Great Artesian Basin, Australia. Earth Planet Sci Lett 92:43-56 Toth J (1980) Cross formational gravity-flow of groundwater: a mechanism of transport and accumulation of petroleum. AAPG Studies in Geology 10:121-167 Toth J, Corbett T (1986) Post-Paleocene evolution of regional groundwater flow-system and their relation to petroleum accumulations, Taber area, Southern Alberta, Canada. Bull Can Petrol Geol 34:339-363 Turner G (1988) Hydrothermal fluids and argon isotopes in quartz veins and cherts. Geochim Cosmochim Acta 52:1443-1448 Turner G, Bannon MP (1992) Argon isotope geochemistry of inclusion fluids from granite-associated mineral veins in southwest and northeast England. Geochim Cosmochim Acta 56:227-243 Weinlich FH, Braeuer K, Kampf H, Strauch G, Tesar J, Weise SM (1999) An active subcontinental mantle volatile system in the western Eger rift, Central Europe: Gas flux, isotopic (He, C, and N) and compositional fingerprints. Geochim Cosmochim Acta 63:3653-3671 Weiss RF (1970) The solubility of nitrogen, oxygen and argon in water and seawater. Deep-Sea Res 17:721-735 Weiss RF (1971) Solubility of helium and neon in water and seawater. J Chem Eng Data 16:179-188 Weiss RF, Price BA (1989) Dead Sea gas solubilities. Earth Planet Sci Lett 92:7-10 Wilhelm E, Battino R, Wilcock RJ (1977) Low pressure solubility of gases in liquid water. Chem Rev 77:219-262 Wilkinson JJ (2001) Fluid inclusions in hydrothermal ore deposits. Lithos 55:229-272 Winckler G, Suess E, Wallman K, deLange GJ, Westbrook GK, Bayer R (1997) Excess helium and argon of radiogenic origin in Mediterranean brine basins. Earth Planet Sci Lett 15:225-231 Worden RH (1996) Controls on halogen concentrations in sedimentary formation waters. Mineral Mag 60:259-274 Worden RH, Matray JM (1995) Cross formational flow in the Paris basin. Basin Res 7:53-66 Zaikowski A, Spangler RR (1990) Noble gas and methane partitioning from groundwater. An aid to natural gas exploration and reservoir evaluation. Geology 18:72-74 Zaikowski A, Kosanke BJ, and Hubbard N (1987) Noble gas composition of deep brines from the Palo Duro Basin, Texas. Geochim Cosmochim Acta 51:73-84 Zanker A (1977) Inorganic gases in petroleum. Hydrocarbon Process 56:255-256 Zartman RE, Wasserburg GJ, Reynolds JH (1961) Helium, argon and carbon in some natural gases. J Geophys Res 66:277-306
614
Ballentine, Burgess & Marty
Zhang TW, Krooss BM (2001) Experimental investigation on the carbon isotope fractionation of methane during gas migration by diffusion through sedimentary rocks at elevated temperature and pressure. Geochim Cosmochim Acta 65:2723-2742 Zuber A, Weise SM, Osenbrück K, and Matenko T (1997) Origin and age of saline waters in Busko Spa (Southern Poland) determined by isotope, noble gas and hydrochemical methods: evidence of interglacial and pre-Quaternary warm climate recharges. Appl Geochem 12:643-660