FBMIS Volume 1, 2005, 19-35
ISSN 1740-5955
http://www.fbmis.info/A/5_1_StaudhammerCL_1
Copyright @ 2005 The FBMIS Group
MIXED-MODEL DEVELOPMENT FOR REAL-TIME STATISTICAL PROCESS CONTROL DATA IN WOOD PRODUCTS MANUFACTURING CHRISTINA L. STAUDHAMMER1, VALERIE M. LEMAY2, ROBERT A. KOZAK3, and THOMAS C. MANESS2 1
School of Forest Resources and Conservation, Institute of Food and Agricultural Sciences, University of Florida, P.O. Box 110410, Gainesville, FL USA. [
[email protected]] 2 Department of Forest Resources Management, Faculty of Forestry, University of British Columbia, 2045-2424 Main Mall, Vancouver, BC Canada [Valerie.LeMay, Thomas.Maness@ ubc.ca] 3 Department of Wood Science, Faculty of Forestry, University of British Columbia, 2900-2424 Main Mall, Vancouver, BC Canada [Robert.Kozak@ ubc.ca]
(Submitted, 10thNov. 2004; Accepted, 11thApril 2005; Published 12 July 2005) ABSTRACT. Recent advances in laser technology have brought about great change in the area of statistical process control (SPC) for automated lumber manufacturing. SPC was traditionally based on a simple sampling scheme with measurements described by a oneway analysis of variance model. The introduction of multiple laser sensors capable of measuring multiple sides of each and every board processed has necessitated the derivation of a model to take into account multiple sources of variation with strongly autocorrelated errors. Autoregressive integrated moving average (ARIMA) models and seasonal fractional ARIMA (SARFIMA) models were useful in describing the short- and long-range dependence in the data. Although an autocorrelated errors model better describes the process, for use in many SPC applications, a simple uncorrelated errors model may suffice. Keywords: Mixed-effects models, autocorrelation, forest products, statistical process control. 1
INTRODUCTION
Statistical process control (SPC) in wood products manufacturing has traditionally been labourintensive, relying on relatively simple equipment and statistical methods. In a typical lumber mill, SPC personnel periodically sample a small number of pieces of lumber from each sawing machine, measure the thickness of each piece in 6-10 places along its length with digital calipers, and enter these data into an SPC software package. These packages produce a variety of charts, which display process control limits and give mill personnel feedback on the performance of sawing machines (for basic SPC concepts, see, e.g., Montgomery 2001). SPC is widely accepted in automated lumber manufacturing as an analytical tool for problem solving, providing a signal to operators when sawing machines need adjustment. When properly applied, SPC can prevent continued production of sub-standard material. Recent advances in technology have made extremely accurate non-contact laser range sensors (LRS) affordable to lumber mills. These measurement devices can take up to 1000 measurements per second and can be set up in-line with sawing machines to measure each piece of lumber as it is processed. Under normal mill conditions, about 3000 measurements could be taken on a typical 2.5 metre (8-foot) board, resulting in a more than 1000-fold increase in the amount of SPC data available. Moreover, these devices can be set up to obtain information specific to each side of each board. Whereas ordinary digital calipers give thickness measurements only, LRS data could be used to describe each surface of a board. This is especially important in modern sawmills, where two different cutting devices (saws or chippers) usually make the two “face” surfaces of a single piece of lumber. This advance would seem like a windfall to SPC personnel in that it greatly increases the amount of information available to make decisions about the quality of lumber being produced. However, data from LRSs contain measurement errors (Wehr and Lohr 1999, Burman 2002) and may include measurements taken in areas of non-sawing defects (e.g., wane1 and holes). Furthermore, the distributional properties of this data have not yet been studied. The statistical model that underlies traditional SPC techniques for wood products data was developed for periodic sampling described by a 1
Wane is the natural curvature of the edge of a board sawn from a log.
19
FBMIS Volume 1, 2005, 19-35
ISSN 1740-5955
http://www.fbmis.info/A/5_1_StaudhammerCL_1
Copyright @ 2005 The FBMIS Group
one-way analysis of variance model (Warren 1973), whereas data from LRS-based real-time systems are virtually continuous with several sources of variation. Using methods from image processing, filtering techniques were developed to remove measurement errors and non-sawing defects (Staudhammer 2004). In order to develop a system for SPC using real-time LRS data, an appropriate statistical model must be derived. Continuous process data are often highly autocorrelated (Wheeler 1995, Young and Winistorfer 2001, Noffsinger and Anderson 2002), meaning that most observations are easily predicted from their neighbours. While autocorrelation in data does not bias estimates of process parameters (e.g., mean lumber thickness), estimates are inefficient as each observation does not represent a new piece of independent information (Schabenberger and Pierce 2001). This causes underestimation of the variation in the process parameters and overestimation of their degrees of freedom which, in turn, results in the construction of incorrect control limits (Wheeler 1995). Perhaps more importantly, the components of variance in the statistical model need to be correctly identified, as the sources of variation are keys to understanding the sawing process (Maness, et al. 2002). A statistical model of LRS measurement data will be an integral part of an SPC system for sawmills using this real-time technology. The ultimate goal of any SPC system is process improvement (Shewhart 1931). The goal of the particular SPC system used in this study is to evaluate board surface profiles, providing real-time feedback on sawing performance and monitoring for specific kinds of sawing defects, such as wedge2. Better knowledge of the process and faster response to problems when they occur will ultimately enable mills to save money by reducing the amount of over-sizing that they allocate to account for size variation. The objective of this paper is to describe a statistical model for online LRS profile data taken on sawn lumber, which will enable an SPC system to be developed. The model and its estimated components of variance (COV) were identified, partitioned, and calculated, providing the basis for a real-time lumber manufacturing SPC protocol. 2 MATERIALS 2.1. Lab Scans. A laser measurement apparatus consisting of a moving carriage, encoder, and four point laser range sensors was set up to simulate real-time measurements collected in an industrial sawmill setting (Figure 1). The carriage moved the lumber past the range sensors, which were mounted with two on each side of the carriage. Side 1-Laser 1 and Side 2-Laser 1 were vertically positioned to take measurements 2.54 cm (one inch) above the bottom of the board; Side 1-Laser 2 and Side 2-Laser 2 were vertically positioned to take measurements 2.54 cm (one inch) below the top of the board. The LRSs recorded the distance from each of the four lasers to the wood surface and the encoder recorded the distance along the length of the carriage. Side 1 Laser 1
Laser 2
Motor
Carriage
Lumber
Laser 1
Laser 2
Side 2
Figure 1. Set up of measurement apparatus, as viewed from above. The sample lumber consisted of 110 2.5-metre (8-foot) pieces of rough green western hemlock (Tsuga heterophyla (Raf) Sarg.) with target dimensions 80 mm × 135 mm (2.06” × 5.31”), respectively. The lumber was donated from Weyerhaeuser’s New Westminster sawmill (British Columbia, Canada). Samples were arbitrarily selected at the sawmill’s sorting area after being processed with a bandsaw, chipper-head, and/or circular saw3. There were four possible saw 2
Wedge is a sawing defect characterized by gradual thinning (or thickening) across the width of a board or through its thickness. A bandsaw is a so-called “endless” toothed metal band driven by two wheels, a chipper-head is a metal cutting drum with knives mounted on rotating heads, and a circular saw consists of a toothed round blade mounted on a shaft.
3
20
FBMIS Volume 1, 2005, 19-35
ISSN 1740-5955
http://www.fbmis.info/A/5_1_StaudhammerCL_1
Copyright @ 2005 The FBMIS Group
configurations that could have produced the lumber. For example, Figure 2 shows a log with a fourboard sawing solution. Boards cut from the outermost part of the log (outside sideboards) had one side cut by a chipper-head (CL or CR) and one side cut by a bandsaw (B1 or B2). Right outside sideboards (ROS) were labelled as saw configuration “BC”, and left outside sideboards (LOS) were labelled as saw configuration “CB”. Inside sideboards had both sides cut by a bandsaw. Since the lumber was collected at the sorting area, left inside sideboards (LIS) and right inside sideboards (RIS) were indistinguishable, and labelled as saw configuration “BB”. Boards cut from the cant4 itself had both sides cut in a gang-saw system consisting of nineteen circular saws (not shown), and were labelled with saw configuration “RR”5. Of the 110 sample boards, 41 were bandsawn on both sides (BB), 24 were chipped on one side (BC or CB), and 21 were circular-sawn on both sides (RR). B4 B2 CR
LOS LIS
RIS ROS
CL B1 B3
Cant
Figure 2. Sawing solution with four sideboards (CL=left chipper-head, CR=right chipper-head, B1=bandsaw #1, B2=bandsaw #2, B3=bandsaw #3, B4=bandsaw #4, LOS=left outside sideboard, LIS=left inside sideboard, RIS=right inside sideboard, ROS=right outside sideboard). 2.2 Field Scans. Since the lumber for lab scanning was collected at the sorter, the order in which the boards were sawn was unknown. Because sawing order is needed to quantify the autocorrelation between sawn boards, an ordered field sample was obtained. These samples were collected for a separate related real-time laser scanning project, the objective of which was to verify an algorithm that identified and removed vibrations caused by the mill machinery from the online LRS profile data (Schajer and Gazzarri 2004). Sample data were collected at Weyerhaeuser’s New Westminster (British Columbia, Canada) sawmill using an in-line measurement system. Cants were scanned at the outfeed of the quad bandsaw, using a process similar to that of the lab scans. The sample data consisted of Douglas-fir (Pseudotsuga menziesii (Mirb.) Franco) cants cut by the quad bandsaw with three possible saw configurations: BB, BC, or CB. Because the vibration removal algorithm had complex input requirements, only two streams of LRS data (one per side) were available from the measurement system. 3 METHODS 3.1 Lab Scan Data. The data captured by the point laser range sensors were distances from the laser to the board surface. At the mth measurement point along the board, the four LRS observations were: l11m, l12m, l21m, l22m (Figure 3). Observations from the lasers were translated into four board profile quantities, y11m, y12m, y21m, and y22m. Profiles were calculated by first finding each board’s “centre of sawing”, using the known distance between the Side 1 lasers and the Side 2 lasers (d) as the independent variable. A separate regression was fit for the top laser quantities versus those of the bottom. For instance, l11m and d-l21m were the dependent variables in a regression versus m, yielding a line through the centre of the board at the bottom laser height. Similarly, using l12m and d-l22m as the dependent variables versus m yielded a line through the centre of the board at the top laser height. By drawing the plane that connects these two regression lines, the board was split vertically. This arbitrary “centreline" was used as a reference from which to calculate the profiles, ensuring that for each board, y11 = y 21 and y12 = y22 . The lumber was scanned at time intervals and speeds consistent with typical lumber mill conditions. With the carriage speed set at 40 cm per second and the lasers set to collect 500 measurements per 4 5
A cant is a partially processed log, which has been squared on one or more sides. The abbreviations BB, BC, CB, and RR are used throughout this paper to denote saw configuration.
21
FBMIS Volume 1, 2005, 19-35
ISSN 1740-5955
http://www.fbmis.info/A/5_1_StaudhammerCL_1
Copyright @ 2005 The FBMIS Group
second, the datasets consisted of ~1200 measurements per metre (375 per foot) from each laser, or ~3000 measurements per board, side, and laser position. Prior to processing, the LRS data were first filtered for measurement errors using techniques from image processing. Non-sawing defects were then removed from the data using a sheet-of-light profiling system and defect recognition algorithm. d Side 1 Laser 2
Laser 1
Side 2 l12m
y12m
y22m
l11m
y11m
y21 m
l22m
l21m
Laser 2
Laser 1
Board
Figure 3. LRS measurements and derived surface profiles (ljlm=mth measurement from Side j-Laser l, d=distance from Side 1 lasers to Side 2 lasers). 3.2 Field Scan Data. Cants were continuously scanned over a period of several hours. For each cant, the cutting pattern was noted and gross defects such as wane were recorded. After application of Schajer and Gazzari’s (2004) vibration removal algorithm, cant profile data were obtained in the same manner as for the lab scans. Because the field scan data were used only to quantify the autocorrelation between subsequent boards, the data consisted simply of scan numbers, saw configurations, and average profiles. In total, 208 samples were obtained. Because only relatively large-sized logs were cut during the time of sampling, nearly 95% of cants were bandsawn on both sides (BB). Thus, the analysis was done for this saw configuration only. Wane sections were removed from the scans and the analysis for board to board correlation was performed with 194 cants in the sample pool. 3.3 Model. Each saw configuration represents a different sawing process, and each side of each board is sawn by two different saws. Separate models were developed for each saw configuration and side. Adding subscripts to allow for multiple boards and different saw configuration, yijklm denotes the profile observation from the ith saw configuration (i = 1 to 4: BB, BC, CB, and RR), jth side (j = 1 to 2), kth sample board (k = 1 to bi; b1 = 41, b2 = b3 = 24, and b4 = 21), lth laser location (l = 1 to 2), and mth distance along the board (m = 1 to nijkl). Using a mixed-effects model, these observations were described as: yijklm = µij + βijk + λijl + βλijkl + εijklm
(1)
where: µij = the mean profile of the ith saw configuration and jth side; βijk = the kth board effect from the ith saw configuration and jth side; λijl = the lth laser location effect from the ith saw configuration and jth side; βλijkl = the interaction of the kth sample board and lth laser location from the ith saw configuration and jth side; and εijklm = the error associated with the mth measurement from the lth laser location, kth sample board, in the ith saw configuration and jth side. Each of the eight saw configuration (i) × side (j) combinations were modelled separately to allow for different error distributions. Under the “usual” mixed-model analysis approach, effects in each (ij) model are assumed independent, identically and normally distributed:
βijk ~ N(0, σβij2); βλijkl ~ N(0, σβλij2); Cov(εijklm,εijk΄l΄m) = 0 for k ≠ k΄ and l ≠ l΄.
λijl ~ N(0, σλij2); εijklm ~ N(0, σεij2); and
When these assumptions are met, the variance estimators are unbiased and thus, tests of statistical significance can be performed and confidence limits can be calculated. However, given that the measurements are very closely spaced, with ~3000 measurements taken from each laser per side per board, a high degree of spatial- and auto-correlation among measurements taken from each LRS on a particular board is likely.
22
FBMIS Volume 1, 2005, 19-35
ISSN 1740-5955
http://www.fbmis.info/A/5_1_StaudhammerCL_1
Copyright @ 2005 The FBMIS Group
The autocorrelation in time-ordered data is measured by the autocorrelation function (ACF). The sample ACF of the profile data from a single board, side, and laser position at lag t measures the similarity between measurements t lags apart:
ρˆ ijkl t =
∑
nijkl m =1
( yijkl ,m − yijkl ⋅ )( yijkl ,m +t − yijkl ⋅ )
∑
nijkl m =1
( yijkl ,m − yijkl ⋅ ) 2
(2)
where: t=1, 2, 3, …; and yijkl ⋅ is the mean profile for the ith saw configuration, jth side, kth board, and lth laser position. In the presence of non-zero autocorrelation, the assumption of independent errors (εijklm) is not valid (Schabenberger and Pierce 2001). Measurements from the two lasers on the same board may also be correlated, affecting the distributional assumptions about λijl. Furthermore, if boards were scanned in the order they were sawn, there could be strong correlations from subsequent boards from a particular saw, affecting the distributions of βijk and βλijkl. Without accounting for these sources of correlation, the variation in this process could be under-estimated (Schabenberger and Pierce 2001). Model (1) was fit first ignoring sources of autocorrelation in the data. It was then re-fitted, explicitly modelling the autocorrelation using a series of stages. The two models were compared. 3.3.1 Model ignoring autocorrelation. Using the lab scan profile data, the parameters of Model (1) for each saw configuration and side (eight combinations) were estimated using the SAS procedure PROC MIXED (Version 8.2, SAS Institute 2002). This procedure allowed for fixed and random effects, and computed estimates of the variance components for all random effects in the model. For each saw configuration and side (ij), a variance estimate was found for: board (σ2βij), laser position (σ2λij), the interaction (σ2βλij), and the residual (σ2εij). 3.3.2 Autocorrelated model. For the autocorrelated model, model parameters were estimated in stages. In the first stage, the lab scan data for each board and side (ijk) were modelled with an appropriate autocorrelative structure. In Stage 2, field scanned sample boards were used to investigate possible correlation among subsequent boards (ijk to ij,k+1). In the final stage, Model (1) was fit to the lab scan profile data using the autocorrelative structure for the errors (εijklm) selected in Stage 1. • Stage 1: Within sample board model. Data taken from one side of a single board (ijk) are samples from a random field; since different saws are responsible for cutting each side of a board, LRS data from the opposite side of the board are samples from separate and distinct random fields. These fields could be considered in either a spatial or temporal context. Since a single piece of lumber comes from one tree, subject to one set of genetic and environmental conditions, the surface data from a single piece of lumber could be considered spatially correlated. On the other hand, the surface of the lumber was measured in order to monitor and diagnose saw performance. Saws rotate and vibrate at rates and angles that depend on an array of factors which, in turn, depend to some degree on the qualitative properties of the wood (e.g., density and moisture content). However, saw performance depends to a great extent on operator controlled factors, such as the feedspeed of the log, saw tension, and sharpness of the saw blade (Schajer 1990). Although feedspeed can change during the cut, these factors are generally more related to time than to space. This is interesting, as the cause of variability in the sawn surface is related to time, while the effect is shown in space. Autocorrelation within a single board and side therefore was estimated with time series models. In addition to traditional parametric time series models, several non-parametric techniques are available to describe the errors. For instance, general additive models (GAM) using non-parametric smoothing splines have been used to model forest landscape patterns and processes (e.g., Austin and Meyers 1996), and multivariate adaptive regression splines (MARS) have been used to model many types of climatic data (e.g., Chen, et al. 1997). While both of these methods produce efficient estimates and capture local structure of data, more traditional time series models provide a more parsimonious model with globally explanatory parameters. The autocorrelation structure of the errors was estimated using univariate time series models by saw configuration, side, board, and laser position (ijkl). A bivariate time series model for simultaneously fitting the profile data from the top and bottom laser positions by board and side (ijk) is more efficient when a non-zero correlation exists between the two laser positions. In these cases, vector time series (Box, et al. 1994) are appropriate. Preliminary models were fit assuming that the correlation between laser positions was not significantly different from zero, an assumption that was also tested. Several
23
FBMIS Volume 1, 2005, 19-35
ISSN 1740-5955
http://www.fbmis.info/A/5_1_StaudhammerCL_1
Copyright @ 2005 The FBMIS Group
time series models were fit6. Because the boards in each of the three types of saws (bandsaw, chipperhead, and circular saw) produced similar surface variability, different model forms were investigated by saw type. Models were chosen by visually assessing lack of fit and by computing Akaike’s Information Criteria (AIC, Box, et al. 1994). AIC measures the distance between the estimated model and a model ignoring correlation, with a penalty added for the number of parameters in the model. For data from a single board, side, and laser position, the AIC is given by: (3) AIC ijkl = −2 log (ψˆ ijkl | y ijkl ) + 2 K where:
( ψˆ ijkl | y ijkl ) is the empirical maximized log likelihood function; ψˆ ijkl is a row vector of estimated model parameters for the ith saw configuration, jth side, kth board, and lth laser position; y ijkl is a column vector of profile measurements from the ith saw configuration, jth side, kth board, and lth laser position; and K is the number of parameters in the model. Tests for lack of fit are available, e.g., the portmanteau test for autocorrelation of the residuals (Hosking 1980). However, this test has been shown to be strongly sensitive to departures from normality (Montanari, et al. 1997). Given the long-tailed non-Gaussian nature of these data, visual evaluation of lack of fit was judged more reliable. For each saw type, the model chosen was that which had the lowest AIC for the majority of series in the saw type and where the ACF of the residuals did not show lack of fit. To simplify notation in fitting separate models by saw configuration, board, side, and laser position, the subscript ijkl is replaced by f. Ignoring random effects in this stage, Model (1) becomes: (4) yfm = µf + εfm µˆ f was simply estimated as the mean value of the fth (saw configuration × board × side × laser position) profile. To account for autocorrelated errors within board and side, the {εfm} were modelled. For bandsawn boards, an autoregressive integrated moving average (ARIMA) model with first order differencing (i.e., the differencing parameter δf = 1), one autoregressive parameter (φf), and one moving average parameter (θf), was chosen. This ARIMA(1,1,1) model is given by: (5) (1 − φ f B )(ε f ,m − ε f , m −1 ) = α f + (1 − θ f B )υ f ,m
where: B is the backshift operator, e.g., (1 - φ f B)εfm = εfm - φf εf,m-1; αf is the intercept; and υfm is a white noise error process, with υfm ~ N(0,συf2). The differencing parameter is included in order to obtain a stationary data series. While stationary processes are those in which the statistical parameters (mean and standard deviation) do not change with time (Box, et al. 1994), a non-stationary process tends to drift away from its initial state. Initial plots of the LRS data showed non-stationary characteristics, such as cycles and shifts in the mean. Transformation to obtain a stationary model is desirable in that it ensures that early values of υm do not have influence over later values of εm. While non-parametric spline smoothing methods can remove non-stationary trend, the parametric approach is to find an appropriate differencing parameter. Including an intercept in this model corresponds to having a deterministic trend in the data series, which may be appropriate for a board that increases or decreases in profile along its length. An ARIMA model was also chosen to model the autocorrelated errors for about half of the circular-sawn boards. In particular, when the circular-sawn data were smooth and free of cyclical patterns caused by deep saw marks, the ARIMA(0,1,1) model, which is commonly used in SPC (e.g., Vander Wiel 1996, Young and Winistorfer 1999), was chosen: (6) ε f ,m − ε f ,m −1 = α f + (1 − θ f B )υ f ,m When circular saws overheat, the blades can become unstable, which causes the saw to dish and results in deep saw marks on the surface of the board. These marks were visible as cyclical patterns in the data for about half of the circular-sawn boards. For these boards, as well as all chipped boards, a model with seasonal and long-memory terms was appropriate. These data were modelled with a seasonal autoregressive fractionally integrated moving average (SARFIMA) model. Whereas φf and θf describe the short-term autoregressive and moving average behaviour of the ARIMA(1,1,1) series, respectively, Φf and Θf are parameters that describe cyclical (seasonal) behaviour with cycle length sf. Fractional (versus integer) values for the differencing order, δf, give the model long memory, and describe the cyclical nature of the long-memory behaviour. The chosen model was of the form SARFIMA(1,δf,1)x (0, δ ′f ,1)sf :
6
See Staudhammer (2004) for detailed within-board model fitting.
24
FBMIS Volume 1, 2005, 19-35
ISSN 1740-5955
http://www.fbmis.info/A/5_1_StaudhammerCL_1 s
s
δ′
Copyright @ 2005 The FBMIS Group δ
s
(1 − Φ f B f )(1 − φ f B)(1 − B f ) f (1 − B) f ε fm = α f + (1 − θ f B)(1 − Θ f B f )υ fm
(7)
The parameters of the ARIMA models were estimated using the SAS procedure PROC ARIMA. The parameters for the SARFIMA models were obtained in several steps. First, the seasonal period sf of each board × side was found by examining the spectrum of the first-differenced data using the SAS procedure PROC SPECTRA. Using the SAS linear regression procedure PROC REG, the parameters δf and δ ′f were then estimated simultaneously following Andel’s (1986) extension of Geweke and Porter-Hudak’s (1983) method. Finally, the autoregressive and moving average parameters were estimated with PROC ARIMA. Although ARIMA and SARFIMA models fit the data well, it should be noted that these models are non-stationary when δf and/or δ ′f are > 0.5. This implies an unbounded variance of εfm as the number of observations along the board (m) increases. While these models are valid in a descriptive sense, this property makes inference about individual data points questionable. After fitting models by board, side, and laser (f=ijkl), the bivariate relationship between the top and bottom laser for each board-side combination (ijk) was assessed by examining the cross-correlation function (CCF). The CCF measures the similarity between two variables, computed by the sum of the cross products between the two variables at different lags. Plots of the CCF were examined to check the assumption of non-zero correlation between the top and bottom laser positions at a significance level (α) of 0.05. • Stage 2: Between sample boards model. Since the lab scan samples were not scanned in the same order as sawn, the autocorrelation between sample boards was evaluated using the field scan data. PROC ARIMA was run with the mean values of each board × side (ijk) in the order in which they were sawn. The model form that produced the best (lowest) value of AIC was found as in Stage 1. The hypothesis of no autocorrelation between subsequent boards was verified when an ARIMA(0,0,0) model produced the lowest AIC. • Stage 3: Mixed-effects model. Ideally, Stage 3 would involve fitting Model (1) with the error covariance matrix structure estimated in Stages 1 and 2 using the SAS procedure PROC MIXED. However, due to computing limitations, this was not possible. Instead, Model (1) was modified to use the estimates of the residuals from Stages 1 and 2, µˆ f . Using εˆ fm estimated from (3), zfm was defined to represent the profile measurements without autocorrelation: • (8) z fm = µˆ f + (ε fm − εˆ fm ) = µˆ f + υˆ fm , or
zijklm = µˆ ijkl + υˆijklm
(9)
In Stage 3, PROC MIXED was used to estimate the parameters in the modified model in (9) for every saw configuration and side (ij): zijklm = µij + βijk + λijl + βλijkl + νijklm
(10)
where: νijklm are independent, identically distributed errors with νijklm ~ N(0,σνij2), and the other terms are distributed as in Model (1). 4 RESULTS Profile observations from a single board × side × laser position combination for three saw configuration × side combinations (BB-Side 1-Board 1-Laser 1, BC-Side 1-Board 2-Laser 1, RR-Side 1-Board 12-Laser 1) are shown in Figure 4. These same three samples were arbitrarily selected as examples of each saw type (Bandsaw, Chipper-head, and Circular Saw, respectively) for this section because they were the first samples measured of each saw type. Since each saw type produced similar results, the remaining five saw configuration × side combinations are not shown. The three profile data series show running patterns typical of autocorrelated time series data. The descriptive statistics calculated for the profile data show averages and variances in a range typical of Canadian lumber mills (Table 1). The average number of observations per board was slightly lower than 3,000 because of filtering for measurement errors and non-sawing defects. Statistics were somewhat lower for bandsawn boards; bandsaw machines tend to produce less variable material, which allows for smaller target dimensions to be set.
25
FBMIS Volume 1, 2005, 19-35
ISSN 1740-5955
http://www.fbmis.info/A/5_1_StaudhammerCL_1
Copyright @ 2005 The FBMIS Group
Profile
Table 1. Descriptive statistics for the profile data by saw configuration and side (cm). nij⋅⋅ Saw Configuration Side Min Max Avg. Std. Dev. Bandsaw-Bandsaw (BB) 1 (bandsawn) 2773 2.380 2.896 2.575 0.0509 2 (bandsawn) 2779 2.360 2.782 2.575 0.0502 Bandsaw-Chipper-head (BC) 1 (bandsawn) 2750 2.389 2.906 2.632 0.0626 2 (chipped) 2706 2.316 2.938 2.633 0.0668 Chipper-head-Bandsaw (CB) 1 (chipped) 2662 2.404 2.912 2.656 0.0630 2 (bandsawn) 2724 2.464 2.914 2.654 0.0562 Circular saw-Circular saw (RR) 1 (circular-sawn) 2727 2.434 2.883 2.650 0.0631 2 (circular-sawn) 2778 2.442 3.023 2.650 0.0656 Overall 2737 2.316 3.023 2.636 0.0585
Bandsaw Circular Saw Chipper-head
0
50
100
150
200
Distance along board (cm)
Figure 4. Observations from a single board-side-laser position for three saw configuration × side combinations (BB-Side 1-Board 1-Laser 1; BC-Side 1-Board 2-Laser 1; RR-Side 1-Board 12-Laser 1). Plots of the sample autocorrelation function (ACF) by saw type for the three samples in Figure 4 indicated that the ACFs for the bandsawn and circular-sawn data were very slow to decay; the ACF was significantly non-zero (α = 0.05) for more than 200 lags (Figure 5). The chipper-head sample shows a somewhat less persistent pattern, with the ACF dying off to a non-significant level at about 185 lags. 1 0 .9
A u to c o rr e la
0 .8 0 .7 0 .6 0 .5 0 .4 0 .3 0 .2 Bandsaw C h ip p e r - h e a d C ir c u la r S a w
0 .1 0 0
20
40
60
80
100
120
140
160
180
Lag
Figure 5. ACF of a single board-side-laser position for three saw configuration × side combinations (BB-Side 1-Board 1-Laser 1, BC-Side 1-Board 2-Laser 1, RR-Side 1-Board 12-Laser 1).
26
200
FBMIS Volume 1, 2005, 19-35
ISSN 1740-5955
http://www.fbmis.info/A/5_1_StaudhammerCL_1
Copyright @ 2005 The FBMIS Group
4.1 Model ignoring autocorrelation. Estimates of the mean and components of variance (COV) from (1) are in the range of “typical” mill data (Table 2). For example, Maness et al. (2004) used a range of 0.01 to 0.09 cm for the COV of board thicknesses in their SPC simulation study Except for laser position, variances were significantly different from zero (α = 0.05) for all saw configurations and sides. Since the interaction of boards and laser positions was significant, the effect of laser position was not consistent by board for each saw configuration and side combination. For the BB and RR saw configurations, the estimates for Sides 1 and 2 were very close. BC and CB saw configurations produced the most dissimilar estimates, especially for the residual variance. However, this estimated variance is likely biased due to the non-zero autocorrelation. Table 2. Estimated parameters (cm) by saw configuration and side for model ignoring autocorrelation. Saw Configuration BB BC CB RR Parameter Side 1 Side 2 Side 1 Side 2 Side 1 Side 2 Side 1 Side 2 2.575 2.575 2.632 2.634 2.656 2.655 2.651 2.650 µij 0.0204 0.0205 0.0289 0.0305 0.0328 0.0338 0.0403 0.0403 σβij 0.0052 0.0051 0.0083 0.0066 0.0048 0.0061 0.0174 0.0167 σλij 0.0238 0.0238 0.0292 0.0280 0.0286 0.0274 0.0352 0.0341 σβλij 0.0403 0.0395 0.0481 0.0529 0.0462 0.0368 0.0357 0.0404 σε ij Estimates of the variability of the profile data were derived using the components of variance, the number of sample boards (b1 =41 for BB, b2 = b3 =24 for BC and CB, and b4 =21 for RR), number of laser positions (2), and average number of measurements per board, side, and laser ( nij ≈ 2800). For each saw configuration and side, the standard deviation of the mean by board and laser ( y ijkl ⋅), mean by board ( yijk ⋅⋅ ), and overall for the saw configuration × side combination ( y ij ⋅⋅⋅ ) can be constructed as (following Neter, et al. 1996):
σy
ijkl .
= var( β ijkl ⋅ ) + var(λijkl ⋅ ) + var( βλ ijkl ⋅ ) + var(ε ijkl ⋅ )
(11)
2 = σ β2 ij + σ λ2 ij + σ βλ + var(ε ijkl ⋅ ) ij
σy
ijk ⋅⋅
= σ β2 ij +
σy = ij ⋅⋅⋅
σ β2 ij bi
+
σ λ2 ij 2
σ λ2 ij 2
+
+
2 σ βλ ij
2 2 σ βλ ij
2bi
+
var(ε ijkl ⋅ )
+
(12)
2
var(ε ijkl⋅ )
(13)
2bi
When the yijklm are independent and identically distributed, the variance of the average residuals by board and laser position is given by (Neter, et al. 1996): var(ε ijkl⋅ ) = σ ε2 ij nij
(14)
This variance would be nearly zero when the number of laser measures on a particular board, side, and laser position is very large (i.e., for very large nij ). However, given the significant non-zero autocorrelations to 200 lags, (14) is a biased estimate of the variance of the average residual ( ε ijkl ⋅ ). Assuming that there is no significant long-range dependence, this variance could be estimated using: var(ε ijkl ⋅ ) ≅
σ υ2 ij nijkl
1 +
2(nijkl − 1)
nijkl
ρˆ ijkl 1 +
2(nijkl − 2)
nijkl
ρˆ ijkl 2 + ...
(15)
However, this also approaches zero for very large nijkl,. Table 3 shows estimates of the standard deviations for the profile data using (11) – (13) and assuming negligible variation from average residuals. Estimates of within-board variability of less than 0.03 cm are desirable for mills; these estimates are slightly higher, especially for the circular-sawn and chipped boards.
27
FBMIS Volume 1, 2005, 19-35
ISSN 1740-5955
http://www.fbmis.info/A/5_1_StaudhammerCL_1
Copyright @ 2005 The FBMIS Group
Table 3. Estimated standard deviations (cm) by saw configuration and side for model ignoring autocorrelation. Saw Configuration Standard BB BC CB RR Deviation Side 1 Side 2 Side 1 Side 2 Side 1 Side 2 Side 1 Side 2 σ y ijkl ⋅ 0.0318 0.0319 0.0419 0.0420 0.0438 0.0439 0.0563 0.0554 σ y ijk ⋅⋅ 0.0267 0.0268 0.0360 0.0367 0.0387 0.0392 0.0489 0.0485 σ y ij ⋅⋅⋅ 0.0267 0.0268 0.0360 0.0367 0.0387 0.0392 0.0489 0.0485
Table 4 shows examples of predicted profile values ( yˆ ijklm ) for several saw configurations and sides. The predictions were computed as the sum of the overall mean for the saw configuration, plus the effect by board, by laser, and by laser × board. Residuals were computed as the difference between the actual profile value and the predicted values (from Table 4). A plot of the residuals for saw configuration BB – Side 1 is shown in Figure 6. Residual plots for other saw configurations were very similar. These residuals show distinctive wave patterns, indicating that Model (1) with uncorrelated errors may be inappropriate. Table 4. Examples of predicted profile values (cm) using fixed and random effects estimates for the model ignoring autocorrelation. Laser µˆ ij λˆijl yˆ ijklm βˆλijkl βˆijk Saw Configuration Sample Side Position 1 Bandsaw-Bandsaw (BB) 1 (B) 1 (bottom) 2.575 -0.015 0.003 -0.001 2.562 2 (top) 2.575 -0.015 -0.003 -0.020 2.537 2 1 (bottom) Chipper-head-Bandsaw (CB) 1 (C) 2.656 -0.054 -0.002 -0.035 2.564 2 (top) 2.656 -0.054 0.002 -0.007 2.597 Circular saw-Circular saw (RR) 12 1 (R) 1 (bottom) 2.651 -0.073 0.011 -0.066 2.523 2 (top) 2.651 -0.073 -0.011 0.011 2.578 0 .1 0 0 0 .0 7 5
Residual (cm)
0 .0 5 0 0 .0 2 5 0 .0 0 0 - 0 .0 2 5 - 0 .0 5 0 - 0 .0 7 5 - 0 .1 0 0 0
50
100
150
200
250
D is ta n c e a lo n g b o a rd (c m )
Figure 6. Residuals from model ignoring autocorrelation (Saw Configuration BB-Side 1-Board 1). 4.2 Autocorrelated model. 4.2.1 Stage 1: Within sample board model. The estimated ARIMA parameters for the bandsawn data and circular-sawn data without saw marks are shown in Table 5. Tests of the model residuals indicated that residual correlations were significantly different from zero (α = 0.05) for about 30% of the series; however, the magnitudes of the estimated correlations were less than 0.05 and the number of observations was large (nf ≈ 2800), indicating that the correlations are too low to be of practical importance. The estimate of the parameter αf was significantly different from zero (α=0.05) for nine of 306 (< 3%) series, indicating that linear trend could be assumed zero for all series. The estimated values of θf were significantly different from zero (α=0.05) and positive in all cases, which is
28
FBMIS Volume 1, 2005, 19-35
ISSN 1740-5955
http://www.fbmis.info/A/5_1_StaudhammerCL_1
Copyright @ 2005 The FBMIS Group
consistent with model forms obtained for batch processes with strong mixing between subsequent batches (e.g., Vander Wiel 1996). Estimates of φf, on the other hand were slightly more varied. Table 5. Summary of estimated ARIMA(1,1,1) model (5) parameters (mm) for bandsawn boards (188 series) and ARIMA(0,1,1) model (6) parameters (mm) for circular-sawn boards without saw marks (118 series). % significant indicates the percent of all samples (one sample is a board, laser, side combination) which indicated effects different from zero. Bandsaw Circular Saw ˆ ˆ σˆ υ f σˆ υ f θf θˆ f αˆ f αˆ f φf
Average 0.0000 0.7027 0.2101 0.0967 Minimum -0.0032 0.3611 -0.0893 0.0619 Maximum 0.0031 0.8884 0.5859 0.1385 % Significant 5% 100% 94%
0.0001 -0.0013 0.0018 0%
0.5527 0.1009 0.2520 0.0688 0.7536 0.1366 100%
Estimates of the SARFIMA model parameters for data from chipped boards and circular-sawn boards without saw marks indicate that cycle lengths for most of the circular-sawn and chipped boards were 22-24 measurements, which corresponds to a distance along the board of approximately 2 cm (0.8 inch) (Table 6). Estimates of δf and δ ′f were wide-ranging; however, they were similar for chipped and circular-sawn boards. On average, most values of δf and δ ′f were greater than 0.5, indicating that the best-fitting models were non-stationary with unbounded variance. The estimated values of θf, Θf, φf and Φf were significantly different from zero (α = 0.05) for almost all series. The estimated values of θf and Θf were positive in all cases, indicating a strong mixing process; estimates of φf and Φf were slightly more varied. The estimates of αf were significantly different than zero more often than with the bandsawn data, indicating a very small, but statistically significant thickening or thinning along the length of the board in 14% of the sample series. Table 6. Summary of estimated SARFIMA(1,δf,1)x(0,δ ′f ,1)s model parameters (mm) for chipper-head data (96 series) and circular-sawn data without saw marks (38 series). ˆ ˆ σˆ υ f αˆ f sˆ f δˆ f δˆ ′f φˆ f Φ θˆ f Θ f f
Chipper-head Average Minimum Maximum % Significant Circular saw Average Minimum Maximum % Significant
24 22 50
0.677 0.304 1.000 100%
0.207 0.0001 -0.1589 -0.0972 0.7045 -0.227 -0.0006 -0.3217 -0.3489 0.4284 0.941 0.0010 0.0791 0.1290 0.9161 79% 13% 90% 73% 100%
0.7880 0.1425 0.5102 0.0891 0.8911 0.2315 100%
23 22 48
0.587 0.308 0.975 100%
0.353 0.0000 -0.1259 -0.1432 0.7647 0.081 -0.0006 -0.2905 -0.2369 0.5468 0.555 0.0004 0.1127 -0.0502 0.9273 100% 11% 95% 95% 100%
0.7871 0.1381 0.5715 0.0847 0.8948 0.1788 100%
Cross-correlations were examined to quantify the relationship between the bottom (Laser 1) and top (Laser 2) laser positions. Figure 7 compares the cross-correlation of the original first-differenced series with those of the ARIMA model residuals for a bandsawn sample (BB-Side 1). Dotted lines indicate 99% confidence intervals for the cross-correlations. Although there were non-zero (α = 0.05) crosscorrelations at some lags, this is not unexpected given the large number of observations. More important, the ARIMA model did not generate any obvious pattern, which would indicate a crosscorrelation between laser positions within board and side. Similarly, no patterns were obvious for chipped and circular-sawn lumber (not shown).
29
FBMIS Volume 1, 2005, 19-35
ISSN 1740-5955
Input Series
Copyright @ 2005 The FBMIS Group
ARIMA
Cross-Correlation
http://www.fbmis.info/A/5_1_StaudhammerCL_1
-200
-150
-100
-50
0
50
100
150
200
Lag
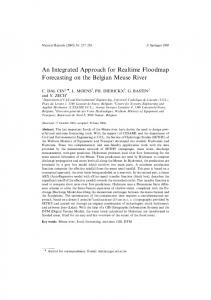
Figure 7. Cross-correlation of Laser 1 versus Laser 2 for Saw Configuration BB-Side 1-Board 1. 4.2.2 Stage 2: Between sample board model. The series of average cant profiles from the field scan data indicated no apparent trend or pattern indicative of an autocorrelated series (Figure 8). Although the 100th and 179th scans were comparatively small, they are not outside the normal range of variation in cant profile data. Lack of autocorrelation was confirmed by results from PROC ARIMA and the ACF of the field scanned series appeared to be white noise (Figure 9). The model form with the lowest AIC was an ARIMA(0,0,0), indicating a model without any time series parameters was the best-fitting. Thus, no adjustment to the residuals for between-board correlations was made before estimating the mixedmodel effects. 1 0 .3
Average Cant Profile (cm)
1 0 .2
1 0 .1
10
9 .9
9 .8
9 .7 0
50
100
150
Scan N um ber
Figure 8. Average cant profiles by scan number for field scan data.
30
200
FBMIS Volume 1, 2005, 19-35
ISSN 1740-5955
http://www.fbmis.info/A/5_1_StaudhammerCL_1
Copyright @ 2005 The FBMIS Group
0.35
Autocorrelation Function
0.25
0.15
0.05
-0.05
-0.15
-0.25 0
5
10
15
20
25
30
35
40
45
50
Lag
Figure 9. ACF of average cant profiles for field scan data. 4.2.2 Stage 3: Mixed-effects model. The estimated mean and COVs for the autocorrelated models are listed in Table 7. All estimated COV were nearly identical to those of the model ignoring autocorrelation, except for the residual variation, which was considerably smaller. However, the estimates from the two models are not directly comparable, because the model ignoring autocorrelation estimated the residual variance, σ2εij, and the multi-stage model estimated the residual variance, σ2νij. As in the model ignoring autocorrelation, all effects, except laser, were significantly different from zero (α = 0.05) in the autocorrelated model. Estimates of the variability computed using equations (11) – (13) are shown in Table 8. As in the model ignoring autocorrelation, the contribution of the variation from average residuals was negligible. While the estimation of σ2νij in the autocorrelated model (versus σ2εij in the model ignoring autocorrelation) prevents exact comparisons between the two models, the negligible residual variation makes estimates of the standard deviations of the means effectively comparable. Estimates of the various standard deviations of the means under the autocorrelated model were nearly identical to those of the model ignoring autocorrelation; the standard deviations were higher for circular-sawn boards versus chipped and bandsawn boards, and estimates on the chipped sides of BC and CB boards were higher than on the bandsawn sides. Table 7. Estimated parameters (cm) by saw configuration and side for multi-stage model. Saw Configuration BB BC CB RR Parameter Side 1 Side 2 Side 1 Side 2 Side 1 Side 2 Side 1 Side 2 2.575 2.575 2.632 2.634 2.656 2.655 2.651 2.650 µij σβij 0.0204 0.0205 0.0289 0.0304 0.0326 0.0337 0.0403 0.0403 σλij 0.0052 0.0052 0.0083 0.0066 0.0050 0.0061 0.0173 0.0167 σβλij 0.0238 0.0238 0.0292 0.0281 0.0287 0.0274 0.0351 0.0340 σνij 0.0095 0.0095 0.0103 0.0147 0.0142 0.0098 0.0112 0.0125 Table 8. Estimated standard deviations by saw configuration and side for multi-stage model. Standard BB BC CB RR Deviation Side 1 Side 2 Side 1 Side 2 Side 1 Side 2 Side 1 Side 2 σ y ijk ⋅⋅ 0.0318 0.0319 0.0419 0.0419 0.0437 0.0439 0.0561 0.0553 σ y ijkl ⋅ 0.0267 0.0268 0.0360 0.0366 0.0386 0.0391 0.0489 0.0484 σ y ij ⋅⋅⋅ 0.0267 0.0268 0.0360 0.0366 0.0386 0.0391 0.0489 0.0484
Examples of predicted profile values are not shown, as they are nearly identical to that of the model ignoring autocorrelation (Table 5). The residual plots for all saw configurations and sides appeared to be free of any pattern, as indicated by Figure 10 for Saw Configuration BB, Side 1. The assumption
31
FBMIS Volume 1, 2005, 19-35
ISSN 1740-5955
http://www.fbmis.info/A/5_1_StaudhammerCL_1
Copyright @ 2005 The FBMIS Group
that the errors (νfm) were free of autocorrelation appeared to be valid, indicating that the selected autocorrelation models fit the data. 0.050 0.040 0.030
Residual (cm)
0.020 0.010 0.000 -0.010 -0.020 -0.030 -0.040 -0.050 0
50
100
150
200
250
Distance along board (cm)
Figure 10. Residuals from multi-stage model for Saw Configuration BB-Side 1-Board1. 4.3 Comparison of models. The model ignoring autocorrelation and the multi-stage model were compared using the Akaike’s Information Criteria (AIC) (Table 9). In all cases, the model with the lowest AIC was the autocorrelated model. Thus, accounting for the autocorrelative structure of the errors reduced the amount of unexplained variation in the model. 5 DISCUSSION
A statistical model was derived to describe real-time laser measurements, which can be used as the basis for an SPC system for automated lumber manufacturing. This model differs from traditional models for SPC data in that there are several identifiable sources of variation and the data suggest a large and significant autocorrelative structure. Table 9. Comparison of Akaike’s Information Criteria (AIC) for model ignoring autocorrelation and multi-stage model. Model ignoring Multi-stage Autocorrelation Model Saw Configuration Side Bandsaw–Bandsaw (BB) 1 (B) 1,897,850 1,242,197 2 (B) 1,903,131 1,238,285 Bandsaw–Chipper-head (BC) 1 (B) 1,157,610 770,185 2 (C) 1,151,176 740,684 Chipper-head–Bandsaw (CB) 1 (C) 1,070,338 721,144 2 (B) 1,104,387 748,187 Circular Saw–Circular Saw (RR) 1 (R) 977,059 671,419 2 (R) 930,981 653,388
Estimation of the model components of variation was undertaken with and without considering the autocorrelative structure of the errors. Although most of the parameter estimates were nearly identical, important differences were observed. Under the model ignoring autocorrelation, residuals exhibited strong cyclical patterns and there was large and significant non-zero autocorrelation. Appropriate univariate autocorrelation models were found, as indicated by residual plots that were without pattern and correlations that were not significantly different from zero. Although fitting a multivariate model is intuitively appealing, there was no compelling statistical evidence of a bivariate relationship between the top and bottom laser positions. This is likely a consequence of the mechanics of the sawing
32
FBMIS Volume 1, 2005, 19-35
ISSN 1740-5955
http://www.fbmis.info/A/5_1_StaudhammerCL_1
Copyright @ 2005 The FBMIS Group
processes, as varying feedspeeds may have produced varying relationships between the top and bottom lasers along the length of the boards. Since independent errors are necessary for statistical tests in mixed-effects modelling, the autocorrelation model should be used for hypothesis testing. Fitting an autocorrelated model also provided insight into the sawing process, as the autocorrelative structure was different depending on the saw type. Long and short-term cyclical behaviour was prominent in the chipper-head data and the circular-saw data when saw marks were present. Whereas certain cycles are normal and expected in chipper-head data, cycles in circular-sawn data could indicate the irregular wave patterns known as washboarding, or deep saw marks. These sawing defects occur when a saw blade loses stiffness due to heat caused by friction and often indicates a need for saw maintenance, such as saw tensioning (Schajer 1989). Finding these sorts of cycles may help in diagnosing maintenance problems. However, the more simple model ignoring autocorrelated errors is appealing, in that it is easier to fit and would, therefore, be much easier to use if process parameters needed to be updated during processing. Moreover, violation of the statistical assumptions does not invalidate the model as a descriptive tool. While autocorrelation may cause estimates of the error variance to be biased, parameter estimators, such as the mean, are unbiased (Schabenberger and Pierce 2001). The mean and COV estimates for the model ignoring autocorrelation were very similar to those of the autocorrelated model. Although the residual variances were not directly comparable, the standard deviations were comparable in practical terms, and these estimates were found to be nearly identical. This result was not unexpected, since the only significant autocorrelation in the model was within each board × side × laser position, and the number of laser measures is very high. The real-time LRS data will be used primarily in constructing control charts for monitoring sawing performance. Because of the abundance of real-time data, individual observations cannot be monitored. Instead, averages and trends by board, or other measures of surface profile variation must be used. Alternative methods to monitor the surface profiles could be derived from fitting the within sample board model. For instance, as boards were scanned, the parameters of each board × side × laser model could be estimated and compared to a standard. Spectral analysis could also be used to look for changing cycles in the data. While the cycles may help to uncover maintenance issues for the circular saws, the ARIMA and SARFIMA parameters are less helpful. While ARIMA and SARFIMA models were found to adequately describe the profile data and quantify its autocorrelative structure, neither model form is good for prediction. Because these models are non-stationary, models with the same parameter estimates can look quite different, and thus ARIMA and SARFIMA parameters are not particularly useful in terms of SPC. Measures, such as the average profile by board or the average simple linear trend over a board are more useful for SPC applications. Since control limits constructed for these quantities rely on standard deviations of means (e.g., by board and side, or by board, side, and laser position), the model ignoring autocorrelation would be adequate to describe the data for these purposes. An important step in this analysis was verifying the lack of significant autocorrelation between subsequent boards. This finding was surprising, since relationships between subsequent boards for a particular saw might be expected. However, the sawn logs are an arbitrary sample of wood fiber, and may represent different growing conditions, moisture contents, and wood densities. Different log tapers and shapes cause operators to make different decisions, and the setworks for the saw are reset for each log. It may be that the random inputs to the process are strong enough to prevent substantial autocorrelation during “normal” operating conditions. If a significant autocorrelation between boards was detected, this could indicate quality problems, as machines that go out of adjustment tend to stay out of adjustment. 6 CONCLUSIONS
The development of an SPC protocol for real-time systems presents numerous challenges in data collection, filtering, and analysis. A model was developed to describe LRS data as a basis for SPC protocol. Although the autocorrelated errors model better describes the process, the more simple one with uncorrelated errors is easier to fit and could be used for most SPC data applications. The model was used to investigate possible monitoring protocols for the sawing process. For example, saws may be monitored by tracking the average profile for each sample board and comparing it to control limits which are constructed with the standard error of the mean sample board. Other sawing defects may be monitored by tracking the individual components of variance. For instance, wedge results in a large difference between the top and bottom laser positions, and would be indicated by high between-laser variation.
33
FBMIS Volume 1, 2005, 19-35
ISSN 1740-5955
http://www.fbmis.info/A/5_1_StaudhammerCL_1
Copyright @ 2005 The FBMIS Group
To further improve the applicability of LRS data models, information about the specific saws that were engaged during the cut should be recorded. Although this would require designing an interface with the programmable logic controllers used to control the saws, it would increase the usefulness of the model by providing data on specific saws. Data that includes sawing defects should also be collected. For instance, the cycles present in the saw marks from circular-sawn boards could be investigated. Cycle detection via spectral analysis may provide an early warning for saw maintenance protocols and prevent the waste associated with excess washboarding in lumber. Although correlations among subsequent boards were not found for these data, correlations may occur when there is a saw malfunction. This possibility should be investigated with a sample taken during a time of saw malfunction. ACKNOWLEDGEMENT
This research was supported by the Florida Agricultural Experiment Station and grants from the Natural Sciences and Engineering Research Council of Canada and the Science Council of British Columbia, and approved for publication as Journal Series No. R-10838. The authors would like to thank Prof. Keith Rennolls and two anonymous reviewers, whose useful comments improved an earlier version of this manuscript. REFERENCES
Andel, J. (1986) Long memory time series models. Kybernetika 22, 105-123. Austin, M. P., and Meyers, J. A. (1996) Current approaches to modelling the environmental niche of eucalypts: implication for management of forest biodiversity. Forest Ecology and Management 85, 95-106. Box, G. E. P., Jenkins, G. M., and Reinsel, G. C. (1994) Time Series Analysis: Forecasting and Control, 3rd ed. Prentice Hall, New York, 592pp. Brocklebank, J. C., and Dickey, D. A. (2003) SAS for Forecasting Time Series, 2nd ed. SAS Institute, Inc., Cary NC, 398pp. Burman, H. (2002) Laser strip adjustment for data calibration and verification. Presented at Symposium 2002: ISPRS Commission III. Graz, Austria. Chen, G., Abraham, B., and Bennet, G. (1997) Parametric and non-parametric modeling of time series an empirical study. Environmetrics 8, 63-74. Geweke, J., and Porter-Hudak, S. (1983) The estimation and application of long memory time series models. Journal of Time Series Analysis 4, 221-238. Hosking, J. R. M. (1980) The multivariate portmanteau statistic. Journal of the American Statistical Association 75, 602 -608. Maness, T. C., Kozak, R. A., and Staudhammer, C. L. (2004) Reliability testing of statistical process control procedures for manufacturing with multiple sources of variation. Wood and Fiber Science 54, in press. Maness, T. C., Staudhammer, C. L., and Kozak, R. A. (2002) Statistical considerations for real-time size control systems in wood products manufacturing. Wood and Fiber Science 34, 476-484. Montanari, A., Rosso, R., and Taqqu, M. S. (1997) Fractionally differenced ARIMA models applied to hydrologic time series: Identification, estimation, and simulation. Water resources research 33, 1035-1044. Montgomery, D. C. (2001) Introduction to Statistical Quality Control. John Wiley & Sons, New York, 796pp. Neter, J., Kutner, M. H., Wasserman, W., and Nachtsheim, C. J. (1996) Applied Linear Statistical Models, 4th ed. Irwin, Chicago, xv, 1408pp. Noffsinger, J. R., and Anderson, R. B. (2002) Effect of autocorrelation on composite panel production monitoring and control: a comparison of SPC techniques. Wood Products Journal 52, 60-67. SAS Institute (2002) SAS/STAT User's Guide, Version 8, Vol. 2, 8.2. SAS Publishing, Cary, NC, 3884pp. Schabenberger, O., and Pierce, F. J. (2001) Contemporary Statistical Models for the Plant and Soil Sciences. CRC Press, Boca Raton, 738pp. Schajer, G. S. (1989) The importance of circular saw tensioning. Forest Industries/World Wood Technical Report, T14-T16.
34
FBMIS Volume 1, 2005, 19-35
ISSN 1740-5955
http://www.fbmis.info/A/5_1_StaudhammerCL_1
Copyright @ 2005 The FBMIS Group
Schajer, G. S. (1990) Designing a saw that works involves many factors. Forest Industries 117, 17-20. Schajer, G. S., and Gazzarri, J. I. (2004) Surface profiling using sequential sampling and inverse methods. Part I: Mathematical background. Experimental Mechanics 44, 473-479. Shewhart, W. A. (1931) Economic control of quality of manufactured product. Van Nostrand, New York, NY, 501pp. Staudhammer, C. L. (2004) Statistical procedures for development of real-time statistical process control (SPC) systems in lumber manufacturing. Ph.D. thesis, The University of British Columbia, Vancouver, BC, Canada. Vander Wiel, S. A. (1996) Monitoring processes that wander using integrated moving average models. Technometrics 38, 139-151. Warren, W. G. (1973) How to calculate target thickness for green lumber, Technical, Department of the Environment, Canadian Forestry Service, Western Forest Products Laboratory. Wehr, A., and Lohr, U. (1999) Airborne laser scanning - and introduction and overview. ISPRS Journal of Photogrammetry and Remote Sensing 54, 68-82. Wheeler, D. J. (1995) Advanced Topics in Statistical Process Control. SPC Press, Knoxville, TN, 484pp. Young, T. M., and Winistorfer, P. M. (1999) SPC. Forest Products Journal 49, 10-17. Young, T. M., and Winistorfer, P. M. (2001) The effects of autocorrelation on real-time statistical process control with solutions for forest products manufacturers. Forest Products Journal 51, 7077.
35