and Canfield 1996) and sediments of Long Island Sound (Aller 1994b). ... group of minerals with different structures and reactivities (Canfield 1989, Postma.
A comparison of iron oxide reactivity within and between aquatic sediments
Imola Ferro, Jack J. Middelburg, Caroline P. Slomp, Ralf R. Haese
2.1.
Abstract
The reactivity of sedimentary iron oxide is usually characterised by the size of various operationally defined iron pools. These different iron pools partly overlap, cover a large range of reactivities, and are affected by various sediment properties. We used a kinetic method (Postma 1993) in which iron oxide reactivity is represented as a reactive continuum, and compare results of a freshwater, an estuarine and a deep-sea sediment to traditional, single-step extraction results. Depth profiles were derived using both approaches. The traditional extraction methods have sufficient resolving power to reveal concentration differences of reactive iron oxides between samples from deep-sea, estuarine and freshwater sediments, but result in homogeneous depth profiles for iron oxide composition in the latter two sediments. The reactive continuum approach resulted in heterogeneous depth profiles of initial iron oxide reactivity and reactivity distribution for estuarine and freshwater sediments, thereby revealing differences in iron oxide composition. Due to low concentrations of reactive iron oxides the reactive continuum approach was not applicable in deep-sea sediments. Reactivities were independent of sediment surface area and the load of reactive iron oxides.
2.2.
Introduction
In aquatic sediments bacteria degrade organic matter. In the first stage of degradation this is done aerobically, with oxygen as electron acceptor. When all oxygen is depleted anaerobic respiration starts, with mineralization processes occurring in the following order: nitrification, manganese oxide reduction, iron oxide reduction, sulphate reduction and methanogenesis. Both aerobic and anaerobic degradation pathways have intensively been studied (e.g. Canfield et al. 1993a, Canfield et al. 1993b, Kristensen and Holmer 2001, Jorgensen 1977, Thamdrup et al. 1994a, Roden and Edmonds 1997, Thamdrup 2000). For iron- and manganese oxides, both solid-phase electron acceptors, sediment characteristics such as organic carbon concentration, pool size and the degree of sediment disturbance (e.g. bioturbation by benthic fauna) are important factors determining the relative importance of the corresponding degradation pathways
✔✘
✫❋❖L◗❏✄❘I✄L❘◗✄❉◗G✄P❉◗❏❉◗❍❍✄L◗✄I❍❑❉❍✎ ❍❉L◗❍✄❉◗G✄G❍❍❙✄❍❉✄❍GLP❍◗
2.
✩✄❋❘P❙❉L❘◗✄❘I✄L❘◗✄❘LG❍✄❍❉❋LL✄L❑L◗✄❉◗G✄❊❍❍❍◗✄❉❚❉L❋✄❍GLP❍◗
(Soetaert et al. 1996, Wijsman et al. 2002, Aller 1990, Canfield 1994). Physical or biological reworking may enhance sediment-water exchange and increase recycling of both oxides (Aller 1994b, Aller 1990, Mulsow et al. 1998, Kristensen 2000). Furthermore, particle mixing is important to replenish the electron acceptors at the depth of reduction, which is of limited importance for dissolved electron acceptors such as nitrate or sulfate. Therefore, in sediments with a high bioturbation ironand manganese oxide reduction can be important mineralization pathways. For example, Canfield et al. 1993a reported a contribution of iron oxide reduction of 71-84 % to the total decomposition of organic matter in some Skagerrak sediments. However, in another Skagerrak sediment the high manganese-oxide concentration and the high biodiffusion coefficient results in organic mater degradation completely performed via dissimilatory manganese reduction. An important role for manganese oxide reduction due to bioturbation has been reported as well for the sediment along the continental margin of Chile (Thamdrup and Canfield 1996) and sediments of Long Island Sound (Aller 1994b). Thamdrup et al. 1994a reported smaller contributions of iron and manganese oxide reduction to total mineralization for Aarhus Bay than for Skagerrak sediment due to the smaller rate of bioturbation. The relative importance of iron oxide reduction in anaerobic degradation of organic matter depends not only on the above-mentioned factors (organic carbon loading, availability of other electron acceptors), but also on the size and characteristics (i.e. reactivity) of the sedimentary iron pool (Postma and Jakobsen 1996, Jakobsen and Postma 1999). Sedimentary iron oxides form a heterogeneous group of minerals with different structures and reactivities (Canfield 1989, Postma 1993, Burdige 1993). The structures and reactivities range from amorphous and very reactive (e.g. freshly precipitated iron oxides) to crystalline and nearly inert for aged iron oxides. Sedimentary iron oxides originate from two major sources. They are either external and include detrital and those formed in the water column (hydrogenous iron oxides), or they are newly formed in the sediments (diagenetic). This distinction has consequences for their reactivity (Haese et al. 2000). The external iron oxide input, i.e. detrital iron oxides, results from settling particles. They may originate either from the adjacent land (recycled from rocks or formed during weathering) or were formed during riverine and marine transport. Moreover, they may also originate from re-suspension of nearby or distal sediments. Because of this variety of possible iron oxide inputs, it is very likely that detrital iron oxides vary in chemical composition, grainsize and crystalinity and therefore also in reactivity.
✔✙
✔✚
✫❋❖L◗❏✄❘I✄L❘◗✄❉◗G✄P❉◗❏❉◗❍❍✄L◗✄I❍❑❉❍✎ ❍❉L◗❍✄❉◗G✄G❍❍❙✄❍❉✄❍GLP❍◗
The formation of iron oxides within sediments results in a pool of diagenetic iron oxides. These oxides are formed by (re)-oxidation of sedimentary Fe (II). The freshly formed iron oxides are less crystalline and therefore have a higher initial reactivity than older, more crystalline, oxides (Larsen and Postma 2001). Iron oxide formation and precipitation occurs upon chemical or microbiological oxidation of Fe (II), with O2, nitrate or Mn-oxides (Postma 1985, Aller 1990, Luther et al. 1997, Sobolev and Roden 2001). The oxidation process may result in an iron-rich layer in the sediment occurring just above the reduced dissolved iron peak, where initial iron oxide reactivity is expected to be higher than in the rest of the profiles. Iron-enriched layers have been observed in many sediments e.g. Black Sea sediment (Thamdrup et al. 2000, Wijsman et al. 2001c, Wijsman et al. 2001b), Skagerrak sediments (Canfield et al. 1993b), North Sea sediments (Slomp et al. 1996), sediments from the Mediterranean Sea (DeLange et al. 1989, Pruysers et al. 1993), Atlantic sediments (Wilson et al. 1986) and salt marsh sediments (Kostka and Luther 1994, Luther et al. 1992). The reactivity and distribution of sedimentary iron oxides are usually based on extractions with different leachants (Canfield 1989). Iron-oxide pools can be defined on an operational basis, separating pools e.g. of amorphous iron oxides, AVS, and crystalline Fe (III) oxides. However, application of these extractions to study the reactivity of iron oxides within and between sediments is not straightforward. Leachants do not extract specific minerals. Iron may be released from a variety of phases during one extraction. Moreover, these operationally defined iron extractions result in data which are dependent on the sediment grain size (Munch J.C. and Ottow 1980). Therefore, the operationally defined extractions do not provide a quantification of iron oxide reactivity by means of a rate constant, but a quantity of a potentially reactive fraction of the total sediment. As an alternative, iron oxide reactivity has been proposed to be regarded as a continuum, which leads to an operationally kinetic approach (Postma 1993). Since the reactivity of iron oxides may determine the rate of iron oxide reduction (Postma and Jakobsen 1996, Jakobsen and Postma 1999), this implies that iron oxide reactivity may have an important influence on the competition of organic matter degradation pathways. Consequently, the determination of rate constants for iron reduction in various environments may help to understand the controls on microbial pathways. Postma 1993 presented an approach to quantify the reactivity of iron oxides and that allows a comparison of iron oxide reactivity within and between sediments. It involves an extraction of iron oxides with an ascorbic acid solution and measurement of the release of iron as a function of time. The iron release with time curve is interpreted with a reactive continuum approach allowing
✩✄❋❘P❙❉L❘◗✄❘I✄L❘◗✄❘LG❍✄❍❉❋LL✄L❑L◗✄❉◗G✄❊❍❍❍◗✄❉❚❉L❋✄❍GLP❍◗
calculation of the iron oxide reactivity distribution and initial reactivity. A more detailed description of the approach is given below. Here, we apply the reactive continuum approach to sediments from freshwater, subtidal coastal and deep sea environments differing in grain size, organic carbon and iron oxide concentrations. Iron oxide characterisations based on the traditional extraction approach are compared with those based on the reactive continuum approach.
2.3.
Materials en Methods
2.3.1.
Sites
Sediment was collected at a tidal freshwater site, two subtidal saline sites and two deep-sea stations (Table 1). Sediments were collected by box coring unless indicated otherwise. Appels, the tidal freshwater site is in the tidal reach of the Scheldt River. Cores were taken manually during low tide. Porewater measurements result from samples taken in October 1998, extraction data result from samples taken in June 2000. No microelectrode results are available. The two subtidal estuarine sites are situated in Lake Grevelingen (The Netherlands): Vliegertje and Geul. These sites were sampled three times: in February 1999 microelectrode and porewater profiles were measured, while cores taken in April 1999 were used for extractions and the kinetic approach as well as those taken in June 2000. The deep-sea sites are located in the Eastern Mediterranean Sea: Florence Rise and Eratosthenes Seamount. Samples were taken by box coring and multi-coring during a cruise with R.V. Logachev in August-September 1999. 2.3.2.
Suspended particulate matter
At the intertidal station Appels, sediment suspended and deposited during high tide periods was collected with cylindrical traps dug in the sediment. This material includes the bed load and will therefore be more similar to the sediment than if only suspended particulate matter would have been collected. For sake of simplicity we call this fraction suspended particulate matter. Sediment trapped in cores higher on the flat are presented as –0.75 cm, while the sediment trapped in cores situated in the lower flat are at –0.25 cm in the depth profiles. In Lake Grevelingen suspended particulate matter was collected in July 2000, on Teflon sheets by continuous flow centrifugation (see Middelburg and Nieuwenhuize 1998). The material was divided in size / density fractions that were separated by position on the collection sheet. For our analyses we used three operationally defined fractions, a light fraction which is composed of fine small sized particles, an intermediate
✔✛
Table 1.Characteristics and co-ordinates of sample sites. Co-ordinates Depth Salinity (m)
Median Organic BET-N2 grain size carbon specific (wt %) (µm) surface area (m-2 g-1)
Organic carbon (wt %)
Appels
51.02.43 N 04.05.37 E
0
0.7
4.8
63.5
2.29
2.48 a
Vliegertje
51.45.78 N 03.58.47 E
3
28
2.1-0.9
334
0.18
10.5 a, 12.3 a
Geul
51.44.22 N 03.58.13 E
13.5
28
1.4-1.1
210
0.31
6.9 a, 7.7 a, 2.9 a
Florence Rise
34.47.17 N 31.31.38 E
2300
38
25-40
Na
0.4
2.5 b
Eratosthenes 33.45.04 N Seamount 32.50.41 E
970
38
Na
Na
0.27
1.3 b
Organic carbon content of suspended particulate matter. At the Appels site this is the sediment collected in the sediment traps. Values at Vliegertje are for the fine and middle fraction respectively, at Geul values are for the fine, middle and coarse fraction. b Organic carbon content of the sapropel S1. Na = not available a
2.3.3.
Sediment characteristics
Total organic carbon was determined on freeze-dried and powdered sediment. Samples were combusted in a Carlo Erba Elemental Analyser NA-1500 after removal of carbonate with HCl in silver cups (Nieuwenhuize et al. 1994). Sediment specific surface area was measured on a surface area analyser (Quantachroom nova 3000 series) according to BET multipoint theory and using N2 5.0 as adsorbent. Sediment grainsize spectrum was determined using a Malvern Particle sizer 3600EC with laser diffraction.
✔✜
✫❋❖L◗❏✄❘I✄L❘◗✄❉◗G✄P❉◗❏❉◗❍❍✄L◗✄I❍❑❉❍✎ ❍❉L◗❍✄❉◗G✄G❍❍❙✄❍❉✄❍GLP❍◗
fraction and a heavy fraction which is composed of coarse more sandy material (Vliegertje only middle and light). Differences among the size / density fractions (3 in Geul, 2 in Vliegertje) may give additional qualitative information (e.g. Middelburg and Nieuwenhuize 1998). Hereafter we will refer to the different fractions as fine, middle and coarse for the light, intermediate and heavy fraction respectively.
✩✄❋❘P❙❉L❘◗✄❘I✄L❘◗✄❘LG❍✄❍❉❋LL✄L❑L◗✄❉◗G✄❊❍❍❍◗✄❉❚❉L❋✄❍GLP❍◗
2.3.4.
Sampling & slicing
Sediments were (sub)sampled with Plexiglas cores. After sampling cores were cut in appropriate slices (0.25 - 4 cm thickness). These were put in gastight plastic bags, flushed with nitrogen, sealed and kept at 4oC until further handling, i.e. porewater collection or solid phase extraction. Parallel samples were freeze dried for determination of water content and for use in total destruction. Porosity was calculated from water content assuming a sediment dry density of 2.5 g cm-3. Concentrations of dissolved Fe (II) and dissolved Mn (II) were measured in porewater collected from the sliced profiles. To this end the bags were transferred into an anaerobic chamber (Coy Laboratory Products) filled with > 97 % N2 and < 3% H2. Sediment of Appels was transferred to tubes and centrifuged (for 15-30 minutes at ~ 355 G). A modification of the system for sandy sediments (Saager et al. 1990) was used for porewater collection in Vliegertje (15 min, at 355 G), these samples were taken February 1999. No porewater was collected in Geul sediments. After centrifugation, porewater was filtered over a 0.45 µm cellulose-acetate filter and a 2 ml portion was put in headspace vials, capped and acidified with 0.1 ml 20 % H2SO4. Porewater collection of the Mediterranean sediments was as follows. Subcores were sliced at in-situ temperature (13°C) in a nitrogen-filled glovebox immediately after collection. Porewater was collected by centrifugation of sediment in disposable polypropylene tubes (15 min., 4400 G) and subsequent filtration of the overlying water (Acrodisc polysulfone filters, 0.2 µm). All pore water samples were split into several portions under nitrogen. Sub-samples for Fe and Mn analyses were acidified to pH 1 (with 12 M HCl). 2.3.5.
Solid-phase extractions
A number of extractions were used to characterise the pools of iron oxides. Ascorbate extractions were performed in an anaerobic chamber (Coy Laboratory Products) filled with > 97 % N2 and < 3 % H2. The pool of easy reducible Fe (III) oxides (Feasc) was extracted using ~ 0.3 g wet sediment and 5 ml of an anaerobic solution of 10 g sodium citrate, 10 g sodium bicarbonate and 4 g ascorbic acid in 200 ml demineralised water (Kostka and Luther 1994). The extraction lasted about 24 hrs and the samples were continuously shaken in the dark. After filtration (0.45 µm cellulose acetate filter) iron concentrations were analysed in the filtrate. The amorphous iron extracted with this method is considered the most reactive part of the total sediment iron pool.
✕�
2.3.6.
Analyses
The ferrozine method (Stookey 1970) was used to determine iron concentrations in ascorbic acid, dithionite and kinetic extractions of Vliegertje 1999 and Geul 1999. In all other samples, Fe, Mn and Al was analysed with an Inductively Coupled Plasma – Optical Electron Spectrometry (ICP-OES) (Perkin-Elmer Optima 330 DV, using axial or radial views depending on concentration levels). Diluted pore water samples (10x) of Mediterranean sediments were analysed for total Fe and Mn in Utrecht using a Perkin Elmer 4100 ZL Zeeman AAS. All samples were analysed in triplicate. Precision was generally better than 5% for Fe and 4% for Mn (Slomp et al. 2002). Pore water O2 and HS- were measured simultaneously with a gold amalgam voltametric micro-electrode (Brendel and Luther 1995) inserted in whole cores taken from the Mediterranean Sea and from Lake Grevelingen in February 1999. An elaborate description of this method can be found in Brendel and Luther 1995 and Luther et al. 1998. 2.3.7.
Kinetic approach
All kinetic experiments were also conducted in the anaerobic chamber. A 20 mM anaerobic ascorbate solution (250 ml) was used and stirred continuously. Before and directly after sediment addition a 4 ml slurry sample was taken with a syringe and filtered (0.45 µm filter cellulose-acetate). More than 25 samples were taken during each kinetic experiment lasting for about 4.5 hours, with 5 minute intervals in the first hour and up to 30 minutes during the last hour. Iron concentration was measured by either the ferrozine method or ICP-OES (see: Analyses). Postma 1993 showed that there should be excess ascorbate in order to ensure that all sorption sites of iron oxides are occupied, so slight differences in ascorbate concentration or sample weight are not expected to alter results. The total mass ( m0 ) of reactive
✕✔
✫❋❖L◗❏✄❘I✄L❘◗✄❉◗G✄P❉◗❏❉◗❍❍✄L◗✄I❍❑❉❍✎ ❍❉L◗❍✄❉◗G✄G❍❍❙✄❍❉✄❍GLP❍◗
Dithionite extractable iron (Fedith) is known to comprise amorphous iron (III) oxides, crystalline iron (III) oxides and the pool of iron bound to acid volatile sulfides (FeS) (Canfield 1989). Leachant (5 ml, 0.35 M acetic acid/0.2M Na-citrate solution 50 g l-1 dithionite) was added to ca. 0.3 gwet sediment. After 2 hours shaking, samples were filtered over a 0.45 µm filter (cellulose-acetate) and the filtrate was acidified with 0.1 ml 6 N HCl / ml filtrate. The pool of total sediment iron (Fetotal) was measured in freeze-dried and powdered sediment. The method used HNO3/HCl as destructant, a microwave for high temperature and a pressure digester (Nieuwenhuize et al. 1991).
✩✄❋❘P❙❉L❘◗✄❘I✄L❘◗✄❘LG❍✄❍❉❋LL✄L❑L◗✄❉◗G✄❊❍❍❍◗✄❉❚❉L❋✄❍GLP❍◗
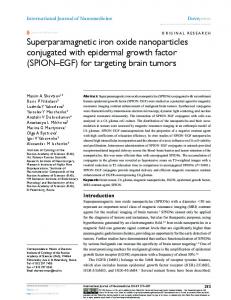
iron oxides was determined by dithionite extraction of the same sediment samples. The time evolution, during this extraction, of dissolved iron, normalised over the total mass of reactive iron oxides, is the basis of the reactive continuum approach (see Fig. 1 for an example). The interpretation of the kinetic experimental data involves fitting the time evolution of the solid phase iron fraction ( m m0 ) with eq. (1) v m a = m0 a + t
(1)
Where m is the concentration of reactive iron (mol) at time t , m0 is the initial concentration of reactive iron (mol) and a and v are curve fitting parameters that have been derived by non-linear regression using STATISTICA.
Fig. 1: Time evolution of reactive iron disslution in an estuarine surface sediment (Vliegertje, 0-0.25 cm depth)) during the ascorbate extraction used in the reactive continuum approach. m m0 is the mass of solid phase reactive iron oxides, normalised over the initial pool of solid phase reactive iron oxides, that is left at time, t (seconds) of the extraction period.
Equation 1 is based on a Gamma type reactive continuum distribution (Boudreau and Ruddick 1991) and can be rearranged (Postma 1993) to derive an expression for the rate of iron-oxide reduction ( J , mol s-1 ) normalised to the initial concentration of reactive iron, eq.(2).
✕✕
1+ vm v a m0
(2)
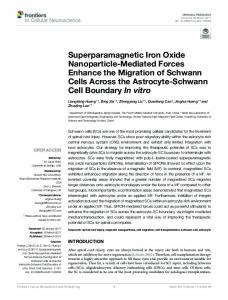
Where the exponent ( 1 + 1 v ) provides a measure of the degree of heterogeneity of the oxides undergoing reduction and ( v a ) is an apparent rate constant for a mixture. Eq. 2 is very similar to the general rate expression for dissolution of minerals under constant solution composition (Christoffersen and Christoffersen 1976), eq. 3. m y J (3) = k′ ⋅ m0 m0 Where k′ is a pseudo initial rate constant and y is an exponent. Rate equations based on eq. 2 or 3 can be displayed in terms of -log J m0 vs. log (m m0) . Such plots will result in straight lines with the slope corresponding to ( 1 + 1 v ) or its equivalent y , and the intercept at -log (m m0) equals the initial rate constant ( v a ) or its equivalent k′ . This type of plots (Fig. 2) facilitates comparison among sediments (Fig. 2a) and between sediments and pure minerals (Fig. 2b).
(
2.4.
Results
2.4.1.
Sediment properties
)
Sediment characteristics are summarised in Table 1. Appels is a tidal freshwater site flooded twice a day, with fine sediments. The high organic carbon content is due to the high organic carbon input by benthic algae and by particulate organic carbon supplied from the river Scheldt and from the vegetated marsh adjacent to the flat. The material collected in the sediment trap, likely reworked during flooding, had an organic carbon concentration similar to that of the top 2 cm of the sediment profile. Both subtidal estuarine sites are located in Lake Grevelingen (The Netherlands). Vliegertje is a sandy littoral site situated on a plain. The sediment has a low organic carbon concentration. The BET-N2 surface area was only high in the thin top layer and decreased to about 1 m2 g-1 at 0.25-0.5 cm. The site is prone to erosion and little sediment accumulation occurs.
✕✖
✫❋❖L◗❏✄❘I✄L❘◗✄❉◗G✄P❉◗❏❉◗❍❍✄L◗✄I❍❑❉❍✎ ❍❉L◗❍✄❉◗G✄G❍❍❙✄❍❉✄❍GLP❍◗
1
J = m0
✩✄❋❘P❙❉L❘◗✄❘I✄L❘◗✄❘LG❍✄❍❉❋LL✄L❑L◗✄❉◗G✄❊❍❍❍◗✄❉❚❉L❋✄❍GLP❍◗
Fig. 2a
Fig. 2b
Fig. 2c-I
Fig. 2c-II
Fig. 2c-III
Fig. 2: -log J m0 vs. –log m m0 , with values of the x-axis representing the fraction of reactive iron oxides which are not dissolved normalised over the initial pool of reactive iron oxides and the numbers on the y-axis indicate the change in initial reactivity of the dissoluting iron oxide fractions during the extraction. a. samples from Vliegertje (dotted lines), Geul (dashed-dotted lines), Appels (solid lines). b. literature data from Postma (1993, data from two sandy sediments, a mud sediment and ferrihydrite; all solid lines), Larsen & Postma (2001, all other pure iron oxide data; dotted and dashed-dotted lines), Roden (2002, data from a surface sediment; solid line). c. Depth profiles of k′ (s-1) and y , I. Appels:. II. Vliegertje and III. Geul: data 1999: k′ - open squares, y - crosses , data 2000: k′ - open circles, y - open diamonds. Note the logarithmic scale for the k′ data.
✕✗
2.4.2.
Porewater and iron extraction profiles
Dissolved porewater Fe (II) concentrations (Fig. 3) of Appels are rather uniform (150-200 µM) throughout the profile, except for the top-layer (ca. 350 µM).
✕✘
✫❋❖L◗❏✄❘I✄L❘◗✄❉◗G✄P❉◗❏❉◗❍❍✄L◗✄I❍❑❉❍✎ ❍❉L◗❍✄❉◗G✄G❍❍❙✄❍❉✄❍GLP❍◗
Geul is situated in a gully. The sediment grain size was significantly (p