Jul 7, 2007 - exceed pre-specified threshold values, the Norwegian Food .... resting state (a cyst) that falls to the ocean floor (Anderson et al., 1984; Marasovic, ...... 11http://www.pmel.noaa.gov/foci/GEM/alaska_ferry/GEM_ferry.html ...... Status and plans for satellite ocean-colour missions: considerations for comple-.
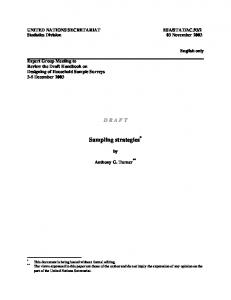
2 Interdisciplinary sampling strategies for detection and characterization of harmful algal blooms G. C. Chang and T. D. Dickey
.
Introduction
Many harmful algal blooms (HABs) are marked by the presence of toxic or noxious algae that result in a negative impact on human activities. Mass mortalities of fish and shellfish (farmed and natural), decreases in fecundity in fish, and death of marine mammals and birds have been reported as a result of the consumption of toxic algae. Transfer of toxins through the food web may also lead to human illnesses (Anderson et al., 2001, Table 1.1; Cullen, 2007, Table 1.1). Harmful algal species can also have deleterious effects on ecology without producing toxins, e.g. mucilage-producing or spine-bearing species that clog or damage gills of fish and other invertebrates (Zingone and Enevoldsen, 2000) and large blooms that cause hypoxia or anoxia – as HABs decline and biomass decays – leading to fish kills (Horner et al., 1997). These problems often result in extreme economic losses in coastal regions, affecting the fish and shellfish industries, aquaculture and tourism. It was once thought that HABs were small, localized problems but recent evidence suggests that these phenomena occur in nearly every coastal region throughout the world (Anderson, 1995). Despite the increasing occurrences of HABs and the escalating number of affected resources, existing detection and prediction techniques are limited and many present-day monitoring efforts are time intensive and/or costly. Most current HAB monitoring programmes are not designed to focus on understanding the environmental or anthropogenic conditions that contribute to the formation and cessation of HABs. Consequently, they have limited potential for prediction. This is changing through the establishment of HAB research programmes. 2.1.1
Examples of HAB programmes
Since 1992, the California Department of Health Services (CDHS) has enlisted the help of more than 20 research institutions to collect water samples along the California coast on a weekly basis. These water samples are then shipped to the CDHS in northern California for laboratory analyses (species identification, cell concentration, chemical analyses, etc.). The CDHS then compiles the data and releases Monthly Biotoxin Reports (e.g. CDHS, 2001) that describe the health of California’s coastal waters. Several other coastal regions worldwide have implemented HAB sampling programmes similar to that of the CDHS (e.g. Harmful Algal Bloom Initiation and Prediction in 43
c02.indd 43
7/7/07 11:38:35 AM
Habwatch
Large European Marine Ecosystems (HABILE) in the North Sea, Fisheries & Oceans Canada, South Carolina Task Group on Harmful Algae; see Anderson et al., 2001). Some other monitoring programmes enlist volunteer fishermen, beachgoers and/ or trained citizens to report any signs of HAB formation to responsible authorities (e.g. University of Maine Red Tide Monitoring Network; the ‘fish farm observation network’ in Norway; Johnson and Sakshaug, 2000; Kawaga fish culture monitoring in Japan; and Chilean Salmon Farmer’s Association; Anderson et al., 2001). This method has reduced human consumption of toxic organisms and provides educational outreach to the local community, but does not advance research on the scientific problem of HAB formation. HAB monitoring efforts such as the CDHS or the fish farm observation network, although detail-oriented, accurate and relatively low-cost, may ignore shorter-lived or small-scale, patchy HABs. HABs can persist for as short as a few days to as long as several months and can exist in spatial domains of a few metres to coastwide. Spatio-temporal irregularity in observations can lead to aliases in sampling and misinterpretation of results, that is overlooked HABs. Importantly, these programmes are not intended to predict, characterize, or mitigate HABs. Recent coastal ecology research efforts have been aimed at characterizing HABs and the causes of their formation, persistence and termination. The US Ecology and Oceanography of Harmful Algal Blooms (ECOHAB) programme has generally been directed towards studies of specific harmful algal species in an oceanographic context. The US Monitoring and Event Response for Harmful Algal Blooms (MERHAB) programme is designed for research and regional intensive monitoring of HABs. Its current projects, in the Pacific Northwest (Olympic Region HAB, ORHAB), Maryland and Florida, show promise for the development of state-of-the-art HAB monitoring networks, prediction and early warning of events to the local community. Johnsen and Sakshaug (2000) describe a HAB monitoring programme along the Norwegian coast that uses a network of observers in addition to moored buoys (SEAWATCH) that provide continuous time series of bio-optical, biological, chemical and physical parameters. When a potential bloom is detected by the buoy system, that is when certain properties exceed pre-specified threshold values, the Norwegian Food Hygiene Control Authorities are informed and complementary ship-based sampling is conducted. This monitoring and research programme has proved useful for advance public warning of HABs and provided information regarding the environmental conditions leading to HABs along the Norwegian coast. In Japan, government-sponsored monitoring and research programmes resulted in greatly increased understanding of the causes of formation of HABs in the Seto Inland Sea (see Section 2.2.3; Murakawa, 1987; Okaichi, 1989). On-going HAB monitoring programmes can benefit from augmentation with real-time autonomous sampling systems on a wide variety of spatial and temporal scales. In this chapter we argue that it is necessary to develop, verify, and implement longterm interdisciplinary HAB monitoring programmes that collect physical, bio-optical, biological and chemical data on timescales as short as a few hours and on spatial scales from metres to coast-wide. These data should be accessible in (near) real-time and alert researchers and responsible authorities to the possibility of HAB formation, specifically when key HAB parameters exceed specified threshold values. The programme should also allow for adaptive sampling (see review by Robinson and Glenn, 1999), specifically changing sampling locations and changing sampling rates using two-way data communication during periods of HAB formation, persistence and cessation. This is especially important because scales of interdisciplinary sampling are dependent on the
44
c02.indd 44
7/7/07 11:38:36 AM
Interdisciplinary sampling strategies for detection and characterization
HAB species as well as regional ecology (Cullen, 2007 – Chapter 1 this volume). These new techniques would complement existing detail-oriented HAB monitoring efforts such as those conducted by the CDHS, providing shorter temporal scale measurements on a wide range of spatial domains and more timely and adaptive sampling strategies. The purpose of this chapter is to motivate the use of interdisciplinary, autonomous sampling strategies for HAB studies. We first briefly review some of the physical, chemical and biological oceanographic processes that can affect the formation, persistence and cessation of HABs and include some examples of HAB studies relating to these disciplines. We then summarize sensor and system technologies relevant to HAB detection and characterization. Lastly, we suggest new sampling strategies for future HAB research and monitoring programmes.
.
Processes in the coastal ocean
2.2.1
Physical processes
Time-series data and extensive spatial observations of physical oceanographic parameters enable the identification of some of the major forcing factors affecting the formation, persistence and cessation of HABs in the coastal ocean (Figure 2.1; also see Franks, Chapter 15). The timescales of variability for these forcing factors can vary from minutes (e.g. turbulence and internal solitary waves) to hours (e.g. tidal and inertial processes) to days and months (e.g. upwelling and fronts) and longer (e.g. El Niño and the North Atlantic Oscillation). Spatial scales are equally wide-ranging, from metre-scale processes or smaller (bioturbation) to basin-wide (El Niño) to global scales (air/sea interaction and the hydrologic cycle; Figure 2.1). Small-scale physical phenomena are generally dominated by turbulence, which affects molecular and cellular-scale processes. Diel cycles of solar insolation and tidal frequencies (diurnal and semi-diurnal) often control variability of various physical, bio-optical and chemical parameters (Figure 2.2; Stramska and Dickey, 1992; Abbott et al., 1995; Chang and Dickey, 2001; Chang et al., 2002). Solar insolation influences radiant heating rates of the upper ocean (e.g. Lewis et al., 1983, 1990; Ohlmann et al., 2000; Ohlmann and Siegel, 2000; Chang and Dickey, 2004), and thus affects stratification and the vertical movement of nutrients, phytoplankton and their grazers. Tidal processes, in addition to surface and internal gravity and solitary waves (e.g. Bogucki et al., 1997), can vertically redistribute phytoplankton with respect to the light field, nutrients and grazers (Kamykowski, 1974). Many important processes are quasi-periodic and episodic, occurring at scales of days to months and tens of metres to thousands of kilometres. Inertial and other periodic oscillations are often caused by wind events, for example storms and hurricanes (Figure 2.3; Dickey et al., 1998a; Chang et al., 2001). These oscillations act similarly to tidal processes and have been reported to pump nutrients from below the mixed layer into the euphotic zone where they can be used by phytoplankton (McNeil et al., 1999). Persistent winds influence upwelling and downwelling and hence nutrient availability, which is often seasonally important to coast-wide and regional ecology and HABs (see Section 2.2.4). Mesoscale features (scales of days to months and tens of kilometres) include, but are not limited to, fronts (Barth et al., 1998, Figure 2.4), jets (Chang et al., 2002) and eddies (e.g. McNeil et al., 1999). These physical processes can enhance or inhibit nutrient
45
c02.indd 45
7/7/07 11:38:37 AM
Habwatch
Figure 2.1 Time-space diagram illustrating some of the processes that are important for harmful algal blooms. Source: modified from Dickey (1991).
and particulate movement and hence phytoplankton bloom formation and termination (Franks, 2007 – Chapter 15 this volume). Longer-term and larger-scale physical forcing associated with equatorial processes (El Niño-Southern Oscillation – ENSO; e.g. Chavez et al., 2002) and other decadal-scale processes around the earth (North Atlantic Oscillation, NAO; Pacific Decadal Oscillation, PDO; and others) can also have impacts on the coastal ocean through alterations of ocean-atmosphere interactions and nutrient and light availability. Some examples of studies that have investigated physical processes and their roles in HABs follow. Tester and Steidinger (1997) found that blooms of the toxic dinoflagellate, Karenia brevis (formerly Gymnodinium breve; neurotoxic shellfish poisoning; e.g. Anderson, 1995), on the West Florida Shelf (WFS) are closely coupled with physical processes. Shoreward movements of the Gulf of Mexico Loop Current or spin-offs of eddies from the Loop Current often trigger K. brevis blooms on timescales of days to weeks, covering much of the eastern Gulf of Mexico. Stumpf et al. (2003) use ocean-colour imagery to monitor the occurrence and presence of these blooms. These HABs tend to accumulate and grow at a persistent mid-shelf convergence front that is maintained by seasonal winds along the west Florida coast. Gulf of Mexico eddy 46
c02.indd 46
7/7/07 11:38:37 AM
Interdisciplinary sampling strategies for detection and characterization
Figure 2.2 Frequency power spectral density functions (PSDs) of A, 20 m temperature; B, 5 m chlorophyll a concentration, an indicator of phytoplankton; C, 5 m beam attenuation data, a proxy for particles, collected off the coast of New Jersey in 24 m water depth. O1, diurnal tidal; M2, semidiurnal tidal; I, inertial; D, diel frequencies. The cyan lines represent the 95% confidence intervals. This figure shows that diel and tidal oscillations can dominate both physical and particulate processes.
circulation affects bloom retention and distribution, and the Florida Current and Gulf Stream act to transport the K. brevis blooms out of the WFS region. It is thought that decreasing water temperatures may also contribute to cessation of blooms of the warmwater species, K. brevis. Coastal buoyant plumes have been found to be responsible for the transport of Alexandrium tamarense in the south-western Gulf of Maine (Keafer and Anderson, 1991). A. tamarense is a toxic dinoflagellate, found to produce biotoxins and result in paralytic shellfish poisoning syndrome (e.g. Anderson, 1995). Keafer and Anderson (1991) used sea surface temperature (SST), estimated from remotely sensed imagery, to track a warm coastal plume that formed from spring runoff. This buoyant plume was found to be responsible for the southerly transport of A. tamarense along the east coast of the US springtime coastal upwelling then shifted the plume of warmer water containing A. tamarense offshore. This study by Keafer and Anderson (1991) demonstrates the utility of large-scale, remotely sensed SST data for HAB characterization and monitoring (see Section 2.3.2). Lindahl (1986) found a correlation between high-salinity plumes of Skagerrak (northern European) waters and blooms of the toxic dinoflagellate Gymnodinium mikimotoi (formerly Gyrodinium aureolum) on the west coast of Scandinavia. Lindahl (1986) hypothesized that G. mikimotoi blooms offshore and is transported towards the coast by wind-induced currents and convergent flows. These examples illustrate the need for high temporal and spatial resolution and judiciously placed physical instrumentation for understanding HAB dynamics in a coastal region. 2.2.2
Biological processes
The growth of harmful algae generally has two principal requirements: nutrients and light. Nutrient uptake and light adaptation in phytoplankton take place on timescales 47
c02.indd 47
7/7/07 11:38:43 AM
Habwatch
Figure 2.3 Time series of A, current velocity at 0.38 mab above the ocean bottom (ucx⫽ east-west currents, ucy⫽ north-south currents); B, beam attenuation coefficient at 2 mab (660 nm); C, chlorophyll a concentration at 2 mab during the passages of Hurricanes Edouard (2 September) and Hortense (14 September; E and H respectively) during autumn 1996. These data show (A) storm-induced oscillations and intense mixing followed by (B and C) resuspension of sediments and relict pigments. All data were collected on a mooring off the coast of Cape Cod, Massachusetts, in 70 m water depth.
of hours to days and are generally more spatially important in the vertical direction, that is with depth of the water column. The observations and sampling of biological parameters are focused on phytoplankton behaviour (e.g. motility), physiology (nutrient uptake) and grazing pressures. Many harmful algae are dinoflagellates, which have been observed to be adapted to decaying turbulence and thus tend to bloom during well-stratified, quiescent waters. However, dinoflagellates are biophysically adapted for swimming, allowing this particular phytoplankton group to perhaps avoid or dampen turbulence and vertically migrate (Smayda, 1997; 2002). Also, some toxic dinoflagellates species form from a resting state (a cyst) that falls to the ocean floor (Anderson et al., 1984; Marasovic, 1989; Nagai et al., 2003). This allows the dinoflagellates to lay dormant when chemical conditions are not optimal for their growth. When nutrients are in abundance or when triggered by internal biorhythms, the algae return to the water column as 48
c02.indd 48
7/7/07 11:38:46 AM
Interdisciplinary sampling strategies for detection and characterization
Figure 2.4 A, time-series contour plot of chlorophyll a concentration. The increase on Year Day 239 (26 August 1996) was due to convergence of phytoplankton at a shelf-slope front just south of Martha’s Vineyard, Cape Cod, Mass. B, phytoplankton absorption spectra deconvolved from in situ optical measurements of the total absorption coefficient (following Roesler et al., 1989) during ‘normal’ conditions (red pluses) and during an intrusion of a shelf-slope front (blue circles), indicating an increase of diatoms. Diatoms can be discerned from other phytoplankton species by their marker pigment, fucoxanthin, which has a peak in phytoplankton absorption at about 450–470 nm (Jeffrey et al., 1997). Data were obtained on a mooring in 70 m water depth.
phytoplankton (Burkholder and Glasgow, 1997; Donaghay and Osborn, 1997). Cysts can also be resuspended off of the ocean floor through physical forcing (high currents and/or waves; Figure 2.3). The vertical movement of phytoplankton, e.g. diel vertical migration, can be observed using stationary, high temporal and vertical resolution measurement platforms (see Section 2.3.1; Kerfoot et al., 2002; Figure 2.5). Harmful algal species may out-compete other phytoplankton with their ability to adapt and compete for nutrients other than the macronutrients: nitrate, ammonium or phosphate. Dzurica et al. (1989) found that Aureococcus anophageff erens is capable of using glutamic acid and glucose for carbon and energy sources. Maldonado et al. (2002) examined the influence of micronutrient (iron and copper) uptake on the toxicity of cultured diatoms, Pseudo-nitzschia multiseries and Pseudo-nitzschia australis 49
c02.indd 49
7/7/07 11:38:52 AM
Habwatch
Figure 2.5 Time-series contour plot of A, absorption coefficient; B, attenuation coefficient at 676 nm, measured by an absorption-attenuation meter (ac-9) deployed on a moored vertical profiler. Vertical migration (positive phototaxis) of phytoplankton is well illustrated in these figures; phytoplankton swim towards the sunlight during the daylight hours and migrate towards the ocean bottom during the night. Water samples indicate that dinoflagellates were present. Source: courtesy of John Kerfoot and Oscar Schofield, Rutgers University.
(for further details see Section 2.2.3). In situ observations of P. australis blooms in Monterey Bay, California, showed that this toxic species bloomed in waters low in iron, suggesting that P. australis may sequester iron from other species.7 These measurements were obtained using high spatial resolution platforms carrying interdisciplinary sampling devices (see Section 2.3). Interactions between phytoplankton species (toxic with non-toxic) and harmful algae with grazers (e.g. zooplankton) are situation-specific (e.g. Turner and Tester, 1997; Cullen et al., 2002). Attempts have been made to generalize phytoplankton species succession prior to and following HABs (the ‘Mandala’ from Margalef et al., 7
Data not yet published: see http://www.mbari.org/MUSE/intro.htm
50
c02.indd 50
7/7/07 11:38:59 AM
Interdisciplinary sampling strategies for detection and characterization
1979; see Cullen, 2007 – Chapter 1 this volume) and grazing stresses on HABs. This type of broad overview, although by and large informative, is not applicable to all phytoplankton blooms or all HABs. Quantification of phytoplankton community composition variability must be accomplished using long-term, continuous monitoring efforts.
2.2.3
Chemical processes
Both physical and biological processes influence variability in ocean chemistry. Coastal ocean chemistry is primarily driven by input of ‘new’ nutrients rather than recycling, as in the open ocean (e.g. Mann and Lazier, 1991). New nutrients are introduced to the system through physical forcing (upwelling, advection, resuspension, river outflows, etc.) that occurs on spatio-temporal scales of tens of metres to coast-wide and days to months. Recycled nutrients are generally contributed through biological means (exudation, ‘sloppy feeding’, benthic regeneration, etc.), which occur on timescales of hours to months. For example, HABs of Karenia brevis may be triggered by nitrogen-fi xing cyanophytes, which bloom during natural iron enrichment through Saharan dust deposition (Walsh and Steidinger, 2001). Many attribute the occurrences of HABs to nutrient loading and coastal eutrophication (e.g. Parsons et al., 2002). The nutrient loading has been blamed on human population growth and increased pollution to coastal waters. Some commonly cited examples are Tolo Harbour in Hong Kong and the Seto Inland Sea of Japan. In Tolo Harbour, red-tide events had grown almost 8-fold while human population had increased almost 6-fold over a 10-year period in the 1970s and 1980s (Lam and Ho, 1989). A similar discovery was made in the Seto Inland Sea, Japan, where observed red tides increased from 44 per year in 1965 to over 300 in the 1970s, parallel with human population growth in the region. These HABs in the Seto Inland Sea of Japan were attributed to nutrient loading from pollution (Murakawa, 1987). The Japanese Government has since issued controls on effluents in the area and red-tide events have decreased by 50% over two decades (Anderson, 1995). Population growth can also increase atmospheric deposition and groundwater discharge to coastal areas. These are potential sources of new nitrogen and micronutrients, e.g. trace metals, for the development of HABs (Paerl, 1997). It is essential for coastal ecological studies to incorporate judiciously placed chemical measurements for the quantification of nutrients important to HAB species (see Section 2.3.1). During low nitrogen or extremely elevated phosphorus conditions, blooms of nitrogen-fi xing cyanobacteria may dominate a coastal region (Sellner, 1997). In the Baltic Sea and along the coast of Finland, low nitrogen concentrations in the summer followed by phosphorus enrichment through upwelling, intrusions or eddy-induced mixing often leads to the development of Nodularia blooms (Sellner, 1997). Lukatelich and McComb (1986) have observed similar blooms in Australian estuaries that are directly related to enhanced phosphorous through river flows. Again, blooms of Karenia brevis may be associated with nitrogen-fi xing cyanophytes (Walsh and Steidinger, 2001). Although marine cyanobacteria blooms are rarely toxic, they produce extremely high amounts of biomass (nuisance blooms) and have been linked with salmon pen liver diseases (Codd, 2001). Also, toxic Nodularia and Aphanizomenon species may reduce planktonic herbivory and bacterial community development (Sellner, 1997). See Bianchi et al. (2000) for the history and characteristics of the formation 51
c02.indd 51
7/7/07 11:39:05 AM
Habwatch
of blooms of nitrogen-fi xing cyanobacteria in the Baltic Sea (also discussed in Cullen, 2007 – Chapter 1 this volume). Maldonado et al. (2002) studied the effects of trace metals iron (Fe) and copper (Cu) on the growth and toxin production in diatoms, Pseudo-nitzschia multiseries and Pseudo-nitzschia australis. They found that iron limitation and copper toxicity directly inhibited the growth rates of these species. Domoic acid production increased by about 8-fold from optimal to Fe-limited conditions and by about 20-fold from optimal to Cu-stressed conditions. Iron uptake rates increased 3-fold when iron was added to an optimal growth system. Importantly, 95% of produced domoic acid was released into the surrounding aquatic medium, which suggests that trace metals and other micronutrients can have a strong influence on the toxicity of HABs (Maldonado et al., 2002). 2.2.4 Interactions between physical, biological and chemical processes Physical, chemical and biological processes operate in concert and result in cascades of energy (variability) to both smaller and larger time and space scales (Dickey, 1991, 2003; Figure 2.1). For example, Pacific Ocean-wide El Niño events impact continental shelf nutrient dynamics on the west coasts of North and South America, particularly during boreal springtime upwelling. Internal solitary waves, which occur on timescales of minutes, can influence the vertical movement of particles (Figure 2.6) and nutrients and hence, phytoplankton blooms on temporal scales of days to months (Bogucki et al., 1997; Chang and Dickey, 1998). Coastal phenomena such as upwelling and freshwater plumes and their influences on HABs are highly dynamic in nature, emphasizing the need for careful design of interdisciplinary coastal monitoring efforts in terms of sensors, platforms and spatio-temporal scales (see Section 2.4.1). Some examples of interdisciplinary HAB-related processes follow. Coastal upwelling regions are highly productive areas of the world’s oceans, often supporting HAB species. Meteorological, physical, chemical and biological processes at variable scales all play crucial roles in HAB formation caused by upwelling. For example, along the west coast of the US, northerly winds typically prevail in the spring and early summer. The increase in nutrients to well-lit surface waters from upwelling stimulates primary production. In California waters, blooms directly following upwelling generally consist of non-toxic diatoms, followed by non-toxic dinoflagellates (Horner et al., 1997). Blooms of toxic species along the US west coast generally form when upwelling ceases or becomes sporadic, between May and October. It is hypothesized that HABs, nutrients or both build up at offshore frontal waters (e.g. Figure 2.4). During upwelling, a front can form to separate freshly upwelled waters from inshore waters. When upwelling relaxes, the cross-shelf flow can reverse direction and advect great concentrations of harmful algae onshore and into bays and inlets, resulting in a nearshore HAB or red tide (Donaghay and Osborn, 1997; Horner et al., 1997). Biophysically, many species of toxic or red-tide-forming dinoflagellates are intolerant to turbulence (Section 2.2.2; Smayda, 2000, 2002). Therefore, when upwelling ceases, nearshore waters can become stratified and conducive to HAB persistence. HAB formation as the result of relaxation of upwelling has been observed not only along the US west coast, but also off Peru, Spain and the west coast of Africa (Anderson, 1995). Pitcher et al. (1993) investigated the relationship between physical processes and the characteristics of red tides in the upwelling region of the Benguela Current, South Africa. Nuisance red tides in this region were coincident with seasonal upwelling, occurring from January to May when upwelling diminishes and stratification 52
c02.indd 52
7/7/07 11:39:05 AM
Interdisciplinary sampling strategies for detection and characterization
Figure 2.6 Time series of A, bandpassed filtered north-component current velocity measured by a moored acoustic Doppler current profiler; B, beam attenuation coefficient at 660 nm measured by a moored spectral absorption-attenuation meter (ac-9). The subscript pg denotes particulate plus gelbstoff. Data were measured at 52 m (70 m total water depth) between 21 and 24 August 1996 off the coast of Cape Cod, Mass. This figure illustrates the passage of internal solitary waves (ISWs; delineated and highlighted in red) and the subsequent movement of particulate matter. Note that vertical gradients in particulate matter are important; not all ISWs resulted in an increase in the optical signal.
increases, similar to processes occurring along the US west coast (Pitcher et al., 1993; Pitcher et al., 1998; Pitcher and Calder, 2000). Also parallel with California red tides, Pitcher and Calder (2000) show that South African frontal blooms are transported onshore under certain wind and current conditions to form red tides. Daily shipboard sampling of nearshore physical and biological parameters revealed that phytoplankton community composition in South African embayments is highly dependent on advective processes. Importantly, in regions where year-round upwelling is sporadic, smallscale HABs may form in situ when ideal nutrient conditions are met (e.g. coastal New Jersey; Moline et al., 2004). The physical, chemical and biological characteristics of upwelled water are altered during El Niño events, which occur approximately every three to four years and are largely unpredictable (e.g. Strutton and Chavez, 2000). Although the causes of 53
c02.indd 53
7/7/07 11:39:06 AM
Habwatch
El Niño are unknown, many of its effects impact phytoplankton species distribution and the distribution of higher trophic level organisms (Mann and Lazier, 1991). Strutton and Chavez (2000) observed extremely low phytoplankton biomass and productivity in the equatorial Pacific during the 1997–1998 El Niño, one of the strongest on record. Nitrate concentrations were low throughout the upper 100 m of the water column, resulting in chlorophyll concentrations that were less than half of the climatological mean. The effects of El Niño are also observed in eastern Pacific Ocean upwelling regions, which are highly productive areas of the world’s oceans. During El Niño, upwelled water along the North and South American west coasts is higher in temperature and lower in nutrients. Oftentimes, warm water harmful algal species flourish in the higher temperature surface waters that accompany El Niño events. Some attribute a Pseudo-nitzschia australis bloom and domoic acid event on the US Pacific coast in 1991 to El Niño (Horner et al., 1997). The eastward and northward movement of warm surface waters may have brought toxic diatoms to the US Pacific Northwest, where domoic acid was found in many marine organisms (Horner et al., 1997). Long-term, continuous monitoring efforts are necessary in order to capture these ecologically important, episodic events. HAB formation is greatly influenced by freshwater runoff into coastal areas in the form of riverine, groundwater, estuarine, or outfall flows. Freshwater plume characteristics are governed by physical processes and greatly influence coastal nutrient dynamics and hence, ecology. Most importantly, freshwater flows are a source of new macro- and micro- nutrients into the coastal ocean (e.g. Mann and Lazier, 1991). The lower salinity freshwater flow into seawater also forms a strong pycnocline and increases stratification of the water column, aiding in the retention of phytoplankton in the high-light surface waters. However, the change of hydrography towards warmer, lower-salinity waters is not conducive to the growth of some toxic phytoplankton species (e.g. Aureococcus anophageff erens; Cosper et al., 1989). Buoyancy-driven flows associated with freshwater flows (forced by the horizontal pressure gradient formed by the density difference) may act to advect competing plankton and nutrients to offshore waters, allowing the formation of HABs of phytoplankton species that are tolerant to lower nutrient, higher salinity conditions (e.g. Gymnodinium mikimotoi on the north-west European shelf; Lindahl, 1986). However, the turbulence created by buoyancy-driven flows may act to break down stratification, deepen the mixed layer and effectively decrease the light available for photosynthesis, thus inhibiting HAB development. Tidal mixing also generates a great deal of turbulence and sediment resuspension in the coastal ocean, decreasing the light available for phytoplankton utilization. On the other hand, the turbulence may resuspend nutrients from the ocean bottom and lead to the formation of phytoplankton blooms. In summary, coastal ocean processes are extremely complex; time and space scales of variability are relatively short; and forces act simultaneously, resulting in positive and negative feedbacks for primary production. . Sensor and system technologies r e l e va n t to H A B s HAB research must incorporate sensors and systems capable of sampling on multiple and appropriate time and space scales relevant to HAB formation, persistence and destruction (Figure 2.1). The use of a variety of complementary ocean observing
54
c02.indd 54
7/7/07 11:39:12 AM
Interdisciplinary sampling strategies for detection and characterization
platforms along with data-assimilation models can greatly improve our knowledge and capabilities for making predictions of upper ocean ecology and health of the ocean as well as HABs. Multiple platforms are necessary because of specific platform advantages and limitations (discussed below). Some challenges for monitoring and characterizing HABs are: the processes involved occur at several different spatio-temporal scales, are typical• ly nonlinear and coupled through several different multidisciplinary variables; physiological and behavioural aspects of oceanographic flora and fauna are • inconsistent and unpredictable; costs of doing oceanographic measurements from in situ platforms are relatively • high; the assimilation of interdisciplinary data into predictive models is in its infancy. • 2.3.1 Sensors related to HAB research 2.3.1.1
Physical sensors
In the past decade, many new instruments for measuring coastal ocean properties have been introduced (e.g. Dickey, 2002). Some of these sensors can be applied to HAB research. Physical instrumentation (e.g. current, temperature and conductivity sensors) has remained relatively unchanged with the exception of size, weight and power requirements and interfacing of instruments. Acoustical methods have been employed in more recently developed current meters (e.g. RD Instruments acoustic Doppler current profiler, ADCP), allowing for accurate, high vertical resolution measurements of current speed and direction (e.g. Dickey et al., 1998b). In addition, information about biology (zooplankton biomass and fish) can be inferred from the acoustical signals of these current meters (e.g. Smith et al., 1992; Holliday et al., 1989; Jiang et al., 2007; see Jaffe, Chapter 10 and references therein). High-frequency (HF) radar, e.g. coastal ocean dynamics applications radar (CODAR), has recently been developed for largescale spatial maps of surface currents. Short- or standard-range HF radar systems can cover roughly 50 km2 at a resolution of about 1.5 km (Figure 2.7). Long-range systems reach up to 100 km offshore. HF radar uses the Doppler shift principle to determine the surface current from a backscattered radio wave. 2.3.1.2
Optical sensors
Optical instrumentation has seen the largest expansion with regards to technological developments in oceanography (e.g. Dickey, 2001a, 2001b, 2002, Dickey and Chang, 2001, Chang et al., 2006b; Dickey et al., 2006). Up until about 30 years ago, in situ optical sensors were generally limited to the Secchi disk, a white disk 25 cm in diameter whose depth of disappearance is defined as the Secchi depth, and broadband scalar irradiance (E0) or PAR sensors (integrated scalar irradiance from 400–700 nm; see Lewis, 2007; Morel, 2007 – Chapters 6 and 4 this volume). Secchi disk and PAR sensors measure water column optical clarity from the ocean surface and photosynthetically available radiation (PAR), respectively. Although relatively simple, both measurements can provide important information regarding the occurrence of phytoplankton blooms, potentially HABs. For example, Falkowski and Wilson (1992) used a 90-year record of Secchi depth observations in the North Pacific Ocean to determine that small systematic increases in phytoplankton have occurred on the edges of the central ocean gyre, while the gyre core has
55
c02.indd 55
7/7/07 11:39:12 AM
Habwatch
Figure 2.7 Spatial map of surface current vectors (scale at upper left) derived from high-frequency radar measurements overlaid on satellite-derived sea surface temperature from 15 July 2004. The region shown is the Middle Atlantic Bight, US east coast (Long Island at top). Note the highly variable convergence and divergence zones in the current vectors. Source: courtesy of Josh Kohut and Oscar Schofield, Rutgers University.
undergone a small depletion of phytoplankton. Secchi depth has also provided more than 60 years of water clarity data; these data have been related to eutrophication and the formation of HABs in the Seto Inland Sea, Japan (Yanagi and Okaichi, 1997; also see Cullen et al., 1997). Sensors analogous to the PAR sensor use flat plate cosine or hemispherical collectors for different measurements or calculations of the apparent optical properties (AOPs; optical properties that depend on the constituents of the aquatic medium and the angular distribution of solar radiation; see Kirk (1994) or Mobley (1994) for definitions of optical properties; see Lewis (2007) and Morel (2007) – Chapters 6 and 4 this volume. Spectroradiometers are radiance and irradiance meters (e.g. Dickey, 2001b). Light separation for multispectral sensors is generally achieved using sets of interference filters (usually 10 nm bandwidth) at select wavelengths/wavebands for particular purposes, such as investigating absorption peaks and hinge points for pigment analyses or matching with satellite remote sensing wavelengths (e.g. Sea-viewing 56
c02.indd 56
7/7/07 11:39:13 AM
Interdisciplinary sampling strategies for detection and characterization
Wide Field-of-view Sensor, SeaWiFS; see Section 2.3.2). A hyperspectral sensor gives continuous spectral coverage over a broad wavelength range (at least over visible wavelengths), with better than 10 nm wavelength resolution (Chang et al., 2004). Inherent optical properties (IOPs; optical properties that depend only on the aquatic medium itself and are independent of the ambient light field and its geometrical distribution; see Roesler and Boss, 2007 – Chapter 5 this volume) are generally more difficult to measure than AOPs. One of the first IOP sensors to be used in oceanographic research was the beam transmissometer (Bartz et al., 1978). The principle of operation of a beam transmissometer involves the measurement of the proportion of an emitted beam that is lost through both absorption and scattering as it passes through a predetermined path length to a detector. Beam attenuation coefficient (beam c) is derived from beam transmissometer measurements. Beam c has been used to derive (harmful) algal biomass, suspended sediment volume, and concentrations of particulate organic carbon (POC) and productivity in the form of POC (e.g. Bishop, 1999; Dickey and Falkowski, 2002 and references therein). Within the past decade, in situ spectral absorption-attenuation meters have become commercially available (Moore et al., 1992; see Roesler and Boss, 2006 – Chapter 5 this volume). These instruments concurrently measure spectral absorption and attenuation coefficients at up to 90 wavelengths for spectral signatures of both particulate and dissolved material (WET Labs, Inc. ac-9 for nine wavelengths; Pegau and Zaneveld, 1993; Pegau et al., 1995, 1997; and WET Labs, Inc. ac-s for hyperspectral; Zaneveld et al., 2004; Chang et al., 2006b). Seawater is pumped through two tubes. The inside of the beam c tube (c-tube) is flat black to minimize reflections, whereas the absorption coefficient tube (a-tube) is reflective in order to maximize internal reflection to better estimate absorption. The spectral scattering coefficient is computed from ac-meter data by simply performing the difference b(λ) ⫽ c(λ) – a(λ). Absorptionattenuation meter data and spectral decomposition models can be used to provide in situ estimates of phytoplankton, detrital and gelbstoff absorption (Roesler et al., 1989; Bricaud and Stramski, 1990; Gallegos and Neale, 2002; Chang and Dickey, 1999; Schofield et al., 2004). Hyperspectral absorption-attenuation meters (ac-s) can in principle be used to isolate pigment peaks for HAB species identification (see Section 2.5.2; Millie et al., 1997; Kirkpatrick et al., 2000; Chang et al., 2004). Phytoplankton (HAB) biomass is often inferred from measurements of chlorophyll fluorescence (Babin, Chapter 7). In situ chlorophyll fluorometers generally employ stimulated fluorescence techniques, exciting phytoplankton with blue light and measuring its light emission in the red, for example excitation/emission (ex/em) wavelengths of, for example, 470/695 nm. Novel in situ fluorometers (e.g. WET Labs, Inc. ECOfl3) use different ex/em wavelengths to provide information on, for example CDOM (ex/em ⫽ 370/460 nm), fluorescein for dye tracer studies (ex/em ⫽ 470/530 nm), or phycoerythrin for red cyanobacteria concentration (ex/em ⫽ 540/570 nm). These new spectral fluorometers are relatively small and lightweight and are commercially available. Backscattering at several different wavelengths or angles can be measured using commercially available, operational instruments that are based on scattering theory and statistical relationships relating scattering at a given angle to the integral over the backward direction (Maffione and Dana, 1997; Boss and Pegau, 2001; see Roesler and Boss, 2007 – Chapter 5 this volume). Particle size distribution, mass concentration, shape and composition (biological versus detrital versus sediment) can be estimated with backscattering and scattering properties, and the ratio of 57
c02.indd 57
7/7/07 11:39:22 AM
Habwatch
backscattering to scattering (Ulloa et al., 1994; Twardowski et al., 2001; Babin et al., 2003; Boss et al., 2004a, 2004b; Roesler and Boss, 2007 – Chapter 5 this volume). In situ particle size distributions can also be measured using operational laser (Fraunhofer) diff raction instruments (Sequoia Scientific, Inc. LISST-100; Agrawal and Pottsmith, 1994). Modified versions of these instruments measure particlesettling velocities (Sequoia Scientific, Inc. LISST-ST), which are important for quantifying the vertical movement of phytoplankton. The backscattering and scattering properties of phytoplankton reveal information about cell size and index of refraction (Stramski et al., 2001), which can be used in conjunction with other IOP observations (absorption, scattering and attenuation coefficients) to provide details about in situ phytoplankton populations, for example composition, size, morphology and internal structure (Roesler and Boss, 2007 – Chapter 5 this volume). Th is additional information can help us understand more about the growth and distribution patterns of harmful algal species. Some HAB species are dinoflagellates that are bioluminescent, meaning that they produce light by a chemical reaction that originates in the organism (e.g. Case et al., 2001). These bioluminescent organisms can be detected in situ with bioluminescence sensors (Herren, 2002; Herren et al., 2004). These sensors usually pump water through a baffle, mechanically stimulating the organisms to generate bioluminescence. Optical sensors inside the instrument’s chamber then detect the amount of light produced by the organisms. Baffled bioluminescence instruments can operate 24 hours a day, although they are most effective at night, when most bioluminescent species are photoinhibited and reach peak bioluminescence intensities. A major limitation of in situ measurements of bioluminescence lies in the separation of phytoplankton bioluminescence signals; these signals can be confounded by bioluminescent bacteria, zooplankton, or jellyfish. The first generation of bioluminescence sensors were quite large (about the size of an automobile) and could only be used as shipboard samplers (Widder et al., 1993 and references therein). Currently, scientists and engineers are developing portable, lightweight, reduced-power and relatively low-cost optical sensors for oceanographic research. The movement towards smaller sensors coincides with the advancement of autonomous sampling platforms for high spatial and temporal resolution ocean monitoring (see Section 2.3.2). 2.3.1.3
Biological sensors
Many new biological sensors (instruments that measure biological quantities) that are currently transitioning to the operational phase rely on optical principles or techniques. Jaffe (2007 – Chapter 10 this volume) provides an extensive review of optical imaging of plankton. Another example of a biological sensor that employs optics is the flow cytometer. In the flow cytometer, several optical measurements are made as each particle in a water sample passes through a focused laser beam. Light-scattering signals provide information about the distributions of particle size and composition, while fluorescence data allow discrimination between phytoplankton and other particles and identification of major phytoplankton groups, e.g. Synechococcus, crytophytes and eukaryotes. Researchers are now deploying flow cytometers for rapid and quantitative measurements of individual suspended microscopic particles for cells in the size range 苲0.5–30 μm (Olson et al., 1991; Olson et al., 1993; Vaulot et al., 1995; Vaulot and Marie 1999; Reckermann and Colijn, 2000; Li and Dickie, 2001). Time series of flow 58
c02.indd 58
7/7/07 11:39:22 AM
Interdisciplinary sampling strategies for detection and characterization
cytometric measurements have contributed to a greater understanding of phytoplankton species succession (Olson et al., 1990; DuRand et al., 2001; Li and Dickie, 2001) and growth processes (DuRand and Olson, 1998; Shalapyonok et al., 1998; André et al., 1999; Jacquet et al., 2001; Shalapyonok et al., 2001; Sosik et al., 2003), which have important implications for HAB research. Other types of biological sensors that are gaining considerable interest for HAB research are molecular, e.g. deoxyribonucleic acid (DNA), probes (Scholin et al., 2007 – Chapter 11 this volume). Previous molecular analyses of HABs involved several days of cell preparation and high-powered electron microscopy analyses to identify toxic algae. With the advent of in situ molecular probes, HAB species can be determined within 4 h of seawater sample collection. These probes can sequence the DNA of a selected phytoplankton and compare its genetic code sequence of nucleotides with that of other related algae. Scholin et al. (1998) are currently developing real-time HAB data collection methods using DNA probes on moorings. More information about molecular probes for HAB research can be found in Scholin et al. (Chapter 11). 2.3.1.4
Chemical sensors
Chemical measurements have greatly improved with technology (e.g. Tokar and Dickey, 2000). Rather than relying on untimely laboratory analyses of bottle samples that may suffer chemical alteration or contamination, in situ chemical sensors are being deployed on ship-based vertical profiling packages and more recently, moorings. One of these new chemical sensors is a field-deployable ultraviolet (UV) absorption spectrometer (Satlantic, Inc. In Situ Ultraviolet Spectrometer, ISUS; Johnson and Coletti, 2002). The principle behind the development of the ISUS is optical in nature: nitrate, dissolved in seawater, exhibits a broad absorption maximum centred at 苲210 nm. Nitrate absorption competes with the absorption of bromide, a conservative component of sea-salt, and to a lesser extent the carbonate ion (Chang et al., 2004, Figure 4). Advanced spectroscopic deconvolution techniques are used with the ISUS to isolate the nitrate absorption signal to make routine spectral measurements of nutrients (Johnson and Coletti, 2002). Another example of an in situ chemical sensor that uses spectrophotometric techniques is the SubChem, Inc. SubChemPak Analyzer. The SubChemPak Analyzer combines flow analytical methodologies of reagents with an absorption detector for rapid in situ measurements of dissolved nitrate, nitrite, iron and other nutrients.8 One of the main advantages of these in situ chemical analyzers is the ability to integrate quantification of ocean chemistry with other more commonly measured oceanographic parameters such as conductivity-temperature-depth (CTD), chlorophyll fluorometers and optical measurements. Interdisciplinary sensor packages that carry chemical sensors may also be towed for under-way sampling, profiled for high verticalresolution measurements, or deployed on autonomous platforms (e.g. moorings, bottom tripods, autonomous underwater vehicles (AUVs); see Section 2.3.2). Measurements of nutrient concentrations are now possible at temporal and spatial scales relevant to HABs. Challenges with these instruments involve length of deployment, calibration, and storage of reagents (for instruments such as the SubChemPak Analyzer).
8
http://www.subchem.com/
59
c02.indd 59
7/7/07 11:39:22 AM
Habwatch
2.3.2 Sensor platforms 2.3.2.1
Remote sensing systems
Remotely sensed measurements of oceanic properties from satellites or aircraft used for HAB research involve observations that rely on the sun for illumination of the ocean surface. These ocean-colour sensors measure the radiance entering the aperture of the sensor, for example SeaWiFS (satellite) and Portable Hyperspectral Imager for Low Light Spectroscopy (PHILLS; aircraft; Davis et al., 2002). A variety of scanning mechanisms are used to generate two-dimensional fields or images to provide nearly synoptic observations over the oceans (Yoder et al., 2001). Recent reports have summarized many of the salient principles, techniques and applications of ocean-colour remote sensing (e.g. see IOCCG Reports 1–5, 1999, 2000, 2001, 2004, and 2006 respectively). Ocean-colour data obtained from satellite sensors (e.g. SeaWiFS, Moderate Resolution Imaging Spectroradiometer (MODIS), and several others; see IOCCG Reports 1–5, 1999, 2000, 2001, 2004, and 2006 respectively) are most often used to infer concentrations of biological quantities (e.g. chlorophyll; O’Reilly et al., 1998; Yoder et al., 2001) and other optical information (absorption and scattering coefficients; Figure 2.8). Empirical ocean-colour algorithms are developed to quantify constituents in the water column using wavelength or waveband ratios. Different ratios are employed for different optical parameters, e.g. normalized water-leaving radiance at 490–555 nm (LWN(490)/ LWN(555)) for chlorophyll a concentration and LWN(443)/LWN(510) for dissolved matter or gelbstoff (Kahru and Mitchell, 2001). Several different chlorophyll a algorithms exist, applying different wavelengths ratios depending on the water column characteristics (O’Reilly et al., 1998). Analytical or semi-analytical algorithms employ the relationship between remote sensing reflectance and the ratio of backscattering to absorption (or absorption plus backscattering), that is radiative transfer (Lee et al., 2002). Algorithms using ocean-colour measurements of sun-induced fluorescence at wavelengths near 685 nm are proving to be valuable for estimating chlorophyll a, especially in coastal waters (IOCCG Report 3, 2001). In addition, remotely sensed optical data can be used to estimate primary productivity (Behrenfeld and Falkowski, 1997; Behrenfeld et al., 2005) and beam attenuation and particle size distribution (Roesler and Boss, 2003). With the advent of hyperspectral sensors (defined in Section 2.3.1), a single instrument can provide a multitude of wavelengths and wavelength ratios to more accurately resolve a variety of water column constituents. Potentially, hyperspectral technology provides a means for oceanographers to remotely and synoptically classify and quantify complex oceanic environments with respect to particle characteristics, including phytoplankton identification at least by group, and specific chemical compounds (Chang et al., 2004). Recently, hyperspectral remote sensing systems have been used for the identification of red tides and other HABs (Stumpf, 2001), and the characterization of river plumes and fronts in the coastal ocean (Figure 2.8). It is important to keep in mind that remote sensing, although the only available platform for synoptic measurements is extremely powerful, it can be limited. Cloud cover and coastal fog often obscure remote sensors, making images and data useless for analyses. Importantly, remote sensors measure radiances emitted only over the upper optical depth (Gordon and McCluney, 1975), typically ranging from about 1 m in coastal waters to a maximum of ~35 m in the clearest, open ocean regions. Therefore, only surface HAB species may be detected in remotely sensed images. Due to sensor resolutions, satellite ocean-colour data are often contaminated by land; data are not
60
c02.indd 60
7/7/07 11:39:23 AM
Interdisciplinary sampling strategies for detection and characterization
Figure 2.8 A, Moderate Resolution Imaging Spectroradiometer (MODIS) imagery of derived chlorophyll a concentration showing a high-biomass filament in the New York Bight on 14 July 2001 (the land mass on the left is coastal New Jersey just north of Cape Hatteras). Time series of B, derived absorption at 443 nm at the location of the white box in the MODIS image; C, derived chlorophyll a concentration at the same location. The red Xs represent the day and time of image (A). Subscript pg denotes particulate plus gelbstoff. Remote sensing data provides a means to resolve spatial variability and infer important bio-optical parameters. Source: MODIS imagery and derived bio-optical products were provided by Richard Gould and Robert Arnone, Naval Research Laboratory, Stennis Space Center.
available within about 5 km of coasts. Also, the nature of satellite orbital mechanics imposes restrictions on revisit frequencies, thus ocean-colour data are restricted in terms of temporal coverage. Thus, remote sensing information must be complemented with in situ observations (described below) to calibrate remote sensors (Barnes
61
c02.indd 61
7/7/07 11:39:23 AM
Habwatch
et al., 2001; Pinkerton et al., 2003), provide continuous time series, and to characterize important subsurface ocean properties. 2.3.2.2
Ships
Ship sampling is the oldest method of gathering oceanographic data, yet still remains a valuable resource for current HAB research in conjunction with modern, technological sampling platforms. Ship sampling provides: direct, detailed process-oriented measurements for specific research studies; • data at multiple depths and over long distances; • means of deployment of other sampling platforms (such as drifters, floats, AUVs, • gliders and moorings). Sampling via ships may include on-station vertical profiling of instruments or instrument packages; on-station and under-way ship-mounted, tethered or hand-held radiometric measurements; and under-way sampling using flow-through systems (Balch et al., 2001), towed undulating (Barth et al., 1998), and fi xed-depth bodies or chains that act as instrument platforms. One of the advantages of ship sampling is that calibrations and cleaning of instruments can be performed between each deployment (profile) to provide more accurate, freshly calibrated, essentially non-biofouled data. A second advantage of ships is that advanced analytical instrumentation that cannot at present be routinely deployed from other in situ platforms can be used, for example mass spectrometers, ‘clean’ methods for ocean chemistry, and radioactivity measurement systems. In addition, ships remain the only feasible platform capable of collecting whole water samples and conducting net tows for timely biological analyses. It is these biological analyses that are essential for complementing continuous, autonomously sampled interdisciplinary observations in order to investigate details of the physiological and behavioural aspects of HABs. Ships have limitations in terms of their high cost, limited availability and restricted synopticity in sampling. Also, they are constrained by meteorological and sea-state conditions. High costs and limited sampling problems have been resolved with the employment of ship-of-opportunity programmes (e.g. ferries) to make long-term basic measurements along consistent transects. In the Baltic Sea, regular measurements of surface chlorophyll fluorescence, conductivity-temperature and nutrients using a flow-through system are conducted on board cooperating merchant ships.9 These data have proved invaluable for characterizing the spatial and temporal extent of blooms in Scandinavian waters. The M/S Scotia Prince ferry in the Gulf of Maine is equipped with hydrographic, biological, optical and chemical sensors for long-term, continuous measurements to examine factors affecting the distribution of phytoplankton (Balch et al., 2004). Ferrymon, which runs in Pamlico Sound off the coast of North Carolina, regularly collects near-surface temperature, conductivity, dissolved oxygen, pH, turbidity and chlorophyll fluorescence data.10 These data are telemetered via cellphone technology to Duke University for analyses. Ferrymon activities are used to predict ecosystem responses to changes in Pamlico Sound water quality in an effort to direct coastal management. Alaska State ferries are equipped with instruments to make biophysical observations (hydrography, nutrients and bio-optics) in the Gulf of Alaska to monitor ecosystem changes.11 9
Alg@line; http://www.balticseaportal.fi / http://www.ferrymon.org/ 11 http://www.pmel.noaa.gov/foci/GEM/alaska_ferry/GEM_ferry.html 10
62
c02.indd 62
7/7/07 11:39:30 AM
Interdisciplinary sampling strategies for detection and characterization
2.3.2.3
Moorings and bottom tripods
Moorings and bottom tripods are ideal for HAB monitoring and characterization because these platforms can be used to study environmental changes in the ocean on timescales from minutes to decades. An increasing number of optical, chemical, biological and physical parameters are being measured from these platforms at multiple depths. In addition, researchers are currently developing automatic profiling moorings for high vertical and temporal resolution observations (Donaghay et al., 2003). Another advantage of moorings and tripods is the ability to sample during times of inclement weather and high sea-states. One of the limiting factors for these types of platforms is the great size and weight of moorings along with the high cost of implementation and deployment. Additional future technological advances will allow measurement systems to be more compact and lightweight, less power-hungry and lower in cost (Kaku, 1997; Tokar and Dickey, 2000; Bishop et al., 2001). The greatest disadvantage of these platforms is biofouling of sensors (Lehaitre et al., 2006). Useful data, particularly optical data, from moorings have often been limited to a few months in the open ocean and less in coastal waters (Davis et al., 2000). However, work is progressing to mitigate this problem (Chavez et al., 2000; Manov et al., 2004; Figure 2.9). Anti-biofouling techniques for optical instrument packages have been effectively implemented (Chavez et al., 2000; Manov et al., 2004). Some of the most useful techniques involve the use of copper and are necessary for long-term deployments of optical sensors (Figure 2.10). Copper significantly reduces marine fouling for long-term biooptical sensor deployments in the coastal ocean and can effectively replace highly toxic and problem-causing chemical anti-foulants, for example tributyl tin (TBT), bromine and chlorine (reviewed by Manov et al., 2004). Copper shutters that open during sampling and close over radiometric sensors, fluorometers and other optical windows during idle periods, successfully mitigate biofouling on coastal moorings (Chavez et al., 2000; Manov et al., 2004; Figures 2.9, 2.10). Many optical instruments use a flow-through system, thus copper tubing to prevent biological growth in optical systems have been effectively employed. These anti-fouling methods have been shown to increase useful deployment times of moorings from about one month to as long as four months in the coastal ocean (Chang et al., 2001; Chang et al., 2002). Another simple method of reducing biofouling on nearshore coastal moorings is diver servicing or retrieval of optics chains to the deck for cleaning. Many HAB monitoring moorings are or will be deployed within a few kilometres of shore, allowing easy access for regular cleaning of optical windows. Another advantage of these nearshore observational facilities is in the development and implementation of data telemetry methods using radio frequency technology for real-time or near real-time HAB-related measurements (e.g. the MEPS-Bay system in Nova Scotia, Canada; www.cmep.ca/bay). This is necessary for alerting authorities to the formation and persistence of HABs and for mitigation purposes. Recently, oceanographers have begun to explore the possibilities of using cabled networks for power and communications (fibre optics) to provide researchers and coastal managers with HAB data in real-time or near real-time (e.g. Glenn and Dickey, 2003; National Research Council, 2003). Cabled observatories will provide virtually unlimited power and data communication capabilities, which are especially important for novel biological, optical and chemical sensors that are now being engineered (Scholin et al., 2007 – Chapter 11 this volume) and commercialized. Cables also afford a means for two-way data communication, which facilitates adaptive sampling, for example
63
c02.indd 63
7/7/07 11:39:30 AM
Habwatch
Figure 2.9 Time series of over one year (406 days) of continuous, autonomously collected A, chlorophyll a concentration derived from a fluorometer; B, downwelling irradiance at 555 nm measured by a spectral radiometer. Both instruments were equipped with copper shutters to mitigate biofouling. Data were collected at 35 m on a mooring deployed in the Sea of Japan. This long time series captures the spring bloom in late March to late April (starting near Year Day 90 and ending around Year Day 120 in A) and the seasonal variability in solar insolation (low irradiance in winter and high light levels in summer in B).
increasing sampling rates when HABs are detected. The primary disadvantages of cabled networks are the costs of laying cable and the question of obtaining permits through coastal zones to onshore data and power control facilities. To circumvent these limitations, several researchers are exploring the potential for using retired telecommunication cables for ocean observing systems. Benthic processes relating to HABs may be studied and monitored using instrumentation deployed on bottom tripods in the coastal ocean. Bottom tripods and their instrumentation may be placed in the same environments as moorings using similar suites of sensors, samplers and communication systems deployable from moorings. Geological, biological, physical and optical systems mounted on tripods have been used to investigate sediment and detrital resuspension and settling, bedform formation and movement, bioturbation and flocculation/deflocculation of organic particles (Figure 2.3; Trowbridge and Nowell, 1994; Chang et al., 2001; Hill et al., 2001). In situ chemical sensors are currently being deployed near the ocean bottom to investigate nutrient upwelling and resuspension during HAB events. The feasibility of interdisciplinary 64
c02.indd 64
7/7/07 11:39:30 AM
Interdisciplinary sampling strategies for detection and characterization
Figure 2.10 A, copper-shuttered hyperspectral radiometer; B, biofouled (macrofouling) interdisciplinary instrument packages, including optical sensors, recovered after a four-month deployment from May to September 2004 in 25 m water depth in the Santa Barbara Channel; C, close-up of the nonbiofouled copper shutter of a hyperspectral radiometer. The shutter opens every hour on the hour between 06.00 h and 18.00 h local time just prior to sampling and closes after a few minutes of sampling. This prevented any biological growth on the irradiance detector.
detection systems on stationary platforms for HAB monitoring and research has been discussed by Johnsen and Sakshaug (2000), Cullen et al. (1997), Schofield et al. (1999), Cullen (2007 – Chapter 1 this volume) and Malone (2007 – Chapter 14 this volume). 2.3.2.4
Drifters and floats
Drifters and floats can provide high-resolution spatial data by following water parcels (Abbott et al., 1990; Dickey, 2001a). The Lagrangian platforms can provide data in portions of the time-space domain that are inaccessible by satellites, ships and other in situ platforms, e.g. under clouds and ice in the Southern and Arctic Oceans. Profiling floats, using buoyancy changes to move vertically, have provided near-real-time interdisciplinary data collected during their rise and descent through the water column (e.g. Mitchell et al., 2000; Bishop et al., 2003). The oceanographic data and Global Positioning System (GPS) data collected on drifters and floats are satellite telemetered after surfacing briefly at prespecified times. Drifter data allow detailed examinations of interdisciplinary processes on short time and space scales and the evaluation of de-correlation scales of chlorophyll and physical variables (Abbott and Letelier, 1998), which is important for the development of observation systems and models. The disadvantages of these platforms are similar to those of moorings and bottom tripods – biofouling and limitations in size, weight, and power of instrumentation. An additional disadvantage of the use of drifters and floats in HAB studies is the presence of boundaries in the coastal ocean. Currents tend to transport these platforms offshore 65
c02.indd 65
7/7/07 11:39:35 AM
Habwatch
or onto beaches, away from HABs. However, drifters and floats may be useful for determining physical processes leading to the formation and cessation of HABs (see study by Tester and Steidinger, 1997), in addition to the chemical effects such as particulate organic and inorganic carbon (POC and PIC) production of HABs on regional oceanography (Bishop et al., 2003). 2.3.2.5 Autonomous underwater vehicles, remotely operated vehicles and gliders Recently, numerous programmes have begun to exploit autonomous underwater vehicles (AUVs), remotely operated vehicles (ROVs) and gliders for coastal ocean scientific studies (Yu et al., 2002), with the potential for HAB research. A description of the history and present and future capabilities of AUVs is provided by Griffiths et al. (2001); AUVs specifically for HAB research are discussed by Griffiths (2007 – Chapter 13 this volume). Modern capabilities of AUVs and ROVs have become possible because of the development of new oceanographic sensors and systems that are relatively small in size, consume moderate power, and can be interfaced to the AUVs, ROVs and gliders. Dynamically diving AUVs are relatively small, lightweight, neutrally buoyant and powered by batteries. Some of the advantages of these autonomous platforms include low cost per deployment, potential to sample in environments generally inaccessible to ships, good spatial coverage and sampling over repeated sections, capability of feature-based or adaptive sampling, and ability for deployment of several vehicles from moorings, ships, offshore platforms and coastal stations. The primary disadvantage of AUVs and ROVs is related to its power consumption. AUVs and ROVs must be recharged regularly and hence, cannot be used for long-term deployments without a docking station. The glider concept uses variable buoyancy control, lift surfaces (wings), a hydrodynamic shape and trajectory control using internal moving mass to control its motion and therefore does not draw as much power as an AUV or ROV. With typical forward speeds of 0.25 m s–1, gliders may be used as long-term virtual moorings or for long transects (Davis et al., 2003). Schofield et al. (2003; 2007 – Chapter 3 this volume) review sampling strategies and ‘smart’ vehicles with respect to glider technology.
. Sensor and system design of HAB monitoring and assessment programmes A long-term, interdisciplinary HAB programme is necessary for monitoring and assessment of HAB development, persistence and cessation. Data should be collected at timescales as short as a few hours to the seasonal cycle and spatial scales covering the extent of the HABs out to beyond the continental shelf break. Real-time data telemetry will be essential for early warning of HABs to researchers and responsible authorities. Some important objectives of designing HAB sampling strategies are to: • develop and implement in situ detection and monitoring techniques using a variety of novel interdisciplinary instrumentation and platforms; • engineer anti-biofouling techniques for long-term deployment of HAB sensors; • develop and implement real-time telemetry of key data; • develop and implement web-based adaptive sampling networks, including two-way communication with instrumentation; 66
c02.indd 66
7/7/07 11:39:41 AM
Interdisciplinary sampling strategies for detection and characterization
•
determine threshold values of key HAB parameters to be used for a rapid response alert system prior to HAB formation; • determine the factors (environmental and anthropogenic, physical, chemical and biological) causing formation, persistence and cessation of HABs; • monitor the frequency, intensity and duration of HABs; • provide data for the development of models to predict the occurrence of HABs. The following suggested techniques would complement existing ship-based and volunteer HAB monitoring efforts, providing shorter temporal scale measurements and more timely and adaptive sampling strategies.
2.4.1 HAB systems and sensors We advise the use of small, lightweight, relocatable moorings and bottom tripods with interdisciplinary instrument packages deployed in regions of known HAB occurrences (Figures 2.11 to 2.13). These autonomous measurements should be complemented with synoptic measurements (e.g. ocean-colour satellite images) and high spatial resolution measurements to resolve processes associated with HAB development, persistence and cessation (further described below). Bio-optical
Figure 2.11 Schematic diagram of an ideal interdisciplinary coastal sampling network for harmful algal bloom detection, identification and characterization.
67
c02.indd 67
7/7/07 11:39:42 AM
Habwatch
Figure 2.12 (Centre) Schematic diagram of an ideal HAB monitoring mooring instrumentation package and photographs of A, anti-fouling copper shutter system on a Satlantic, Inc. MiniSpec hyperspectral radiometer; B, WET Labs, Inc. single-wavelength ECO fluorometer with copper shutter (left); C, marine bioluminescence bathyphotometer (MBBP); D, WET Labs, Inc. single-wavelength backscattering sensor; E, Satlantic, Inc. MiniSpec hyperspectral radiometer.
instruments equipped with anti-biofouling devices on the moorings will be necessary for detection of HABs and ideally, will include (hyper)spectral absorption-attenuation meters, fluorometers, backscattering sensors and radiometers, and bioluminescence sensors (e.g. marine bioluminescence bathyphotometer, MBBP) (Figure 2.12). New in situ optical-based chemical sensors will be necessary for obtaining information about micro- and macronutrients. Dissolved oxygen sensors will be essential for investigating the variability of biological processes in many coastal environments (not everywhere, e.g. Gulf of Maine). Complementary 68
c02.indd 68
7/7/07 11:39:51 AM
Interdisciplinary sampling strategies for detection and characterization
Figure 2.13 Schematic diagram of suggested data communication system: data collection, transmission, processing, graphing and presentation on the internet. RF: radio frequency, METs: meteorological sensors, Ed(λ) and L u(λ): radiometers measuring (hyper)spectral downwelling irradiance and upwelling radiance, CTD: conductivity-temperature-depth sensors, ac-x: (hyper)spectral absorption-attenuation meter, ECOflx: (spectral) fluorometer, ECObbx: (spectral) backscattering meter, MBBP: marine bioluminescence bathyphotometer, NUTs: optical-based nutrient analyzer, dO: dissolved oxygen sensor.
hydrographic data should be collected using temperature and conductivity sensors, and meteorological systems and HF-radar and current meters will be deployed for physical data. The sampling rates for all instruments should be hourly or faster with potential for adaptive sampling rates up to several times per minute. Instrumentation packages should be interfaced through a data logger and communication system for data transfer to shore-based computing assets (Figure 2.13). An automatic data transmission network using cables, radio frequency modems, or satellite telemetry should be used for real-time data collection and transmission. The instruments should be interfaced to a mooring data logger and the communication system (e.g. radio frequency transmitter) attached to the cable or located on the mooring buoy. The data logger will digitize the data before transmission then communicate the data to a shore-based data file management system (Figure 2.13). Computing resources should automatically process the data from its digital format to engineering units. Lastly, a graphical program should automatically convert the data into viewable images and transfer the images onto the internet (Figure 2.13). The data stream from all instruments listed above should also be sent hourly to the website. 69
c02.indd 69
7/7/07 11:40:00 AM
Habwatch
A web-based data management system, using JavaScript, will allow users, for example scientists, government health officials (local, state and federal), students and teachers (K-12, college and graduate), and non-governmental organizations to download and view real-time, archived and historical HAB and complementary data. For example, see the Dalhousie University Lunenberg Bay, Nova Scotia coastal observatory data access and visualization site (http://www.cmep.ca/bay). Data communication should use a system capable of two-way communication from mooring to shore-based computers and vice-versa.12 Therefore, during times of HAB formation, persistence and cessation, adaptive sampling can be employed to enhance the sampling efforts and ship-based sampling can be coordinated. Sampling rates and instrument gains can be changed when prompted by simple computer commands from shore. Another advantage of real-time data transmission is the ability to check for biofouling of data to schedule diver servicing or instrument/mooring turnarounds. Integration of detailed ship-based sampling should be employed when HABs are detected in a region. High spatial resolution data collection methods should be used just inside and outside the bloom region (Figure 2.11). A detailed sampling grid within the HAB can be designed according to the along- and cross-shore extent of the HAB; the extent of the HAB may be determined using satellite images if it has a surface expression, is large enough for observation, and has a discernable colour signature. If the HAB is determined to be highly extensive or patchy, measurements can be made along several detailed sampling grids in different locations. Our suggested measurement approach within the detailed sampling grid is to use an AUV or glider together with a vertical profiling instrument package, and whole water sample collection from Niskin bottles deployed from small research boats. Instruments on the AUV or glider could include: (spectral) fluorometer, spectral backscatter and other inherent optical property sensors, rapid chemical analyzer, MBBP, pressure sensor, temperature sensor, conductivity meter, acoustic-based current meter, and GPS. The AUV or glider can operate at pre-programmed speeds and patterns, for example in a zigzag or sawtooth pattern along the detailed sampling grid from the surface to the mixed layer or another depth or at a specified fixed depth (e.g. using artificial intelligence; Schofield et al., 2003). The instruments can sample up to 10 times per second for high spatial and temporal resolution. The vertical profiling package should be relatively small, lightweight, and deployable from small research boats. Vertical profiles should be obtained at prespecified locations along the detailed sampling grid. Battery-powered instruments on the profiling package could include: hyperspectral IOP and AOP instruments, (spectral) fluorometer, optical-based chemical analyzer, MBBP, pressure sensor, temperature sensor, and conductivity meter. These instruments can profile at