2 January 2001 Draft Comments Welcome
TIME-SERIES PROPERTIES OF STATE-LEVEL PUBLIC EXPENDITURE Indira Rajaraman* Hiranya Mukhopadhyay* R. Kavita Rao*
Abstract
Public expenditure reform must be underpinned by some understanding of the time-series properties of public expenditure. This paper examines the univariate properties of aggregate revenue expenditure at the level of State governments in India over the period 1974-98 for three states: Punjab, Haryana and Maharashtra. The empirical exercise is performed on the logarithmic transformation of aggregate revenue expenditure in terms of nominal (rather than ex post real) expenditure, not normalised to State Domestic Product, for reasons justified in the paper, and is confined to the aggregate for lack of a breakdown of the series by economic classification. The data are adjusted for notional entries and other distortionary budgetary practices. There is trend stationarity in Punjab and Haryana, with a deterministic trend growth rate of 16-17 per cent, and clear evidence thereby of fiscal smoothing in the presence of periodic upward shocks of Pay Commission or other origin. In Maharashtra by contrast, aggregate expenditure carries a unit root, with no deterministic trend, and no drift term; expenditure shocks of other than Pay Commission origin appear to have been enabled with no corresponding smoothing, but there is sharp and concurrent smoothing at the time of the Pay Commission shocks, such that aggregate expenditure does not show a spike. The issue of whether the fiscal smoothing in each case was unproductive or productive remains unrevealed in the aggregate figures.
JEL Classification: C22; H72 Keywords: public expenditure reform; time-series analysis. _____________________________ * National Institute of Public Finance and Policy. Corresponding author:
[email protected]. The authors are deeply grateful to Dr. Urjit Patel for very useful advice. 1
TIME-SERIES PROPERTIES OF STATE-LEVEL PUBLIC EXPENDITURE
I.
Introduction Public expenditure reform is a necessary element of all fiscal reform, but
must clearly be underpinned by some understanding of the time-series properties of public expenditure. This paper models public expenditure at the level of State governments in India as a univariate process, as a first step in that direction.
The empirical exercise is confined to three states: Punjab, Haryana and Maharashtra. Reported state-level expenditures are subject to spikes resulting from episodic notional accounting entries, with accompanying notional revenue entries, or other distortionary practices. Knowledge of these requires some measure of immersion in the budgetary practices of each state. Prior fiscal studies by the authors1 yielded insider information of this kind only for the three states selected. The data series for all three covers the period 1974-98, yielding 25 (annual) observations for each. A discontinuity in the reporting format on state-level finances in 1974 made it impossible to carry back the series to earlier years. This may not be as much of a disadvantage as might appear to be the case at first sight. A long time-series constructed by Rajaraman-Mukhopadhyay, 1999, for consolidated (Centre plus States) public domestic debt as a percent of GDP shows a structural break in the slope in 1974,2 with a positive slope in debt/GDP subsequent to 1974. The oil price hike of 1973 is a universal structural break in economic time series,3 supplemented by the Third Pay Commission salary hike for government employees, implemented in 1973.
1
Rajaraman, et.al 1999; Sen and Rao, 2000; NIPFP, 2000. This break was exogenously imposed, but tested for statistical significance within the framework of structural time-series models; see Rajaraman and Mukhopadhyay, 1999. 3 See for example Perron, 1989; by inserting structural breaks in 1929 and 1973 where Nelson-Plosser, 1982, did not, their finding of a unit root was rejected for all but a few (U.S.) 2
2
Section II reviews the surprisingly thin empirical literature on time-series properties of public expenditure. Section III describes the public expenditure determination process, and justifies performance of the analysis in terms of nominal rather than realised (ex post) real expenditure. The exercise is performed only on aggregate revenue (current) expenditure. There is prior evidence that capital expenditure is an accommodative component that is compressed at times of fiscal stress (Rajaraman et.al., 2000). In terms of priors, therefore, total expenditure may exhibit stationarity, where revenue expenditure might not. Disaggregation possibilities within revenue expenditure, as obtainable from budgetary data, permit breakdowns by functional (departmental) category alone. A breakdown by economic category (wages and salaries, purchases of goods) would have enabled a meaningful exploration at disaggregated level, but these are not systematically available in published form.
Section IV describes the adjustments made to the raw data for each state. Section V reports the specifications used and the findings, with details of test results in Appendices I (Punjab), II(Haryana), and III(Maharashtra). Section VI presents the conclusions in terms of implications for public expenditure reform. II.
Review of Literature To the best of our knowledge, the literature on the time series properties
of public expenditure is sparse. Ashworth, 1995, tests the null hypothesis of a unit root in real government expenditure in the United Kingdom, and fails to reject the null. Likewise Afxentiou, et.al, 1999, find the presence of a unit root in real per capita federal and provincial government expenditure in Canada. There is an empirical literature that tests Wagner's Law, which states that the share of government expenditure in total output increases as real per capita income grows. Of these, two (Ansari, et.al., 1997; Chletsos and Kollias, 1997) examine the time series properties of real government expenditure in per capita terms. The first finds that real per capita government expenditure is non-stationary (I(1))
economic time series. However, the imposition of exogenous breaks has been criticised as methodologically unsound by Christiano, 1992 and others.
3
in Ghana, Kenya and South Africa. A similar finding is reported in the second study for Greece. It is, however, not clear in either case whether or not the tests reject trend-stationarity in favour of difference-stationarity. Other studies testing for Wagner's Law (Amey and Ashworth, 1993; Murthy, 1993; Oxley, 1994; Anwar, et.al, 1996; Bohl, 1996) look at the time series properties of the share of government expenditure in GDP. Of these, the results of Anwar, et.al, 1996, who report for a large number of countries including India, are summarised in Table 1. No clear pattern emerges from their results, but what is of interest is that public expenditure/GDP for India is found to be I(0), i.e. stationary.
III.
The Expenditure Process
This exercise models actual aggregate public expenditure on the revenue (current) account, as reported at the conclusion of each fiscal year, which is the final realised outcome of the budgeted projected expenditure for the year. The budgeted estimate (B.E.) is an aggregation of the projected requirements of the different functional departments, after pruning by a central finance department, often augmented by one or more supplementary "demands for grants" during the course of the year. The final expenditure outcome obtains after further pruning in accordance with actual fund flows from the finance department to the spending departments. This second pruning may result either in expenditure carry-overs into the next fiscal year, which would then be merged with the B.E. for the next year, or by truncation of expenditure programmes. In some cases the reverse might happen, with actual expenditure falling short of funds provided, for any of a number of reasons, including procedural obstacles to expenditure. Revenue expenditure has two components: non-plan (committed expenditures from schemes initiated during past quinquennial plans); and plan (new schemes during the on-going quinquennial plan). This paper ignores the plan-nonplan distinction, and looks at total expenditure aggregating across the two.
4
Expected inflation enters into the budgetary process formally only in the dearness allowance (D.A.) component of wages and salaries, uniformly across departments. The D.A. is a salary add-on linked to the Consumer Price Index relevant to the region/class of employee. It amounts to a form of partial inflation indexation and is not necessarily concurrently paid; D.A. is often paid in the form of bunched arrears. Indeed, it is the lack of full inflation indexation that motivates the periodic upgradation of wage/salary scales by Central Pay Commissions. Once adopted by the Central government, the adoption of these, or in some cases enhanced, scales by State governments is routine. Other expenditure components are not formally indexed, although clearly departmental budgetary expenditure claims would be underpinned by some kind of expectation formation mechanism regarding inflation, most likely adaptive with a one-period lag. The supplementary grants and expenditure pruning process together determine the adjustment to actual inflation, and thus the real ex-post expenditure outcome. However, the process does not either explicitly target or protect real expenditure.
Further, expenditure reform is posed in terms of nominal absolutes. The exercise here is thus confined to the nominal series, and is confined also to aggregate expenditure for lack of data on components by economic category.4 Further, the series is not normalised with respect to State-level Domestic Product. State-level estimates of domestic product are available only at factor cost, carry an unknown noise element, but most importantly are available only with a considerable time lag, so that observations for recent years would thereby needlessly be excluded.
4
The sole exception to this is interest, on which information is routinely provided in budgetary data. Interest follows a known recursive growth dynamic over time, as a function of previous accumulations of state-level public debt, reduced in the case of Punjab state by waivers on debt and interest owed to the Central government. These waivers were justified by the Central government on the grounds that the cost of battling terrorism in the state must be nationally borne.
5
Table 1
Time Series Properties of the Share of Government Expenditure in GDP Australia Burundi Columbia Greece Indonesia Korea Malta Somalia Tunisia Belgium Canada El Salvador Guatemala Japan Liberia Mauritania Sri Lanka Uruguay Burkina Faso Finland India Jamaica Mali Mexico Trinidad Source: Anwar, et.al. (1996). Note:
IV.
I(1) I(0) I(1) I(1) I(1) I(1) I(1) I(1) I(0) I(1) I(1) I(1) I(0) I(1) I(1) I(1) I(1) I(1) I(0) I(0) I(0) I(0) I(0) I(0) I(0)
Government expenditure refers to general government that includes Centre, States and local governments.
Data Adjustments
Reported and adjusted revenue expenditure in Punjab are shown in figure 1. The components causing the spikes in revenue expenditure, shown in figure 2, were expenditure on state lotteries (in 1994-95 and 1995-96) and on the subsidy to the Punjab State Electricity Board (in 1991-92). In both cases, there were 6
accompanying revenue spikes. In the lotteries case, a brief experiment in 199496 with single-digit lotteries sharply raised both collections and pay-outs. In the PSEB case, there was a bunched book adjustment of the annual subsidy due to the PSEB5 but not paid over a number of years because it was set-off against interest dues from the PSEB. The accumulated subsidy was routed through the budget in 1991-92, against a corresponding notional interest receipt.6 As can be seen from figure 2, each spike is very sharp, adding as it does additional expenditures of the order of Rs 1500 crores, equivalent to an increase of between a third and a half of normal expenditure.
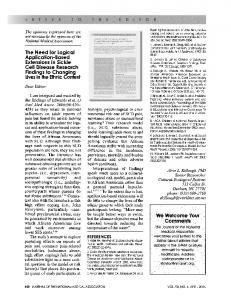
Figure 3 shows the annual growth rate of adjusted (nominal) revenue expenditure in Punjab. Three spikes in the growth rate are clearly observable: in 1975-76, the very first data point; in 1987-88; and again in 1996-97. These spikes corresponds to implementation of the Third, Fourth, and Fifth Pay Commission scales of pay (the Fifth Pay Commission was implemented with effect from 1 January 1996, but actual payments with arrears were made only starting January 1998 so that the spike in 1996-97 is surprising; it is possible however, that accounting adjustments were made to backdate arrears due so that the expenditure in the year of actual payment did not bunch alarmingly). Annual growth rates of expenditure in these years rose to more than 30 percent, from a mean level of approximately 15 percent. What is of interest is that these are spikes precisely because the rate of growth comes down in the next period very sharply to a below average rate.
Reported and adjusted revenue expenditure in Haryana are shown in figure 4. The adjustments required occur in the period 1994-99 on account of two components: rural electrification subsidy and lotteries. The corresponding spikes on the receipts side are interest receipts/repayments of loans from HSEB and receipts from lotteries. There is a periodic notional routing of interest arrears from 5
Since April 1977, to cover the operating losses of PSEB on account of rural electrification; for details see Rajaraman et.al. 1999. 6 Another such episode was observable in the RE for 1996-97, but not in the actual figures for the year, perhaps because of an ongoing dispute over the amount of subsidy payable; see Rajaraman et.al. 1999: 27.
7
HSEB against the rural electrification subsidy payable exactly as in the case of Punjab. Again, like Punjab, Haryana experimented with single digit lotteries, which resulted in large receipts and large lottery payments during 1994-99. The growth rate spikes (figure 5) in the case of Haryana, however, show expenditure surges in addition to those originating from Pay Commissions alone, principally in 1980-81 and 1994-95, arising from an assortment of departmental components.7
In the case of Maharashtra, the state has a number of schemes carrying reserve funds with dedicated receipts, like the Employment Guarantee Scheme which has five dedicated cesses. Receipts from these cesses are shown as revenue receipts, with corresponding automatic expenditure entries, showing transfer of an equivalent amount to the reserve fund. When actual expenditures are incurred, these are shown as financed through withdrawals from the reserve fund. If in each year, transfers to and withdrawals from these funds were of matching dimensions, the above practice would not introduce any distortions. However, if there is a net positive transfer to the reserve fund, the accounting convention followed shows reported expenditure higher than actual expenditure. In order to correct for this problem, reported expenditures in the case of Maharashtra have been adjusted to exclude net transfers to reserve funds. There is a growing divergence between reported and adjusted expenditure (figure 6) in the
nineties,
with
adjusted
expenditure
systematically
below
reported
expenditure, showing that there has been a growing absolute net transfer to reserve funds during this decade.
The growth rates in adjusted expenditure for Maharashtra (figure 7) are very different from those for Punjab and Haryana. There are no marked spikes corresponding to implementation of the Pay Commission scales (except for a starting spike in 1975-76). Instead, there are other sharp spikes, in 1978-79, and again in 1981-82, financed by major withdrawal from rural development funds.
7
In 1980-81 on account of expenditure surges in interest payments, and education and police departments; in 1994-95, in irrigation, water supply and social security.
8
10.00
5.00
9 1994-95
1993-94
1992-93
1991-92
1990-91
1989-90
1988-89
1987-88
1986-87
1985-86
1983-84
1983-84
1982-83
1981-82
1980-81
1979-80
1978-79
1977-78
1976-77
1976-76
1974-75
1998-99
15.00
1998-99
20.00
1997-98
25.00
1997-98
30.00
1996-97
35.00
1996-97
40.00
1995-96
Figure 3: Punjab Revenue Expenditure Growth Rates
1995-96
1994-95
1993-94
1992-93
1991-92
1990-91
1989-90
1988-89
1987-88
1986-87
0.00
1985-86
1983-84
1983-84
1982-83
1981-82
1980-81
1979-80
1978-79
1977-78
1976-77
1975-76
Percent
Rs. crore
1998-99
1997-98
1996-97
1995-96
1994-95
1993-94
1992-93
1991-92
1990-91
1989-90
1988-89
1987-88
1986-87
1985-86
1983-84
1983-84
1982-83
1981-82
1980-81
1979-80
1978-79
1977-78
1976-77
1976-76
1974-75
Rs. crore
Figure 1: Punjab Revenue Expenditure
9000.00
8000.00
7000.00
6000.00
5000.00 Reported
4000.00 Adjusted
3000.00
2000.00
1000.00
0.00
Figure 2: Punjab Expenditure Spikes
1800.00
1600.00
1400.00
1200.00
1000.00 Lotteries
800.00 PSEB Subsidy
600.00
400.00
200.00
0.00
0.00
10
20.00
10.00 1994-95
1993-94
1992-93
1991-92
1990-91
1989-90
1988-89
1987-88
1986-87
1985-86
1984-85
1983-84
1982-83
1981-82
1980-81
1979-80
1978-79
1977-78
1976-77
1975-76
1998-99
1997-98
1998-99
1997-98
30.00
1996-97
40.00 1996-97
50.00 1995-96
60.00
1995-96
Figure 5: Haryana Revenue Expenditure Growth Rates
1994-95
1993-94
1992-93
1991-92
1990-91
1989-90
1988-89
1987-88
1986-87
1985-86
1984-85
1983-84
1982-83
1981-82
1980-81
1979-80
1978-79
1977-78
1976-77
1974-75
0.00
1975-76
Figure 4: Haryana Revenue Expenditure
700000.00
600000.00
500000.00
400000.00 Reported
300000.00 adjusted
200000.00
100000.00
0.00
11
1998-99
1998-99
1996-97
1994-95
1992-93
1990-91
1988-89
1986-87
1984-85
1982-83
1980-81
1978-79
1976-77
1974-75
1500000.00
1997-98
1996-97
1995-96
1994-95
1993-94
1992-93
1991-92
1990-91
1989-90
1988-89
1987-88
1986-87
1985-86
1984-85
1983-84
1982-83
1981-82
1980-81
1979-80
1978-79
1977-78
0.00
1976-77
1976-76
3000000.00
Figure 6: Maharashtra Revenue Expenditure
2500000.00
2000000.00
Reported
Adjusted
1000000.00
500000.00
Figure 7: Maharashtra Revenue Expenditure Growth Rates
40.00
35.00
30.00
25.00
20.00
15.00
10.00
5.00
V.
Specifications and Findings
The budgetary process for any forthcoming fiscal year, as described in section II, is predicated on expenditure actuals in the previous year, with no referential carryback to previous years. Therefore, the first tested specification models nominal expenditure levels in logs as an AR(1) process, with both a constant drift and a trend term, and no higher-order lag terms.
ln yt If
=
? ln yt-1 + c + ßt + et ;
et ~ NID (0,s 2e)
… . (1a)
¦ ?¦ < 1, ln yt is stationary in levels.
If
? = 1, ln yt is non-stationary in levels and stationary in first differences. Thus, stationarity in the series can be determined by testing the null
hypothesis of a unit root in the series against a one-sided alternative (since ?>1 is implausible for a public expenditure series, even in India):
H0
: ?=1
H1
: ¦ ?¦ < 1
The specification is transformed for testing into the following form:
? ln yt = ? ln yt-1 + c + ßt + et ; where ?
= ?-1
H0
: ?=0
H1
: ?