2 Transport Network Vulnerability: a Method for Diagnosis of Critical Locations in Transport Infrastructure Systems
Michael A. P. Taylor, Glen M. D’Este Transport Systems Centre, University of South Australia, Australia; Email:
[email protected]
2.1 Introduction Considerations of critical infrastructure are now a major concern in Australia as in many other countries. The concern stems from a variety of causes, including the state of development, condition and level of use of existing infrastructure systems, especially transport networks; difficulties associated with public sector provision of new infrastructure; publicprivate partnership arrangements for infrastructure provision; and perceptions of risks and threats to infrastructure from both natural disasters (e.g. floods, fire or earthquake) and from human malevolence such as acts of sabotage, war or terrorism. The Australian Federal Government has defined critical infrastructure as ‘that infrastructure which if destroyed, degraded or rendered unavailable for an extended period, will significantly impact on social or economic well-being or affect national security or defence’ (Attorney-General’s Department, 2003). A pertinent question is then how to identify critical locations in an infrastructure network. For example, the road transport network is large, wide and diverse in nature. Are there particular locations or facilities in that network where loss or degradation of certain road sections (links) will have significant impacts? How should such impacts be assessed? Thus there are needs for the develop-
10
M.A.P. Taylor and G.M. D’Este
ment and application of a methodology to assess risk and vulnerability of transport networks. Methods and decision support tools are needed that allow planners and policy makers to make rational assessments of threats to facilities and infrastructure; the consequences of network degradation and failure at various locations and under different circumstances; and what to do about these. Social and economic benefits flow from the ability to plan for and manage the impacts of transport network degradation to minimise wider consequences on economic, employment, trade and social activities in cities and regions. This chapter provides an overview of our recent research on developing a methodology for transport network vulnerability analysis, based on considerations of the socio-economic impacts of network degradation. At one level this involves considerations of alternative paths through a network and the relative probabilities of use of those paths. Whilst probability of use is important in defining potential weak spots in a network, this probability is not of itself a complete measure of vulnerability – the most critical locations in a network will show the most severe (socio-economic) consequences resulting from network failure at those locations. The methods therefore consider vulnerability assessment in terms of a planning systems process in which the performance of network components is tested against established performance criteria. The risks and consequences associated with failures at different locations need to be accounted for. Suitable metrics that may be used to interpret the extent and consequence of network failure or degradation need to be developed and tested. The concept of network vulnerability is new, and it is important to define what is meant by vulnerability. For instance, there are several possible responses to the reduced performance of a degraded network, or in dealing with the perceived risks of degradation at different locations. In some cases, an appropriate response may be to upgrade key transport infrastructure, for instance by raising it above expected maximum flood levels or by adding more capacity. But sometimes this simply makes the network more reliant on those key links and more vulnerable to their failure. An alternative approach is to add links to the network. These links may normally be redundant but provide alternative routes when key network links are broken. At the urban network level there may already be many such latent alternative routes, but at the regional or national strategic network level this is less likely to be the case. Extra links would make the transport network more robust, but this may add unnecessary cost to the provision of transport infrastructure. The question is where are these locations of potential network vulnerability and what is the best response. The starting point for our study of network vulnerability was the study of transport network reliability, which has been the subject of intense in-
Transport Network Vulnerability
11
ternational research interest over the last decade, following the Kobe earthquake of 1995.
2.2 Network Reliability Transport network reliability has the subject of considerable international research interest in recent years (Lam 1999, Bell and Cassir 2000, Iida and Bell 2003, Nicholson and Dante 2004). Much of this research has focused on congested urban road networks and the probability that a network will deliver a required standard of performance. The urban studies are important, but they are not the only areas of concern, especially when considering the wider implications of transport systems performance. At the regional and national strategic level, accessibility, regional coverage and inter-urban connectivity are the primary considerations. In these sparse networks, ‘vulnerability’ of the network can be more important than ‘reliability’ because of the potentially severe adverse consequences of network degradation. As noted by the Bureau of Transport and Resource Economics (BTRE 1999) in its analysis of the effects of flooding on road access,
‘the vast distances involved means that access to alternative services (such as hospitals and business) often do not exist … disruption costs to households, businesses and communities can therefore be more important in rural and remote communities’.
In both urban and rural areas, the concept of vulnerability or incident audit – the proactive determination of locations in a transport network that may be most sensitive to failure and where network failure may have the gravest consequences – requires detailed research. The transport planner may seek opportunities to reduce vulnerability – and the community will demand such action. Network reliability became an important research topic in transport planning during the 1990s, although some elements had been the subject of research interest for some time before that (e.g. Lee 1946, Richardson and Taylor 1978, Taylor 1982). The Kobe earthquake of 1995 and its aftermath stimulated an interest in connectivity reliability. This is the probability that a pair of nodes in a network remains connected – i.e. there continues to exist a connected path between them – when one or more links in the network have been cut. Bell and Iida (1997) provided an analytical procedure for assessing connectivity reliability, and a summary of the procedure is given by Iida (1999). Subsequent research was directed at degraded networks, usually urban road networks subject to traffic congestion, in which the network remained physically intact but the performance of one or more links could be so severely affected by congestion that their use by traffic is
12
M.A.P. Taylor and G.M. D’Este
curtailed. This led to the definition of two additional forms of reliability: travel time reliability and capacity reliability, as described below. Travel time reliability considers the probability that a trip between an origin-destination pair can be completed successfully within a specified time interval (Bell and Iida 1997). This can be affected by fluctuating link flows and imperfect knowledge of drivers when making route choice decisions (Lam and Xu, 2000). One measure of link travel time variability is the coefficient of variation of the distribution of individual travel times (Richardson and Taylor, 1978). Measures of travel time variability are useful in assessing network performance in terms of service quality provided to travellers on a day-to-day basis (Yang, Lo and Tang, 2000). Thus travel time variability can be seen as a measure of demand satisfaction under congested conditions (Asakura, 1999). A supply-side measure of network performance in congested networks is capacity reliability (Yang, Lo and Tang 2000). Capacity reliability is defined as the probability that a network can successfully accommodate a given level of travel demand. The network may be in its normal state or in a degraded stated (say due to incidents or road works). Chen, Lo, Yang and Tang (1999) defined this probability as equal to the probability that the reserve capacity of the network is greater than or equal to the required demand for a given capacity loss due to degradation. Yang, Lo and Tang (2000) indicated that capacity reliability and travel time reliability together could provide a valuable transport network design tool. Taylor (1999, 2000) demonstrated how the concepts of travel time reliability and capacity reliability could be used in planning and evaluating traffic management schemes in an urban area. Further research on network reliability is required to develop these concepts into practical traffic planning tools. In addition, there is a need for further research to properly specify travellers’ responses to uncertainty (Bonsall 2000, Van Zuylen 2004) so that reliability research can be used to properly inform developments of new driver information systems and to influence the design of traffic control systems.
2.3 Network Vulnerability From the above review, we may conclude that the standard approaches to transport network reliability have focused on network connectivity and travel time and capacity reliability. While this provides valuable insights into certain aspects of network performance, reliability arguments based on probabilities and absolute connectivity may obscure potential network
Transport Network Vulnerability
13
problems, especially in large-scale, sparse regional or national networks. In these networks the consequences of a disruption or degradation of the network become important. For example, D’Este and Taylor (2001) used the example of the Australian land transport system to illustrate the potential consequences of the severance of certain transport connections in this multimodal network. In this example the system reliability was considered, in terms of a cut to the Eyre Highway and transcontinental rail line between Perth and Adelaide, for instance by flood. The overall network remains connected and the probability that the route in question is cut by flood or other natural cause is extremely small (but not zero since it has happened), so the travel time and capacity reliabilities are high. Therefore the established measures of network reliability would not indicate any major problem with the network. However the consequences of network failure are substantial – in this case the next best feasible path through the network involves a detour of some 5000 km. Nicholson and Dalziell (2003) pointed to similar circumstances in their study of the regional highway network in the centre of the North Island of New Zealand, a region subject to both snowstorms and volcanic eruptions. These examples illustrate the concept of network vulnerability and the difference between network reliability and vulnerability. The concept of vulnerability is more strongly related to the consequences of link failure, irrespective of the probability of failure. In some cases, link failure may be statistically unlikely but the resulting adverse social and economic impacts on the community may be sufficiently large to indicate a major problem warranting remedial action – akin to taking out an insurance policy for an extremely unlikely yet potentially catastrophic event. For example, consider the impact on a rural community of loss of access to markets for its produce and to vital human services (such as a hospital). Low probability of occurrence and network performance elsewhere does not offset the consequences of a network failure. Thus network reliability and vulnerability are related concepts but while reliability focuses on connectivity and probability, vulnerability is more closely aligned with network weakness and consequences of failure. Berdica (2002) proposed that vulnerability analysis of transport networks should be regarded as an overall framework through which different transport studies could be conducted to determine how well a transport system would perform when exposed to different kinds and intensities of disturbances. From her study of the road network in central Stockholm she suggested three main questions that might be posed in these studies: 1. How do interruptions of different critical links affect system performance, and to what extent?
14
M.A.P. Taylor and G.M. D’Este
2. How is network performance affected by general capacity reductions and possible changes to traffic management and road space allocation in a subregion of the network? 3. How is the system affected by variations in travel demand? These questions provide a starting point for the development of a methodology for study of vulnerability in transport networks and infrastructure. They highlight the key issue of the identification of critical components of the networks. Vulnerability analysis is intended to address these questions and the perhaps more important questions that flow from them – when we know where the vulnerable elements (the ‘weakest links’) of a transport network are, what is the best response, what can we do about it? 2.3.1 Vulnerability and Risk Vulnerability, reliability and risk are closely linked concepts. In broad terms, risk is something associated with negative outcomes for life, health, or economic or environmental condition. Risk can be defined in many different ways, but most definitions focus on two factors: the probability that an event with negative impacts will occur, and the extent and severity of the resultant consequences of that event. Commonly, the product of probability and a measure of consequence is used as an index of risk. This may be shown schematically as a ‘risk matrix’, as in Figure 2.1.
Consequence
Probability
Fig.2.1
Conceptual risk matrix
Risk and reliability analysis is mostly concerned with the top-right sector of the matrix where increasing probability and increasing consequences combine. Nicholson and Dalziell (2003) applied this framework to the risk
Transport Network Vulnerability
15
assessment of transport networks in New Zealand. They measured risk as simply the sum of the products of the event probabilities and the economic costs of the event (e.g. the expected annual economic cost of a given event). Their risk evaluation process involved the following steps: 1. establish the context (i.e. the technical, financial, legal, social and other criteria for assessing the acceptability of risk) 2. identify the hazards (i.e. the potential causes of closure) 3. analyse the risks (i.e. identify the probabilities, consequences and expectations) 4. assess the risks (i.e. decide which risks are acceptable and which are unacceptable). If any risk is found unacceptable, it needs to be managed. This generally involves either (1) treating the unacceptable risks, using the most costeffective treatment options, or (2) monitoring and reviewing the risks (i.e. evaluating and revising treatments). The study of vulnerability extends this risk assessment framework in several important ways. Firstly it extends the region of interest to areas of high consequences and low or unquantifiable (but non-zero) probability of occurrence – on the basis that measurement of occurrence probability and consequences (human and economic) is imprecise for many types of incidents, and society may well consider some consequences to be unacceptable and worthy of safeguarding against, despite uncertainty about their probability of occurrence (e.g. Evans, 1994). Secondly, vulnerability analysis provides a framework for targeting risk assessment. One of the key conclusions of the Nicholson-Dalziell risk assessment of the New Zealand highway network was that it is impractical and financially infeasible to conduct detailed geophysical and other risk assessment across an entire transport network. The costs of deriving accurate location-specific risk probabilities across a range of risk factors are too high to make it viable – what is needed is a way of targeting risk assessment resources to get best value from them. Vulnerability analysis provides another way of approaching this problem. It can be used to find structural weaknesses in the network topology that render the network vulnerable to consequences of failure or degradation. Resources can then be targeted at assessing these ‘weak links’. Thirdly, vulnerability auditing admits a more proactive and targeted approach to the issue of transport network risk assessment and mitigation. 2.3.2 Definitions The authors have defined vulnerability by using the notion of accessibility, i.e. the ease by which individuals from specific locations in a region may
16
M.A.P. Taylor and G.M. D’Este
participate in activities (e.g. employment, education, shopping, trade and commerce) that take place in other physical locations in and around the region and by using a transport system to gain access to those locations (Taylor and D’Este 2004a). Then vulnerability is defined in the following terms: x a network node is vulnerable if loss (or substantial degradation) of a small number of links significantly diminishes the accessibility of the node, as measured by a standard index of accessibility x a network link is critical if loss (or substantial degradation) of the link significantly diminishes the accessibility of the network or of particular nodes, as measured by a standard index of accessibility. This broad definition can then be further refined by the selection of specific indices of accessibility. Amongst others, Morris, Dumble and Wigan (1979), Koenig (1980), Niemeier (1997) and Primerano (2003) provide discussions of alternative accessibility indices. For the case of strategic level networks such as a regional or national network, relatively simple indices are appropriate. A number of indices may be considered as useful in strategic network analysis. Two of these are: (1) generalised travel cost, for the elemental separation between two locations, and (2) the Hansen integral accessibility index (Hansen 1959) which provides an overall measure of the accessibility of one location to a set of other locations. Generalised cost cij is the overall assessed cost of travel from origin i to destination j in the network. It may be taken as the network travel distance, travel time, money cost or some other measure (e.g. fuel used) between the two locations, or as a (weighted) sum of these. These two indices are useful in assessing accessibility between major population or activity centres. In the case of regional analysis involving locations outside major population centres, some other measure of accessibility is needed. This is of particular interest in vulnerability studies of regional and remote areas such as those comprising the geographic mass of mainland Australia. Specifically for such sparsely settled regions, the Australian Government has adopted a ‘remoteness’ index known as ARIA (Accessibility/Remoteness Index of Australia) that is used by federal departments to assess the level of government and private sector services (e.g. in health, finance and social welfare) available to residents of regional and remote areas (DHAC, 2001). Whilst this chapter does not consider the use of ARIA, our wider research on vulnerability does, because the consequences of network degradation on rural communities in regional and remote areas are of significant societal concern. Sekhar and Taylor (2005) provides an introductory account of the study of vulnerability at the regional level.
Transport Network Vulnerability
17
Taking generalised cost, we can formulate a basic model that may be used to provide a measure of vulnerability in terms of the change in generalised cost of travel between two locations if a given link fails, where the generalised cost may be taken as an appropriate measure of disutility of travel such as distance, time, money, etc – in other words, the loss of amenity from link failure. Generalised cost is seen as a simple measure of elemental accessibility as it indicates the difficulty involved in travelling between the two locations (if not the overall impact of that difficulty). Let 'cijrs denote the change in generalised cost of travel from node i to node j if network link ers fails (ers is a link connecting nodes r and s in the network). Then the loss of community amenity is d ij 'cijrs where dij is the demand for movement from i to j and demand is a measure of the quantity of movement from i to j. It follows that the total loss of amenity from the failure of ers is then
Vrs
¦¦ d i
j
ij
'cijrs
(1)
The two measures, 'cijrs and Vrs, provide local and global measures of the consequences of failure of link ers. Hence they are direct measures of the extent to which the operation of the transport system is vulnerable to failure of specific links. Note that similar definitions can be developed for node failures. In more formal terms, the problem can be stated as follows. Consider a network G(N,E) where N is a set of n nodes and E is a set of m directed links. Associated with each link is a non-negative attribute that measures the utility of the link according to a particular link characteristic, such as distance, time, money cost, reliability, or generalised cost. Let s[ij, G(N,E)] be the ‘cost’ of the least cost path from origin i to destination j in G(N,E) then
'cijrs = s[ij, G(N,E- ers)] - s[ij, G(N,E)]
(2)
that is, the difference between the least cost path with the network intact and the least cost path without the link from r to s, ers. The task of calculating 'cijrs and Vrs can be tackled by a number of approaches, as described in D’Este and Taylor (2003) and Taylor and D’Este (2004a, b), and the essence of these approaches is the concept of a ‘network scan’ in which the first step is to identify candidate critical links, either because they form part of a minimum cost path between origin node i and destination node j, or in a multipath model have a reasonable probability of use for travel be-
18
M.A.P. Taylor and G.M. D’Este
tween those two nodes, and the next step is to fail each of those candidate links in turn and assess the consequences of those failures. Such scans can be used with any of the three indices of accessibility cited above, and relative changes in accessibility for the degraded networks then used to assess vulnerability. 2.3.3 A Specific Accessibility Index The Hansen integral accessibility index (Ai) for location (city) i is written as Ai B j f (cij ) (3)
¦ j
where Bj is the is the attractiveness of location (city) j, e.g. the number of opportunities available at j. In the strategic network application described in this chapter Bj is taken as the population of city j. Equation (2) is often used in a normalised form, viz
Ai
¦B j
j
f (cij )
¦B j
(4) j
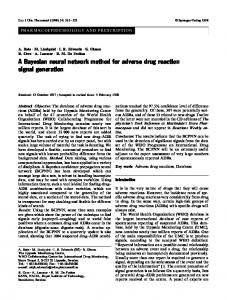
and this is the version used in our research, where the Hansen index has been used to consider changes in accessibility between the Australian mainland capital cities (Adelaide, Brisbane, Canberra, Darwin, Melbourne, Sydney and Perth) for degradations of the Australian National Highway System (NHS) road network. The NHS is shown in Figure 2.2. The impedance function f(cij) of equations (2) and (3) represents the separation between the two cities and is defined so that the higher the cost of travel between the two cities, the lower the accessibility between them. The definition adopted in this current work is the conventional reciprocal of travel distance in the network.
2.4 The Australian Road Network The analysis reported in this chapter is based on the NHS road network, which forms the basic skeleton of the national road system of Australia (see Figure 2.2). This subset of the national main road network has been designated by the Australian federal government as of prime importance in providing a national road transport system, and the funding for the provi-
Transport Network Vulnerability
19
sion and maintenance of the NHS is the express responsibility of the federal government. The full main road network connecting cities and regions is of course much more extensive than the NHS network (see Figure 2.3). The full main road network may be split into three subnetworks, which relate to the national, state or regional importance of the individual roads and highways. Besides the NHS, the other subnetworks are the state highways and designated main roads, which provide connectivity at the state level and are the direct responsibility of the state governments, and the other main roads, which provide regional connectivity and for which responsibility may be shared between state and local government. Figure 2.3 highlights the NHS and state highways and designated roads subnetworks as a skeleton amidst the matrix of the full network. In the more densely settled regions of the south east, east coast and south west, there is a substantial main road network. The network coverage away from those regions, in the less settled parts of the nation, is much sparser and here the NHS and state highways really do represent almost the entirety of the navigable road system. This may be seen in Figure 2.4, which shows the NHS and the designated state highway networks.
Fig. 2.2
The Australian National Highway System (NHS) network, connecting the major cities
20
M.A.P. Taylor and G.M. D’Este
N W
E S
Designated Highways Main roads National Highway System Australia-States
500
Fig. 2.3
0
500 1000 Kilometers
The Australian main road network showing all main roads, designated state highways and the National Highway System (NHS) subnetworks
N W
E S
Designated Highways National Highway System Australia-States 500
Fig. 2.4
0
500 1000 Kilometers
The Australian NHS and designated state highways form a subnetwork of the full Australian main road network
Transport Network Vulnerability
21
A GIS database of the entire strategic road network of Figure 2.3 has been set up using the ArcGIS package. This database holds a number of attributes for all of the identified road links, including: x road classification (NHS, stage highway, other main road) x road type (e.g. freeway, divided carriageway, two-lane two-way road) x region (urban, regional, remote) x pavement type (sealed or unsealed) x speed limit x average operating speed x bridge locations In addition, attributes concerning pavement condition and traffic volume (AADT) are being progressively added to the database as they become available, using data supplied by the various state road authorities. This full database will be used to study vulnerability at national, state and regional levels and to locate critical locations (links and nodes) in the network, using the accessibility indices and the network scanning procedures discussed previously.
2.5 Sample Network Scan of the NHS We now present an illustrative application of our vulnerability scan methods, using the NHS network (see Figure 2.2, and also Figure 2.4) as a case study. As such, this example is restricted to considerations of the accessibility provided by the NHS as the sole network for travel between the mainland capital cities. This is a simplification of the real world situation but it clearly exemplifies the techniques for network scans and vulnerability analysis and suggests a way forward for further studies of more complex networks. As suggested previously, a simple accessibility index is that of generalised travel costs between origins and destinations. Given origin-destination flows, then overall increases in cost in a degraded network can be assessed by using equation (1). However, such flows are not always available – and this is the current case for the Australian national road transport system. Whilst there are data on corridor flows – see for instance Gargett and Sidebottom (2003) – these do not provide information on all of the specific origin-destination movements. Future research will attempt to overcome this problem. As one approximation in the absence of observed origindestination flows, weighted travel times can be used as a measure of change in generalised cost accessibility. We do this here to provide an indication of a vulnerability analysis based on origin-destination flows, be-
22
M.A.P. Taylor and G.M. D’Este
cause this relates immediately to the primary definition of vulnerability provided earlier in this chapter, and expressed by equation (1). Table 2.1 shows the (2001) populations of the mainland capital cities and the travel distances between them, using the full NHS network. Table 2.2 shows the equivalent travel times between the cities. Capital city populations and inter-city travel distances in the full NHS Network
Table 2.1
Adelaide
Brisbane
Population 1002127 1508161 (2001) Travel distance via NHS (km) Adelaide 1985.7 Brisbane Canberra Darwin Melbourne Perth Sydney
Canberra
Darwin
339727
71347
1167.5 1109.0 -
2622.9 3103.0 3756.3 -
Melbourne
Perth
Sydney
3160171
1176542
3502301
722.5 1536.1 636.2 3345.5 -
2691.7 4643.2 3828.6 3465.8 3414.3 -
1341.9 873.5 235.5 3873.2 810.6 3999.5
-
Minimum travel times in full NHS Network
Table 2.2 Travel time (h) from Adelaide Brisbane Canberra Darwin Melbourne Perth Sydney
To Ade -
Bri
Can
Dar
Mel
Per
Syd
23.36 -
13.74 13.05 -
30.86 36.51 44.19 -
8.50 18.07 7.49 39.36 -
31.67 54.63 45.04 40.77 40.17
15.79 10.28 2.77 45.57 9.54
-
47.05 -
A weighting factor for each origin-destination pair was devised, based on a simple gravity model for interactions between the cities, i.e. the normalised weight wij for travel between cities i and j was
wij
g ij
¦g ij
where
(5) ij
Transport Network Vulnerability
g ij
Bi B j xij2
23
(6)
in which Bi is the population of city i and xij is the network travel distance between i and j. The network scan approach was to find the minimum travel time paths between origin-destination pairs and then to cut the network at each link (e) of the minimum path in succession and calculate the resulting changes 't ije in inter-city travel times. By summing over all origin-destination pairs and using the weights wij given by equation (5), an overall weighted network travel time increase (Te) can be calculated: Te wij 't ije (7)
¦ ij
This analysis, summarised by Table 2.3, indicated that four particular road sections were the most critical in the NHS network. These four sections were 1. Hume Freeway, between Melbourne and Seymour 2. Hume Highway, between Albury and Gundagai 3. Hume Freeway, between Yass and Sydney 4. Ipswich Motorway, between Brisbane and Ipswich. Link closures on these four sections yielded increases in weighted average travel times at least 5.5 times larger than those for any other road sections in the network. The next road section of interest was the South Eastern Freeway from Adelaide to Melbourne, which produced an increase in weighted average travel time of 1.66 hours, compared to the 9.13 hours for the Ipswich Motorway (see Table 2.3). Weibull (1976), cited in Morris, Dumble and Wigan (1979), provided a set of criteria for indicating the usefulness of an accessibility index. On the basis that accessibility refers to the ease of movement to or from a place, Weibull suggested that one property of a proper accessibility index would be that its value would increase as the accessibility of the place increased. Unfortunately, generalised cost fails this test. An increased in the generalised cost of travel to or from a place indicates that it has become less accessible. In addition, Morris, Dumble and Wigan distinguished between elemental accessibility indices, that indicate the level of accessibility between two locations (say i and j), and integral accessibility indices, which indicate the overall accessibility of a given location (say i) to all other locations. Integral accessibility measures are more useful in considering the overall impacts of change of network or travel conditions. Generalised cost is a measure of elemental accessibility.
24
M.A.P. Taylor and G.M. D’Este Increases in weighted average travel times in degraded NHS network, from each origin city to all destination cities
Table 2.3
Increases in weighted travel times (h) with cut to Hume Highway (Albury-Gundagai) Adelaide Brisbane Canberra Darwin Melbourne Perth Sydney Total 0.06 0.00 0.96 0.00 5.72 0.01 4.82 11.57 Increases in weighted travel times (h) with cut to Hume Freeway (Yass-Sydney section) Adelaide Brisbane Canberra Darwin Melbourne Perth Sydney Total 0.05 0.00 0.82 0.00 4.76 0.01 5.72 11.36 Increases in weighted travel times (h) with cut to Hume Freeway (Melbourne-Seymour) Adelaide Brisbane Canberra Darwin Melbourne Perth Sydney Total e 0.00 0.00 0.63 0.00 5.07 0 3.99 9.69 Increases in weighted travel times (h) with cut to Ipswich Motorway (Brisbane-Ipswich) Adelaide Brisbane Canberra Darwin Melbourne Perth Sydney Total e 0.06 4.57 0.07 0.00 3.23 0.01 1.20 9.13
An integral accessibility index whose values increase as the home location (origin) becomes more accessible, such as the Hansen index of equation (3), is intuitively more appealing than the generalised cost index, especially given a lack of data on origin-destination flows, as discussed above. A network vulnerability scan using the Hansen index was performed for the mainland capital cities in the NHS network, to illustrate the use of this index in vulnerability analysis. Table 2.4 shows the computed Hansen indices for each city and for all of the cities, when the full NHS network is available. These computations were based on the populations and inter-city network travel distances given in Table 2.1. Hansen accessibility indices in full NHS Network
Table 2.4 Adelaide
Brisbane
Canberra
Darwin
Melbourne
Perth
Sydney
Hansen index 0.0871 0.0773 0.02148 0.0294 0.0999 0.0272 0.1120 Total Hansen index summed over all cities = 0.6477 (overall accessibility metric)
A vulnerability scan was then undertaken, similar to that performed for the weighted mean travel time accessibility index. In this scan, each link of the minimum travel time path tree from each city was broken in turn, new minimum paths determined for the degraded networks, and revised values of the Hansen indices computed for the degraded networks. Critical road sections were determined on the basis of their impacts, when broken, on
Transport Network Vulnerability
25
the overall accessibility of the network. Table 2.5 summarises the results of this analysis. The accessibility metrics in this table are relative Hansen indices, i.e. the Hansen index for the degraded network divided by the relevant Hansen index for the full network. The same four road sections were identified as critical (most vulnerable) parts of the network, in terms of the reduced levels of overall accessibility (between all cities) for the NHS network. A closure in the Sydney-Yass section of the Hume Freeway leads to an overall reduction in the total accessibility of all the capital cities of some 34 per cent, and this was the most critical section of the network identified in the analysis (see Table 2.5). It should be noted that the overall effect of the Ipswich Motorway is due to the peculiar topology of the NHS network and the simplification of any analysis of the road system based on this network alone. The Ipswich Motorway is the only road link in the NHS connecting Brisbane (Australia’s third largest city) and all of the other capital cities. Closure of this road in this network thus has a catastrophic impact on travel to or from Brisbane, bringing it to a complete stop! In the real world network there are alternative routes that would be used – the effect of a closure of the motorway would still be important, but not as complete as in this simplified illustrative example. Table 2.5
Relative values of Hansen accessibility index in degraded NHS network, as proportions of index values for full network
Proportionate Hansen accessibility index with cut to Hume Freeway (Sydney-Yass section) AdeBrisCanDarwin MelPerth laide bane berra bourne 0.842 0.989 0.390 1.000 0.631 0.912 Proportionate Hansen accessibility index with cut to Hume Highway (Albury-Gundagai section) AdeBrisCanDarwin MelPerth laide bane berra bourne 0.822 1.000 0.806 0.998 0.578 0.901
Sydney
Total
0.697
0.662
Sydney
Total
0.617
0.780
Proportionate Hansen accessibility index with cut to Ipswich Motorway AdeBrisCanDarwin MelPerth Sydney laide bane berra bourne 0.911 0.000 0.939 0.846 0.871 0.875 0.788 Proportionate Hansen accessibility index with cut to Hume Freeway (Melbourne-Seymour section) AdeBrisCanDarwin MelPerth Sydney laide bane berra bourne 1.000 0.876 0.853 1.000 0.552 1.000 0.726
Total 0.785 Total 0.818
26
M.A.P. Taylor and G.M. D’Este
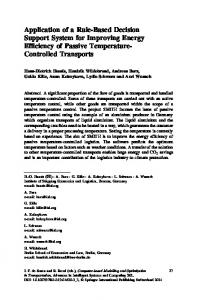
A further advantage of the Hansen accessibility index is that it also explicitly reveals the effects on the individual cities of link closures, as can be seen in Table 2.5. For example, a closure on the Sydney-Yass section of the Hume Freeway leads to a 61 per cent decrease in the accessibility of the national capital Canberra, a 16 per cent decrease in the accessibility of Adelaide, an a nine per cent decrease in the accessibility of Perth1. Likewise, the Ipswich Motorway has a 100 per cent effect on the accessibility of Brisbane (in the NHS, see above) and a 21 per cent decrease in accessibility overall. These individual changes as well as the overall change help to more clearly define the vulnerability of specific road sections, whereas these results are not available for the generalised cost index. Figure 2.5 identifies these critical road sections on a map of the NHS network.
Ipswich Motorway
Hume Highway
Hume Freeway
Hume Freeway
Fig. 2.5
Critical road sections from the vulnerability scan of the NHS
As indicated on the previous page and shown in Table 2.5, the overall accessibility of all of the capital cities decreases by 34 per cent with a cut to the Sydney-Yass Section of the Hume Freeway. 1
Transport Network Vulnerability
27
2.6 Discussion This chapter has discussed the development of techniques to identify specific ‘weak spots’ – critical infrastructure – in a network, where failure of some part of the transport infrastructure would have the most serious effects on access to specific locations and overall system performance. The Australian National Highway System road network is used as a simple case study, but the concepts and techniques described in this paper have much wider application. In particular and as a next part of our research and development of the vulnerability method, we will be adapting and applying the methods for use in the much larger and more complex road networks that exist in the real world. What we can say at present is that our research has yielded useful concepts and a method for analysis of network vulnerability in terms of the spatial or topological configuration of the network and possible socio-economic impacts assessed in terms of changes in accessibility to markets, service and facilities resulting from site-specific failure of transport infrastructure. Further research is needed to: x develop more efficient algorithms for network vulnerability scans in large and complex networks x develop better and more comprehensive vulnerability metrics x refine techniques for identifying network weaknesses x extend and refine the use of network vulnerability indicators for use in studies of critical infrastructure and the implications of network degradation x develop techniques for recommending and evaluating cost-effective risk management and remedial responses (such as reducing risk profile, upgrading existing infrastructure, adding alternative routes, and so on). This may involve trading off the level of resources put into managing the risk against a measure of vulnerability that takes into account the implications of network failures as well as path probabilities x develop visualisation tools for interpreting and communicating results Candidate vulnerability metrics belong to a composite set including: x indices of network connectivity and accessibility x probability distributions for travel times and costs to specified destinations x measures of change in the utility of travel x spatial distributions of changes in the above metrics x indices of risk, including expected values of costs, changes in these values under different network conditions, propensity for component failure, and performance thresholds.
28
M.A.P. Taylor and G.M. D’Este
The research results provided in this chapter suggest that an integral accessibility index such as the Hansen index can account for most of these desired properties and can be widely applied for strategic level analysis using commonly available data such as city population and network travel distances. Our set of measures is being designed to reflect both the intensity of vulnerability and its extent, both spatially and demographically, across a study region. The techniques to apply these measures to vulnerability analysis will be based on the complex system paradigm, thus focusing the research on the required methodology, process and tools. Validation of the techniques will require careful appraisal of the modelled consequences of network failure for real world systems. In the longer term we envisage a form of network scanning that might be termed ‘incident audit’ – akin to road safety audit – being developed in the long term. The aim is to provide a methodology that can identify where infrastructure failure will have the worst consequences for movement of people and goods. It includes tools for engineers and planners to determine critical network locations, and devise strategies and remedial measures to safeguard network performance. These tools can be applied at a variety of planning levels, from strategic planning to tactical planning and operational management and control.
Acknowledgement The research reported in this paper is supported by a Discovery Grant from the Australian Research Council. The contributions of Dr Sekhar Somenahalli to the establishment of the GIS database of the Australian main road network should be acknowledged, along with the vital input of traffic and highway data by Mr David Brown of Main Roads Western Australia.
References Asakura, Y. 1999. Evaluation of network reliability using stochastic user equilibrium. Journal of Advanced Transportation 33 (2), pp.147-158. Attorney-General’s Department. 2003. Trusted information sharing network for critical infrastructure protection. Attorney-General’s Department, Australian Government. Canberra ACT, 10 March 2003. Bell, M.G.H.and C. Cassir (eds.). 2000. Reliability of Transport Networks. Baldock, Herts: Research Studies Press.
Transport Network Vulnerability
29
Bell, M.G.H. and Y. Iida. 1997. Transportation Network Analysis. Chichester: John Wiley and Sons. Berdica, K. 2002. An introduction to road vulnerability: what has been done, is done and should be done. Transport Policy 9, 117-127. Bonsall, P.W. 2000. Travellers’ response to uncertainty. In Reliability of Transport Networks. Edited by M.G.H. Bell and C. Cassir. Baldock, Herts: Research Studies Press, 1-10. BTRE. 2002. Benefits of flood mitigation in Australia. Report 106, Bureau of Transport and Regional Economics, Canberra. Chen, A., Yang, H., Lo, H.K. and Tang, W.H. 1999. A capacity related reliability for transportation networks. Journal of Advanced Transportation 33 (2), 183200. D’Este, G.M. and Taylor, M.A.P. 2001. Modelling network vulnerability at the level of the national strategic transport network. Journal of the Eastern Asia Society for Transportation Studies 4 (2), 1-14. D’Este, G.M. and Taylor, M.A.P. 2003. Network vulnerability: an approach to reliability analysis at the level of national strategic transport networks. In The Network Reliability of Transport. Edited by Y. Iida and M.G.H. Bell. Oxford: Pergamon-Elsevier, 23-44. DHAC. 2001. Measuring remoteness: accessibility/remoteness index of Australia (ARIA) (Revised edition). Occasional Paper, New Series no 14. Commonwealth Department of Health and the Ageing, Canberra. Evans, A.W. 1994. Evaluating public transport and road safety measures. Accident Analysis and Prevention 26, 411-428. Gargett, D. and Sidebottom, A. 2003. Freight between Australian cities 1972 to 2001. Information sheet 22, Bureau of Transport and Regional Economics, Canberra. Hansen, W.G. 1959. How accessibility shapes land use. Journal of the American Institute of Planners 25, 73-76. Iida, Y. 1999. Basic concepts and future directions of road network reliability analysis. Journal of Advanced Transportation 33 (2), 125-134. Iida, Y. and Bell, M.G.H. (eds.). 2003. The Network Reliability of Transport. Oxford: Pergamon-Elsevier. Koenig, J.G. 1980. Indicators of urban accessibility: theory and application. Transportation 9, 145-172. Lam, W.H.K. (ed). 1999. Special issue on transport network reliability. Journal of Advanced Transportation 33 (2). Lam, W.H.K. and Xu, G. 2000. Calibration of traffic flow simulator for network reliability assessment. In Reliability of Transport Networks. Edited by M.G.H. Bell and C. Cassir. Baldock, Herts: Research Studies Press, 139-157. Lee, C.E. 1946. New works for wartime traffic. The Railway Magazine 92, May/June, 177-83. Morris, J.M., Dumble, P.L. and Wigan, M.R. 1979. Accessibility indicators for transport planning. Transportation Research 13A, 91-109.
30
M.A.P. Taylor and G.M. D’Este
Nicholson, A.J. and Dalziell, E. 2003. Risk evaluation and management: a road network reliability study. In The Network Reliability of Transport. Edited by Y. Iida and M.G.H. Bell. Oxford: Pergamon-Elsevier, 45-59. Nicholson, A.J. and Dante, A. (eds.). 2004. Proceedings of the Second International Symposium on Transportation Network Reliability (INSTR04). Department of Civil Engineering, University of Canterbury, Christchurch, New Zealand. Niemeier, D. A. 1997. Accessibility: an evaluation using consumer welfare. Transportation 24, 377-396. Primerano, F. 2003. Towards a policy-sensitive accessibility measure. Papers of the Australasian Transport Research Forum 27, paper no 35, CD-ROM. Wellington: Transit New Zealand. Richardson, A.J. and Taylor, M.A.P. 1978. A study of travel time variability on commuter journeys. High Speed Ground Transportation Journal 12 (1), 7799. Sekhar, S.V.C. and Taylor, M.A.P. 2005. GIS approach to understanding the relationship between road network accessibility and socio-economic indicators. Proc 4th Asia Pacific Transport and Environment Conference. Xian, PRC. November. Taylor, M.A.P. 1982. Travel time variability – the case of two public modes. Transportation Science 16 (2), 517-521. Taylor, M.A.P. 1999. Dense network traffic models, travel time reliability and traffic management II: Application to reliability. Journal of Advanced Transportation 33 (2), 235-251. Taylor, M.A.P. 2000. Using network reliability concepts for traffic calming – permeability, approachability and tortuosity – in network design. In Reliability of Transport Networks. Edited by M.G.H. Bell and C. Cassir. Baldock, Herts: Research Studies Press, 217-242. Taylor, M.A.P. and D’Este, G.M. (2004a). Critical infrastructure and transport network vulnerability: developing a method for diagnosis and assessment. Proceedings of the Second International Symposium on Transportation Network Reliability (INSTR04). Christchurch, August. Department of Civil Engineering, University of Canterbury, 96-102. Taylor, M.A.P. and D’Este, G.M. 2004b. Safeguarding transport networks: assessment of network vulnerability and development of remedial measures. Australian Journal of Multidisciplinary Engineering, Special Edition on Engineering a Secure Australia, 13-22. Van Zuylen, H.J. 2004. The effect of irregularity of travel times on departure time choice. Proceedings of the Second International Symposium on Transportation Network Reliability (INSTR04). Christchurch, August. Department of Civil Engineering, University of Canterbury, 253-259. Weibull, J.W. 1976. Axiomatic approach to the measurement of accessibility. Regional Science and Urban Economics 6, pp.357-379. Yang, H., Lo, H.K. and Tang, W.H. 2000. Travel time versus capacity reliability of a road network. In Reliability of Transport Networks. Edited by M.G.H. Bell and C. Cassir. Baldock, Herts: Research Studies Press, 119-138.