Exam room wait. 0. 15. 146. Total Clinic. 17. 63. 229. *Checkout/Charting and Post-Checkout durations were not recorded. The challenge to PIP was to introduce ...
Proceedings of the 2001 Winter Simulation Conference B. A. Peters, J. S. Smith, D. J. Medeiros, and M. W. Rohrer, eds.
A DISCRETE-EVENT SIMULATION APPLICATION FOR CLINICS SERVING THE POOR Christos Alexopoulos David Goldsman
John Fontanesi Mark Sawyer Michelle De Guire David Kopald Kathy Holcomb
School of Industrial and Systems Engineering Georgia Institute of Technology Atlanta, GA 30332-0205, U.S.A.
Department of Community Pediatrics University of California, San Diego La Jolla, CA 92093-0927, U.S.A.
the inactivated polio vaccine, IPV), two new vaccines, four recommended schedule changes, and one vaccine warning (CDC 2000). The opportunities and insights afforded by simulation software in meeting such challenges have not been lost on healthcare administrators. Simulation has been used to analyze purchasing decisions and financial risks, (Dowless 1997, Hampshire and Rosborough 1993) personnel training (Diomidous et al. 1998, Downs et al. 1999), staffing and resource optimization (Asa et al. 1995, Saunders et al. 1989, Vogt et al. 1994). More recently, simulation software has been used to support quality improvement initiatives (Boxerman 1996, Slovensky and Morin 1997). Simulation has traditionally been used in large hospital settings and well-funded institutions with substantial resources and highly skilled personnel (Karys 1998, Krakauer et al. 1998). Yet some of the greatest possibilities in terms of promoting high-quality patient care exist in those medical offices serving the poorest and neediest of our citizens.
ABSTRACT Healthcare management operates in an environment of aggressive pricing, tough competition, and rapidly changing guidelines. Computer simulation models are increasingly used by large healthcare institutions to meet these challenges. However, small healthcare facilities serving the poor are equally in need of meeting these challenges but lack the finances and personnel required to develop and implement their own simulation solutions. An academic medical center, healthcare facilities that serve the poor, and the local public health department formed a unique partnership to create low-cost tools to meet these challenges. This article describes the creation of a low-cost, generic, discrete-event simulation model populated by a workflow observation Excel spreadsheet that can be completed by clinic staff themselves, thus “customizing” the simulation model for their own purposes. This initial model focuses on childhood immunization delivery services; the intent is to develop a tool flexible enough to serve other health services delivery needs as well. 1
2
SETTING
The Partnership of Immunization Providers (PIP) is a collaborative public/private project created by the University of California, San Diego (UCSD) School of Medicine, Division of Community Pediatrics, in association with community clinics and small, private provider practices and funded by the Centers for Disease Control and Prevention. PIP is a healthcare delivery research enterprise with special emphasis on developing affordable and practical quality preventative health methodologies within those healthcare facilities serving the poorest and neediest of our nation. These partner clinics serve people living in areas known to have lower-than-average immunization rates, high unemployment, and ethnic diversity. These communities are federally designated as Health Professional Shortage Areas. PIP has applied multi-faceted strategies targeting pro-
INTRODUCTION
Healthcare management operates in a “high velocity” environment of aggressive price competition, rapid technological advancements, and frequent changes in standards. Meeting the challenges of such a swiftly changing environment requires rapid response in identifying critical system processes, recognition of all relevant resources, access to real-time information, and the capacity to analyze “what if” scenarios (Stepanovich and Uhrig 1999). The challenges healthcare managers face are well illustrated by primary care activities such as the delivery of childhood immunization. Within the past five years, pediatric providers have addressed five changes in existing vaccine agents (e.g., switching from the oral polio vaccine, OPV, to
1386
Alexopoulos, Goldsman, Fontanesi, Sawyer, De Guire, Kopald, and Holcomb Table 2: Frequencies of Related Events Number Frequency out of n Parents brought child’s 171 of 259 66.0% immunization record to the visit
vider practice, immunization-tracking capability, linkage to a computerized county tracking system, residency immunization curriculum, and quality improvement systems. The intent of the PIP collaborative is to build sustainable interventions, tools, and strategies that can be used by the clinics themselves and generalized to other healthcare settings, including managed care. 3
Event
Parents were asked at check-in for immunization record Insurance information updated
PROBLEM
Clinics serving the indigent and working poor face unique organizational and administrative issues beyond those of a typical medical complex. The physical plants are often donated facilities such as churches or motels. Clientele, while certainly caring about their health, are faced with financial and transportation issues that minimize the control they have over their lives and their ability to make scheduled appointments. Payments are minimal and the clinics often survive on subsidies and grants to keep their doors open. The medical personnel attracted to such facilities are motivated more by altruism than finances. These circumstances are exacerbated by the transition in federal entitlement health insurance programs from a fee-for-service model to a managed-care model using capitation rates. The latter places implicit emphasis on efficiency, documentation of services rendered, and an expectation that preventative health activities, such as immunizations, will occur at a high incidence rate. The organizational reality for these clinics is one of high variability (Tables 1 and 2). Clinic administrators who previously tended to focus on provider productivity are now becoming aware that they are faced with classic industrial engineering resource management issues.
Accuracy of patient contact information not verified Patient’s chart not available for review before entry into the exam room Immunization records not reviewed during the exam Number of patients who received immunizations Encounter data not sent to billing on the same day 4
Check In Waiting Room and Pre-Exam Total exam room Patient/ provider contact Exam room wait Total Clinic
Median (minutes) 5 19
Maximum (minutes) 197 94
2 0
30 13
163 76
0 17
15 63
146 229
25.1%
227 of 259
87.6%
124 of 259
47.9%
91 of 259
31.1%
79 of 259
30.5%
105 of 259
40.5%
89 of 259
34.4%
SOLUTION
The first step in the process of improving clinic performance was to create a workflow data acquisition tool capable of being used by the type of personnel typically employed in community clinics. This application (including an electronic version) is described in a previous publication (Fontanesi et al. 2000). The OCPE (Observational Checklist of Patient Encounters) has been used to collect data for over 400 direct patient encounters to date. In these encounters, a trained PIP observer first obtained informed verbal consent from the parent or guardian of the patient. The PIP observer then followed the patient through the visit from check-in to checkout, utilizing the OCPE to record specific activities, services received by the patient, and the duration of stages within the visit. The second step was the decomposition of the collected data into functional relationships and a model of an ideal clinic operation. All activities and occurrences used for modeling were derived by fitting probability distributions to the data from OCPE. The model assumes five primary stages of clinic activity (Figure 1). These can be described as:
Table 1: Time Spent in Selected Stages of Visit* (n = 259) Minimum (minutes) 0 0
65 of 259
*Checkout/Charting and Post-Checkout durations were not recorded.
The challenge to PIP was to introduce industrial engineering concepts to organizations that prided themselves on being service-oriented, altruistic cultures. Computer simulation was seen by these investigators as a crucial tool in helping the clinics achieve a sense of resource utilization rather than a focus on provider productivity. Simulation provides a method of looking at system requirements and relationships rather than simply engaging in an endless series of symptom problem solving tasks.
A. Check-in: Customers with varying health needs and characteristics (walk-in, acute care, etc.) ar-
1387
Alexopoulos, Goldsman, Fontanesi, Sawyer, De Guire, Kopald, and Holcomb
B.
C. D.
E.
probability distributions used by the generic Arena model reflect each site’s actual operational conditions. Clinics are able to examine not only “as is” operational conditions but are able to run “what if” scenarios simply by altering factors of interest in the OCPE Excel spreadsheet.
rive at a clinic according to observed probability distributions (for interarrival times and deviations from scheduled appointment times). They register, verify their insurance, personal demographics, and appointment type. They are asked about any health documentation or records they might have (such as an immunization card). Waiting room and pre-exam: The patient stays in a waiting room and/or may have height, weight, and temperature taken before an exam room is ready. Exam: Actual clinic activities occur. Checkout and charting: The patient leaves the exam room, goes to the checkout area, then exits. Charting of activities, health data, and the documentation of future needs occur during this stage. Post-checkout: This step involves the processing of data collected during the clinical encounter and includes preparation for the next encounter with the patient.
5
TECHNICAL ISSUES
The modeling process brought up a number of interesting technical challenges. These can broadly be described in terms of input-distribution analysis, process-flow assessment, and output data analysis. The three broad issues are now discussed in turn. 5.1
Input Analysis
A number of critical input random variables drive the simulation. These include random variables corresponding to customer interarrival times (by patient type); patient processing times at all of the relevant stations within the clinic; patient, nurse, and provider travel times between stations; and probabilities of successfully completing certain tasks, such as proper verification of insurance, proper scheduling of subsequent patients, etc. Thanks to OCPE, the user has some access to empirical distributional data and can use this data to drive the simulation directly. For instance, the software provides the ability to generate unscheduled customer arrivals (such as walk-ins) based on interarrival times from “common” (e.g., exponential) or empirical distributions, or from nonhomogeneous Poisson arrival processes with estimated arrival rates (Law and Kelton 2000, Chapter 8). The same goes for the random deviations of scheduled patient arrivals from their corresponding appointment times — these deviations are typically non-normal (Fontanesi et al. 2001). Another example involves the use of empirical samples to supply task probabilities such as those described above. If the user is not willing to evoke empirical distributions, the software provides the option of using “standard” distributions, e.g., the exponential distribution to model service times, the normal to generate certain travel times, etc. All of these distributions are readily accessible in Arena, although the user is obliged to specify various distribution parameters, e.g., the mean and variance of the normal distribution, or the success probability for Bernoulli trials. In any case, the PIP software package allows for a great deal of flexibility in the selection of input distributions.
These stages involve internally consistent activities, personnel, and functions, the product of which has bearing on the successful completion of activities embedded in the other stages. For example, failure to collect or verify contact demographic information during the check-in stage could affect billing and reminder/recall functions in the postcheckout stage. Failure to initiate appointment reminders increases the likelihood of patient “no-shows” (Beckett et al. 2000, Cichon 1999, Rapsilber and Anderson 2000). The third step was the creation of a generic discreteevent simulation program, based on the PIP idealized workflow model, using the Arena discrete-event simulation language (Arena 2001). Arena is a widely accepted language, popular in academic, service, and industry settings. The package has been used to model emergency rooms, maternity wards, and other medical applications, but had never been used to model generically the operations of clinics such as those with which PIP is involved. PIP theorized that clinic management required an application graphically illustrating (1) patient, information, and personnel flows through the system, (2) any developing bottlenecks, and (3) continuous updating of system statistics (e.g., number of patients currently in the system and number of incorrectly processed patients). Further, PIP required an easy-to-use front-end to the simulation in order to allow administrators to change critical parameters (e.g., number of providers, average time needed to give an immunization, etc.) during the course of various “what if” analyses. Finally, due to severe cost restrictions, PIP needed the run-time versions of the application to be provided to the participating clinics at no charge. The final step was the merging of the OCPE with the Arena model. Since the OCPE is based on direct workflow characteristics obtained at the individual clinic sites, the
5.2
Process Flow
This phase of the simulation was earlier described as a generic five-step process: check-in; waiting room and preexam; exam; checkout and charting; and post-checkout. Of course, reality dictates that the model must provide the ability to handle a variety of possible movement patterns
1388
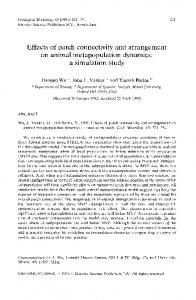
Alexopoulos, Goldsman, Fontanesi, Sawyer, De Guire, Kopald, and Holcomb Patient may schedule an appointment for a clinic visit either as needed or as a scheduled follow-up during a previous encounter. NOTE: Patient may or may not have a scheduled appointment established prior to clinic Check-In.
Appointment Processing
Chart Check-In IZ Record
Patient presents at clinic for services. Visit types are categorized as follows: • Scheduled Acute (with appointment) • Scheduled Well-Child (with appointment) • Follow-Up (may or may not have a scheduled appointment) • Walk-In (without appointment) During the Check-In, information is gathered to update the patient records and to prepare clinic notes for the provider to document activities performed during the exam. Immunization (IZ) record may be requested.
Patient is placed in a waiting area to be called into the exam room. During this “wait time” the clinic personnel may review records to determine immunization status, request outside medical records, and “flag” the chart that immunizations are needed.
Pre-Exam
Patient is called into the exam room where the provider(s) perform the needed medical services.
Exam
Provider(s) document in the patient’s chart medical services performed along with any other pertinent notations. Referral(s) to other provider(s) may result from the exam of the patient. Referral
Checkout
PostCheckout
Patient’s parent may schedule the next appointment.
Patient’s chart is sent to billing office.
Figure 1: Idealized PIP Clinic Model for patients and clinic personnel. For example, patients sometimes make return visits to the waiting room, leave the system without completing exams, or travel back and forth to the business office. Further, doctors and nurses of-
ten handle multiple patients simultaneously; it is certainly common practice to travel between exam rooms if a patient in one exam room cannot be served until pertinent test results are available.
1389
Alexopoulos, Goldsman, Fontanesi, Sawyer, De Guire, Kopald, and Holcomb 5.3
Boxerman, S. B. 1996. Simulation modeling: A powerful tool for process improvement. Best Practices and Benchmarking in Healthcare, 1(3):109–117. Centers for Disease Control and Prevention. 2000. Epidemiology and Prevention of Vaccine-Preventable Diseases (Pink Book). Department of Health and Human Services, Atlanta, GA. Cichon, T. 1999. Developing practical billing procedures for compliance. Home Healthcare Nurse Manager 3(3):10–16. Diomidous, M., I. Verginis, and J. Mantas. 1998. The construction of a simulation-based system for the development of powerful and realistic models and practicals for healthcare professionals. IEEE Transactions on Information Technology in Biomedicine 2(3):174–182. Dowless, R. M. 1997. Using activity-based costing to guide strategic decision making. Healthcare Financial Management 51(6):86, 88, 90. Downs, S. M., F. Marasigan, V. Abraham, B. Wildemuth, and C. P. Friedman. 1999. Scoring performance on computer-based patient simulations: Beyond value of information. In Proceedings/AMIA Symposium, 229(3):520–524. Fontanesi, J. M., M. De Guire, J. Chiang, K. Holcomb, and M. H. Sawyer. 2000. Application of workflow analysis tools in outpatient primary care settings. To appear in Journal of Quality Improvement. Fontanesi, J. M., C. Alexopoulos, D. Goldsman, M. H. Sawyer, M. De Guire, D. Kopald, and K. Holcomb. 2001. Non-punctual patients: Planning for variability in appointment arrival times. To appear in Journal of Medical Practice Management. Hampshire, D. A. and B. J. Rosborough. 1993. The evolution of decision support in a managed care organization. Topics in Health Care Financing 20(2):26–37. Karys, A. 1998. Ending the technology paradox: Healthcare management technologies for clinical decision making. Journal of Healthcare Information Management 12(3):25–32. Krakauer, H., M. J. Lin, E. M. Schone, D. Park, R. C. Miller, J. Greenwald, R. C. Bailey, B. Rogers, G. Bernstein, D. E. Lilienfeld, S. M. Stahl, R. S. Crawford, and D. C. Schutt. 1998. ‘Best clinical practice’: Assessment of processes of care and of outcomes in the U. S. Military Health Services System. Journal of Evaluation in Clinical Practice 4(1):11–29. Law, A. M. and W. D. Kelton. 2000. Simulation Modeling and Analysis, 3rd edition. New York: McGraw-Hill. Rapsilber, L. and E. Anderson. 2000. Understanding the reimbursement process. Nurse Practitioner 25(5):36. Saunders, C. E., P. K. Makens, and L. J. Leblanc. 1989. Modeling emergency department operations using advanced computer simulation systems. Annals of Emergency Medicine 18(2):134–140.
Output Analysis
Simulation output analysis is perhaps the most ignored phase of proper simulation methodology. The software automatically supplies information on patient throughput, server utilization, and queue build-ups, continuously updating for the user to see as the simulation run progresses. Since it is good statistical practice to run the same scenario of the simulation more than once, Arena also allows for multiple independent replications of the simulation to be performed. 6
LIMITATIONS
Although the Arena model may reflect an idealized clinic operation and is designed to be user friendly, clinic personnel probably will require some additional training to utilize the model, especially with respect to concepts of industrial engineering or quality improvement. Nevertheless, clinic administrators have already asked a number of “what if” questions, suggesting that the model facilitates thinking about the process of patient care rather than simply focusing on provider productivity. Examples of process queries include: assessing the impact of narrowing or expanding appointment slots on the likelihood that a patient shows “on time;” the impact of bilingual vs. monolingual staff on patient throughput times; factors likely to increase patients’ chances of leaving without completing their appointments; and the stage in clinic operation which presents the highest likelihood of reviewing the patient’s immunization status. ACKNOWLEDGMENT Parts of this article appeared in Alexopoulos et al. (2001). REFERENCES Alexopoulos, A., J. Fontanesi, D. Goldsman, D. Kopald, M. De Guire, K. Holcomb, and M. H. Sawyer. 2001. A discrete-event simulation application for clinics serving the poor, Proceedings of the Western MultiConference — Simulation in the Health and Medical Sciences 2001 (ed. J. G. Anderson and M. Katzper), 24–29, San Diego, CA: The Society for Computer Simulation International. Arena. 2001. Rockwell Software Corporation. Asa, A.Y., M. W. Carter, and L. M. Nagle. 1995. A decision support system to meet the fluctuating needs of a hospital nursing unit. Medinfo 8 Pt 2(5):1418. Beckett, P., W. Spare, and J. Kirkland. 2000. Improved inpatient billing metrics by physician-directed billing software. Journal of Health Care Finance, 26(4):70–77.
1390
Alexopoulos, Goldsman, Fontanesi, Sawyer, De Guire, Kopald, and Holcomb Health Plans. He is the creator of the time-motion and workflow instrument, Observational Checklist of Patient Encounters (OCPE). His e-mail address is .
Slovensky, D. J. and B. Morin. 1997. Learning through simulation: The next dimension in quality improvement. Quality Management in Health Care 5(3):72– 79. Stepanovich, P. L. and J. D. Uhrig. 1999. Decision making in high-velocity environments: Implications for healthcare. Journal of Healthcare Management 44(3):197–204. Vogt, W., S. L. Braun, F. Hanssmann, F. Liebl, G. Berchtold, H. Blaschke, M. Eckert, G. E. Hoffmann, and S. Klose. 1994. Realistic modeling of clinical laboratory operation by computer simulation. Clinical Chemistry 40(6):922–928.
MARK H. SAWYER, M.D., is a Professor at the University of California, San Diego, in the School of Medicine. He is Principal Investigator of the Partnership of Immunization Providers. He is a recognized expert in pediatric infectious disease and lectures extensively throughout the world on vaccination issues. Other significant activities include research involving a variety of clinical trials, as well as research related to health services. Dr. Sawyer’s email address is .
AUTHOR BIOGRAPHIES
MICHELLE DE GUIRE, MSW, MPH, is Program Manager for the Partnership of Immunization Providers, one of four academic medical center, community health network grants from the Centers for Disease Control and Prevention. This five-year project has the express purpose of developing sustainable methods of immunization practice improvement. Ms. De Guire has also been Program Manager for diabetes and other chronic disease research programs. Her e-mail address is .
CHRISTOS ALEXOPOULOS is an Associate Professor in the School of Industrial and Systems Engineering at the Georgia Institute of Technology. He received his Ph.D. in Operations Research from the University of North Carolina at Chapel Hill. His research interests are in the areas of applied probability, statistics, and optimization of stochastic systems. His recent work involves problems related to the optimal design of telecommunications and transportation systems. Dr. Alexopoulos is a member of INFORMS and the INFORMS College on Simulation. He served as a Co-Editor for the Proceedings of the 1995 Winter Simulation Conference. His e-mail and web addresses are: , .
DAVID KOPALD, B.S., business analyst for the Partnership of Immunization Providers, is an ISO 9000 Quality Assurance expert with extensive quality assurance experience from commercial manufacturing and industry. He works directly with the Co-Investigator in charge of business process improvement research. Mr. Kopald is responsible for analyzing the data relating to the workflow analysis, time study analysis, stochastic modeling, as well as other business process improvement data that has been collected as part of PIP, a CDC-funded demonstration project. His e-mail address is .
DAVID GOLDSMAN is a Professor in the School of Industrial and Systems Engineering at the Georgia Institute of Technology. His research interests include simulation output analysis and ranking and selection. He also studies applications arising in the healthcare field. Dave has been an active participant in the Winter Simulation Conference — he is currently on the Board of Directors, and was the 1995 Program Chair and 1992 Associate Proceedings Editor. His e-mail and web addresses are , .
KATHY HOLCOMB, M.A., holds the position of Editor for the Partnership of Immunization Providers, and is responsible for editing, preparing, and facilitating production of manuscripts, grant proposals, reports, and other documents written or initiated by PIP Investigators, and for performing associated literature research. In addition to writing for publication, Ms. Holcomb has 12 years’ experience working in the laboratory as a staff research associate for the University of California, San Diego. Her e-mail address is .
JOHN FONTANESI, Ph.D., is an Associate Professor at the University of California, San Diego. He is CoInvestigator of the Partnership of Immunization Providers, directing business process improvement research within the project. Dr. Fontanesi has extensive experience in multi-agency collaboration in exploring health delivery research issues. His work has included collaboration between managed care and school health organizations; he is a recognized expert in operational research; he serves on a number of committees for managed care, public health, and the health industry, including chairing the Maternal and Child Health Committee for the American Association of
1391