This theoretical process to obtain a corrected PM10/TSP ratio will minimize the inherent ... By definition, PM10 and PM2.5 are particles with an aerodynamic.
790
2004 BELTWIDE COTTON CONFERENCES, SAN ANTONIO, TX – JANUARY 5-9 A THEORETICAL APPROACH TO CORRECTING PM10 OVERSAMPLING PROBLEM FOR AGRICULTURAL DUST Lingjuan Wang, Calvin B. Parnell, Jr., Bryan W. Shaw, Ronald E. Lacey, Barry L. Goodrich, and Sergio C. Capareda Center for Agricultural Quality Engineering and Science (CAAQES) Department of Biological and Agricultural Engineering Texas A&M University College Station, TX Michael D. Buser USDA/ARS Cotton Production and Processing Research Unit Lubbock, TX Abstract The FRM ambient PM10 sampler does not always measure the true PM10 concentration. There are inherent sampling errors associated with the PM10 samplers due to the interaction of particle size distribution and sampler performance characteristics. These sampling errors, which are the relative differences between theoretical estimation of the sampler concentration and the true concentration, should be corrected for equal regulation between industries. An alterative method of determines true PM10 concentration is to use the TSP concentration and PM10 fraction of PSD in question. This paper reports a new theoretical method to correct PM10 sampling errors for a true PM10/TSP ratio. The new method uses co-located PM10/TSP samplers’ measurement to derive the MMD of PSD and true PM10/TSP ratio. Correction equations and charts have been developed for the PM's with GSD's of 1.2, 1.3, ... 2.1, respectively and the PM10 sampler with a cut-point of 10 μm and slope of 1.5. These equations and charts can be used to obtain a corrected PM10/TSP ratio for the given GSD and sampler characteristics. The corrected PM10/TSP ratio will be treated as true PM10/TSP ratio for PM10 concentration calculations. This theoretical process to obtain a corrected PM10/TSP ratio will minimize the inherent PM10 sampler errors and will provide more accurate PM10 measurement for the given condition. Introduction PM10 and PM2.5 are both listed as criteria pollutants in the national Ambient Air Quality Standards (NAAQS) and are regulated as indicators of particulate matter (PM) pollutants. By definition, PM10 and PM2.5 are particles with an aerodynamic equivalent diameter (AED) less than or equal to a nominal 10 and 2.5 micrometers, respectively. The regulation of PM is based upon the emission concentration of PM10 / PM2.5 measured by Federal Reference Method (FRM) PM10 and PM2.5 samplers. The pre-separators of the EPA approved samplers are not 100% efficient. As might be expected, there are errors in the measurement of PM10 and PM2.5. The accuracy of the concentration measurements of PM10 and PM2.5 has been challenged. In fact, it has been reported that the use of Federal Reference Method PM10 samplers to measure emission concentrations of particulate matter having a particle size distribution (PSD) with a mass median diameter (MMD) larger or smaller than 10 μm AED results in significant sampling error – over-sampling or under-sampling, respectively (Buser et al. 2001, Pargmann et al. 2001, Wang et al. 2003). This sampling error is the estimation of the difference between sampler concentration and the true PM10 concentration. The pre-separator (true cut) of true PM10 sampler would theoretically remove all particles larger than 10 μm, allowing all PM less than 10 μm to penetrate to the filter. It is currently impossible to obtain a true cut. Typically, PM10 pre-separators are assumed to have performance characteristics (fractional efficiency curve, FEC) that can be described by a cumulative lognormal probability distribution with a cut point (d50) and slope. The cut-point is the AED of the particle size collected with 50% efficiency and the slope of the fractional efficiency curve of the pre-collector is the ratio of the 84.1% and 50% particle sizes (d84.1/d50) or the ratio of the 50% and 15.9% particle sizes (d50/d15.9) or the square root of the ratio of (d84.1/d15.9) from the FEC. The FRM performance standard for samplers is a cut-point of 10 ± 0.5 μm with a slope of 1.5 ± 0.1 (U. S. EPA 40CFR53, 2000). Buser et al. (2001) reported that PM10 sampler measurements might be 139 to 343% higher than the true PM10 concentration if the pre-collector operates within the designed FRM performance standards sampling PM with a MMD of 20 μm and geometric standard deviations (GSD) of 2.0 and 1.5, respectively. The research results indicated inherent PM10 sampling errors associated with PM10 sampler due to the interaction of particle size and sampler performance characteristics. Moreover, Pargmann et al. (2001) and Wang et al (2003) reported shifts in pre-separators cut points when exposed to PM larger than the designed cut point of the samplers.
791
The inherent PM10 sampler errors due to the interaction of the sampler performance and PSD characteristics result in an unequal regulation between various industries. Since the intent of PM regulations is to protect public health; then, all the industries should be equally regulated. To achieve equal regulation among different industries, which emit PM with different MMD's and GSD's, PM10 measurements must be corrected to account for the PM10 sampler’s inherent errors. Besides PM10 sampler’s measurement, there is an alternative way to determine PM10 concentration by combining measurements of total suspended particulate (TSP) concentration and PSD of the PM in question. The true PM10 concentration equals the TSP concentration times the mass fraction of PM less than or equal to 10 μm from PSD. This alternative way of determining PM10 concentration leads to a theoretical method to correct PM10 sampler errors, which is to use co-locating PM10/TSP samplers’ measurements to derive a PSD of the PM, and thus to obtain the true PM10 fraction of the PSD for the true PM10 concentration calculation (Parnell et al, 2003). A more in-depth discussion of this approach to correcting PM10 sampling errors will be address herein. New Theoretical Approach to Correcting PM10 Sampling Errors Science Behind the New Theoretical Approach PM Particle Size Distribution. One of the most important characteristics of suspended particles is the size distribution of the particles. “Hinds (1999) states that lognormal distribution is used extensively for aerosol size distributions because it fits the observed size distributions reasonably well”. A lognormal distribution, which is normal distribution with respect to ln(dp), can be characterized by two parameters: MMD and GSD. The frequency function of a lognormal mass distribution in term of the particle size dp can be expressed as:
(
)
ª − ln d − ln(MMD ) 2 º p » dd p exp « 2 « » 2π * d p * ln(GSD ) 2 ln GSD ( ( ) ) ¬ ¼ 1
df =
(Hinds, 1999)
(1)
The GSD is a dimensionless quantity with a value greater than 1.0. It is defined by: 1
GSD =
d 84.1 MMD § d 84.1 · 2 = =¨ ¸ MMD d 15.9 ¨© MMD ¸¹
(Hinds, 1999)
(2)
where: d84.1 = diameter where particles constituting 84.1% of total mass of particles are smaller than this size MMD = mass median diameter of PSD, and d15.9 = diameter where particles constituting 15.9% of total mass of particles are smaller than this size The particle size distribution can also be described as a cumulative distribution Fx, which gives the mass fraction of all the particles with diameters less than X. Theoretically; the cumulative distribution function is presented as:
(
)
ª − ln d − ln(MMD ) 2 º p » dd p = F d p , MMD , GSD (Hinds, 1999) exp « 2 « » 2 ln GSD ( ( ) ) 0 2π * d p * ln(GSD ) ¬ ¼ x
Fx = ³
1
(
)
(3)
Based upon equation 3, the true mass fraction of PM10, also known as true (PM10/TSP) ratio, can be determined as follows:
(PM 10
10
/ TSP )true = ³
0
(
)
ª − ln d − ln(MMD ) 2 º p » dd p exp « 2 « » 2π * d p * ln(GSD ) 2 ln GSD ( ( ) ) ¬ ¼ 1
(4)
PM10 Sampler Performance Characteristics. A sampler’s performance is generally described by its fractional efficiency curve or fractional penetration curve. A fractional efficiency curve is a description of the efficiency of which a particle with a selected diameter will be captured by the pre-separator. The fractional efficiency curve is most commonly represented by a cumulative lognormal distribution with a cut–point and a slope. The cut-point, also known as d50, is the particle size where 50% of PM is captured by the pre-separator and 50% of the PM will penetrate to the filter. The slope is the ratio of the 84.1% and 50% particle size (d84.1/d50) or the ratio of the 50% and 15.9% particle size (d50/d15.9) or the square root of the ratio of
792
(d84.1/d15.9) from the fractional efficiency curve. The mathematical expression of a sampler’s fractional collection efficiency curve is as follows:
(
)
ª − ln d − ln d 2 º p 50 » dd p = η d p , d 50 , slope exp « 2 « » ( ) 2 ln slope ( ( ) ) 0 2π * d p * ln slope ¬ ¼ x
ηx = ³
1
(
)
(5)
In the equation 5, ηx is the sampler collection efficiency for particles with diameters less than X. Based upon this sampler fractional collection efficiency curve; the sampler fractional penetration curve can be mathematically expressed as:
(
)
ª − ln d − ln d 2 º p 50 » dd p P d p , d 50 , slope = 1 − η d p , d 50 , slope = 1 − ³ exp « « 2(ln(slope ))2 » 0 2π * d p * ln(slope ) ¬ ¼
(
)
(
x
)
1
(6)
The measured (PM10/TSP) ratio, also referred to as the sampled mass fraction of PM10, can be theoretically estimated by combining particle size distribution (equation 1) and the sampler’s performance characteristics (equation 6) as follows:
(PM 10
∞
(
)
/ TSP )measured = ³ f ( d p , MMD , GSD )* P d p , d 50 , slope dd p (Buser, et al., 2002) 0
(7)
Over-Sampling Rate and True PM10/TSP Ratio Calculations. The sampling error, also referred to as over-sampling rate (OR) hereby, is the relative differences between theoretical estimation of the sampler concentration and the true concentration and is defined by equation 8. The negative over-sampling rate indicates an under-sampling problem. § Measured · (PM 10 / TSP )measured OR = ¨ − 1¸ = − 1 (Buser, et al., 2002) (PM 10 / TSP )true © True ¹ ∞
(PM 10 / TSP )measured OR + 1 = (PM 10 / TSP )true
(
) (
(8)
)
³ f d p , MMD , GSD * P d p , d 50 , slope dd p
=
0 10
³
0
(
)
ª − ln d − ln(MMD ) 2 º 1 p » dd p exp « 2 « » 2π * d p * ln(GSD ) ( ( ) ) 2 ln GSD ¬ ¼
(9)
Equation 9 (Buser et. al, 2002) is the theoretical model to determine the sampling error, which will be used in the iteration process to derive true (PM10/TSP ratio). However, there are four unknowns (MMD, GSD, d50 and slope) in the equation 9. It has been assumed in this research that PM10 sampler has a cut-point of 10 μm and slope of 1.5. Then, equation 9 can be used to calculation over-sampling rate for a given MMD and GSD. For the iterating process to derive true (PM10/TSP ratio), equation 8 can be rewritten as:
(PM 10
/ TSP )true =
(PM 10
/ TSP )measured OR + 1
(10)
PM10 Concentration Calculation. One way to determining PM10 concentration is to combine co-locating PM10/TSP samplers’ measurements to derive true PSD of the ambient PM, and thus to obtain true PM10 fraction of PSD for the true PM10 concentration calculation as follow:
(Con.PM 10 )true = (PM 10
/ TSP )true * Con.TSP
where: (Con. PM10)true = true PM10 concentration and, Con. TSP = Measured TSP concentration
(11)
793
Theoretical Iterating Process to Derived True PM10/TSP Ratio Using Co-Located PM10 and TSP Measurements A theoretical iterating process to derive the true PM10/TSP ratio using co-located PM10 and TSP measurement has been developed. This theoretical process is one way to correct PM10 inherent sampling errors associated with agricultural dust, which has MMD greater than 10 μm. To illustrate this new theoretical process, it is assumed that a PM10 sampler has cut-point of 10 μm and slope of 1.5. The iterating process was conducted for measured PM10/TSP ratios of 10%, 20%, … 80% and GSD of 1.2, 1.3, … 2.1. Table 1 shows an example of this work. The following is the outline of this process: Obtain co-located PM10, TSP concentration measurement and take the ratio of their concentrations as a cumulative mass percentage (R1%) of PM10 in the PSD, which is Measured (PM10/TSP) = R1% 2. Fit the R1% of PM10 into lognormal distribution with given GSD to obtain MMD1, which is the MMD without correction 3. Theoretically calculate the PM10 sampler (with given d50 and slope) over-sampling rate (OR1%) for MMD1 (equation 9) 4. Go to equation 10 to obtain new mass percentage of PM10 (R2%), which is R2% = R1% / (1+ OR1%) 5. Fit the R2% of PM10 into lognormal distribution with given GSD to obtain MMD2 6. Theoretically calculate the PM10 sampler (with given d50 and slope) over-sampling rate (OR2%) for MMD2 (equation 9) 7. Go to equation 10 to obtain new mass percentage of PM10 (R3%) R3% = R1% *(1+ OR2%) 8. Fit the R3% of PM10 into lognormal distribution with given GSD to obtain MMD3 9. Repeat the process until MMD n +1 − MMD n < 0.05 μm 10. MMDn+1 is the corrected MMD with the mass fraction of PM10 as corrected (PM10/TSP) ratio, which is Corrected (PM10/TSP) = Rn+1% = R1% *(1+ ORn%)
1.
Results and Discussions Table 2 lists the results of this theoretical iteration process used to derive a MMD and (PM10/TSP) ratio of ambient PM by using PM10 and TSP co-locating measurements for the correction of the PM10 over-sampling problem. Figures 1-10 illustrate the relationship of measured (PM10/TSP) ratio and corrected (PM10/TSP) ratio. Theoretical correction equations are also included in these figures to obtain corrected PM10/TSP ratio. Figure 11 is the summary of the figures1-10. It can be used as a correction chart for corrected (PM10/TSP) measurement. The results listed in table 2 suggest that: • • • • •
PM10 over-sampling problem occurs only when MMD is greater than 10 μm. The greater MMD, the higher sampling error PM10 over-sampling errors increase with decrease of GSD The correction factors (K) for true (PM10 /TSP) ratio listed in the table 2 and the slopes of the correction curves in the figure 11 indicated that GSD has more impact on PM10 over-sampling error than MMD does. The correction factors (K) for true (PM10 /TSP) ratio listed in the table 2 also indicate that PM10 sampling error is not as great for urban dust that typically has MMD of 6.5 μm, as for agricultural dust, which typically has MMD of 20 μm.
The final goal of this research is to find a way to obtain an accurate PM10 concentration measurement. The following is the outline to apply the results of this research for PM10 measurement assuming that PM10 sampler has a cut-point of 10 μm and GSD of 1.5: 1. 2. 3. 4. 5.
Obtain co-located PM10, TSP concentration measurements Take the ratio of PM10/TSP concentration as mass fraction of PM10 Use equations in the figures 1-10 to calculate corrected (PM10/TSP) ratio, or go to the correction chart in the figure11 to obtain corrected (PM10/TSP) for the PM with given GSD Treat corrected (PM10/TSP) ratio as true (PM10/TSP) ratio Use equation 11 to calculate PM10 concentration Summary
The FRM ambient PM10 sampler does not the measure true PM10 concentration under certain conditions. There are inherent sampling errors associated with the PM10 samplers due to the interaction of particle size distribution and sampler performance characteristics. These sampling errors, which are the relative differences between theoretical estimation of the sampler concentration and the true concentration, should be corrected for equal regulation among all industries. An alterative method of determines true PM10 concentration is to use the TSP concentration and PM10 fraction of PSD in question.
794
This paper reports a new theoretical method to correct PM10 sampling errors for a true PM10/TSP ratio. The new method uses co-located PM10/TSP samplers’ measurement to derive the MMD of PSD and true PM10/TSP ratio. Correction equations and charts have been developed for the PM's with GSD's of 1.2, 1.3, ... 2.1, respectively and the PM10 sampler with a cut-point of 10 μm and slope of 1.5. These equations and charts can be used to obtain a corrected PM10/TSP ratio for the given GSD and sampler characteristics. The corrected PM10/TSP ratio will be treated as true PM10/TSP ratio for PM10 concentration calculations. This theoretical process to obtain a corrected PM10/TSP ratio will minimize the inherent PM10 sampler errors and will provide more accurate PM10 measurement for the given condition. Future Work There are several limitations to apply the results from this research. First of all, the correction equations and charts are only valid for the PM10 sampler with a cut-point of 10 μm and slope of 1.5. Since the FRM performance standard for PM10 sampler is a cut-point of 10 ± 0.5 μm with a slope of 1.5 ± 0.1 (U. S. EPA 40CFR53, 2000), more correction charts are needed for the samplers with cut-point other than 10 μm, such as 9.5 μm or 10.5 μm and slope other than 1.5, such as 1.4 or 1.6. Moreover, the shifts in cut-point have been reported (Parmann et al., 2001, Wang et al., 2003). Further work is needed for the correction of PM10 sampling error with the cut-point shifting problem by using the method developed in this research. Also, the new method can be adapted for the correction of PM2.5 sampler errors. References Buser, M., C. B. Parnell, Jr., B. W. Shaw and R. E. Lacey. 2002. PM10 sampler errors due to interaction of particle size and sampler performance characteristics. Proceedings of the 2002 Beltwide Cotton Production Conferences. National Cotton Council. Memphis, TN Buser, M., C. B. Parnell, Jr., R. E. Lacey and B. W. Shaw. 2001. Inherent biases of PM10 and PM2.5 samplers based on the interaction of particle size and sampler performance characteristics. Paper No. 01-1167 present at the 2001 ASAE Annual International Meeting in Sacramento, CA, St. Joseph, MI Hinds, W.C. 1999. Aerosol Technology: Properties, Behavior, and Measurement of Airborne Particles, 2nd Edition. New York: John Wiley & Sons, Inc. Pargmann, A. R., C. B Parnell, Jr. and B. W. Shaw. 2001. Performance characteristics of PM 2.5 samplers in the presence of agricultural dusts. Paper No. 014008, presented at the 2001 ASAE Annual International Meeting in Sacramento, CA Parnell, C.B. Jr., B.W. Shaw, L. Wang, S.C. Capareda. 2003. Particle Size Distributions of Emitted by Agricultural Operations – Impacts on FRM PM10 and PM2.5 Concentration Measurements. Paper presented for selected EPA staff during the Third International Conference on Air Pollution from Agricultural Operations, Sheraton Imperial Hotel and Convention Center, Research Triangle Park, North Carolina, October 12-15, 2003, Sponsored by the American Society of Agricultural Engineers (ASAE), St Joseph, MI. U. S. Environmental Protection Agency. 2000. 40CFR Part 53 National Ambient Air Quality Standards for Particulate Matter; Final Rule. Federal Register Vol. 65, No. 249. USEPA, Washington, D.C. Wang, L., J.D. Wanjura, C.B. Parnell, R.E. Lacey, B.W. Shaw, 2003. Performance characteristics of Low-Volume PM10 inlet and TEOM continuous PM sampler. Paper No. 034118, presented at the 2003 ASAE Annual International Meeting in Las Vegas, NV
795
Table 1. An example of the iterating process to derive PSD of PM by using co-located PM10 and TSP samplers’ measurements for PSD’s with GSD=2 (assuming PM10 sampler has cut-point of 10 μm and slope of 1.5) Measured Con. Measured Con. Measured Con. TSP sampler PM10 sampler Measured PM10/TSP
100 30 30%
μg/m3 μg/m3 Derived MMD 14.378
TSP sampler PM10 sampler Measured PM10/TSP
100 20 20%
μg/m3 μg/m3 Derived MMD 17.89
TSP sampler PM10 sampler Measured PM10/TSP
100 10 10%
μg/m3 μg/m3 Derived MMD 24.30
if MMD=14.378 if MMD=17.89 if MMD=24.30 measured/true ratio=108.46% measured/true ratio=116.81% measured/true ratio=134.29% st st Corrected 1st Derived MMD Corrected 1 Derived MMD Corrected 1 Derived MMD PM10/TSP PM10/TSP PM10/TSP 15.0782 19.2817 27.07 27.66% 17.12% 7.45% if MMD=15.078 if MMD=19.2817 if MMD=27.07 measured/true ratio=110.03% measured/true ratio=120.39% measured/true ratio=142.53% nd nd Corrected 2nd Derived MMD Corrected 2 Derived MMD Derived MMD Corrected 2 PM10/TSP PM10/TSP PM10/TSP 15.2017 16.61% 19.56 27.66 27.27% 7.02% if MMD=15.2017 if MMD=19.56 measured/true ratio=110.32% measured/true ratio=121.12% rd Corrected 3rd Derived MMD Corrected 3 Derived MMD PM10/TSP PM10/TSP 15.2273 19.61 27.19% 16.51%
if MMD=27.66 measured/true ratio=144.33% rd Corrected 3 Derived MMD PM10/TSP 27.79 6.93%
if MMD=15.2273 if MMD=19.61 measured/true ratio=110.37% measured/true ratio=121.26% th Corrected 4th Derived MMD Corrected 4 Derived MMD PM10/TSP PM10/TSP 15.2306 19.63 27.18% 16.49%
if MMD=27.79 measured/true ratio=144.72% th Corrected 4 Derived MMD PM10/TSP 27.82 6.91%
if MMD=19.63 if MMD=27.82 measured/true ratio=121.31% measured/true ratio=144.82% Corrected 5th Derived MMD Corrected 5th Derived MMD PM10/TSP 16.49% 19.63 PM10/TSP 6.91% 27.82
796
Table 2. Summary of derived PSD’s and theoretical correction factors (K) for true (PM10 /TSP) ratio (assuming sampler d50 = 10 μm, slope = 1.5) GSD = 1.2 Measured Derived MMD Derived MMD PM10/TSP without correction with correction 10% 12.63 17.65 20% 11.66 14.59 30% 11.00 12.57 40% 10.47 11.17 50% 10.00 10.00 60% 9.55 8.94 70% 9.08 7.92 80% 8.58 5.52
Corrected PM10/TSP 0.0916% 2.00% 10.52% 27.13% 50.00% 73.05% 89.95% 100.00%
GSD = 1.4 Measured Derived MMD Derived MMD PM10/TSP without correction with correction 10% 15.39 19.53 20% 13.27 15.56 30% 11.93 13.14 40% 10.89 11.42 50% 10.00 10.00 60% 9.18 8.76 70% 8.38 7.59 80% 7.53 6.42
Corrected PM10/TSP 2.30% 9.44% 20.78% 34.65% 50.00% 65.41% 79.42% 90.63%
GSD = 1.6 Measured Derived MMD Derived MMD PM10/TSP without correction with correction 10% 18.24 22.10 20% 14.85 16.81 30% 12.78 13.83 40% 11.26 11.70 50% 10.00 10.00 60% 8.88 8.55 70% 7.82 7.22 80% 6.74 5.94
Corrected PM10/TSP 4.56% 13.37% 24.50% 36.92% 50.00% 63.10% 75.57% 86.68%
GSD = 1.8 Measured Derived MMD Derived MMD PM10/TSP without correction with correction 10% 21.23 24.95 20% 16.37 18.20 30% 13.60 14.53 40% 11.61 11.98 50% 10.00 10.00 60% 8.62 8.35 70% 7.35 6.88 80% 6.10 5.49
Corrected PM10/TSP 5.98% 15.36% 26.22% 37.93% 50.00% 62.08% 73.79% 84.67%
K 109 9.97 2.85 1.47 1.00 0.82 0.78 0.80
GSD = 1.3 Derived MMD Derived MMD Corrected without correction with correction PM10/TSP K 13.99 18.30 1.01% 9.90 12.46 14.94 6.27% 3.19 11.47 12.75 17.69% 1.70 10.69 11.27 32.37% 1.24 10.00 10.00 50.00% 1.00 9.36 8.85 67.98% 0.88 8.72 7.77 83.27% 0.84 8.02 6.67 93.87% 0.85
K 4.35 2.12 1.44 1.15 1.00 0.92 0.88 0.88
GSD = 1.5 Derived MMD Derived MMD Corrected without correction with correction PM10/TSP K 16.79 20.79 3.53% 2.83 14.06 16.19 11.74% 1.70 12.36 13.49 22.99% 1.30 11.08 11.56 36.03% 1.11 10.00 10.00 50.00% 1.00 9.02 8.65 63.99% 0.94 8.09 7.40 77.08% 0.91 7.12 6.18 88.31% 0.91
K 2.19 1.50 1.22 1.08 1.00 0.95 0.93 0.92
GSD = 1.7 Derived MMD Derived MMD Corrected without correction with correction PM10/TSP K 19.72 23.50 5.36% 1.87 15.63 17.50 14.51% 1.38 13.20 14.18 25.50% 1.18 11.44 11.84 37.53% 1.07 10.00 10.00 50.00% 1.00 8.74 8.44 62.50% 0.96 7.57 7.05 74.53% 0.94 6.40 5.70 85.52% 0.94
K 1.67 1.30 1.14 1.05 1.00 0.97 0.95 0.94
GSD = 1.9 Derived MMD Derived MMD Corrected without correction with correction PM10/TSP K 22.75 26.31 6.50% 1.54 17.13 18.91 15.99% 1.25 14.00 14.88 26.76% 1.12 11.77 12.10 38.23% 1.05 10.00 10.00 50.00% 1.00 8.50 8.26 61.77% 0.97 7.14 6.72 73.24% 0.96 5.83 5.28 84.02% 0.95
GSD = 2.0 GSD = 2.1 Measured Derived MMD Derived MMD Corrected Derived MMD Derived MMD Corrected PM10/TSP without correction with correction K without correction with correction PM10/TSP PM10/TSP 10% 24.30 27.82 6.91% 1.45 25.77 29.40 7.23% 20% 17.89 19.63 16.49% 1.21 18.65 20.35 16.88% 30% 14.38 15.23 27.18% 1.10 14.75 15.57 27.51% 40% 11.92 12.25 38.48% 1.04 12.07 12.37 38.65% 50% 10.00 10.00 50.00% 1.00 10.00 10.00 50.00% 60% 8.39 8.16 61.54% 0.97 8.29 8.08 61.36% 70% 6.95 6.56 72.83% 0.96 6.78 6.42 72.49% 80% 5.58 5.09 83.52% 0.96 5.36 4.91 83.13% • MMD without correction: is the MMD derived from (PM10/TSP) measured by co-locating these two samplers • MMD with correction: is the MMD derived from corrected (PM10/TSP) ratio obtained through iterating process • Corrected PM10/TSP: is the PM10 fraction of PSD after correcting for over-sampling error through iterating process • K is the correction factor for PM10/TSP ratio, which is: K =(measured PM10/TSP) / Corrected PM10/TSP)
(12)
K 1.38 1.18 1.09 1.03 1.00 0.98 0.97 0.96
797
Corrected (PM10/TSP)
Measured (PM10/TSP) vs. Corrected (PM10/TSP) (d50=10 μm slope =1.5; GSD =1.2)
100% 90% 80% 70% 60% 50% 40% 30% 20% 10% 0%
y = -6.2066x3 + 9.3118x2 - 2.4312x + 0.1662 R2 = 0.9992
0%
10%
20%
30%
40%
50%
60%
70%
80%
90%
Measured (PM10/TSP)
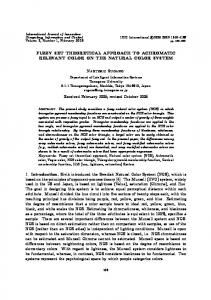
Figure 1. Relationship of measured PM10/TSP ratio and corrected PM10/TSP ratio for the PM with GSD=1.2. Measured PM10/TSP vs. Corrected PM10/TSP ((d50 =10 μm slope=1.5 GSD =1.3)
100%
Corrected (PM10/TSP)
90%
y = -3.5328x3 + 5.2743x2 - 0.8411x + 0.0465 R2 = 0.9999
80% 70% 60% 50% 40% 30% 20% 10% 0% 0%
10%
20%
30%
40%
50%
60%
70%
80%
90%
Measured (PM10/TSP)
Figure 2. Relationship of measured PM10/TSP ratio and corrected PM10/TSP ratio for the PM with GSD=1.3.
798
Corrected (PM10/TSP)
Measured PM10/TSP vs. Corrected PM10/TSP ((d50 =10 μm slope=1.5 GSD =1.4) 100% 90% 80% 70% 60% 50% 40% 30% 20% 10% 0%
y = 1.3303x - 0.1578 R2 = 0.9933
0%
10%
20%
30%
40%
50%
60%
70%
80%
90%
Measured (PM10/TSP)
Figure 3. Relationship of measured PM10/TSP ratio and corrected PM10/TSP ratio for the PM with GSD=1.4. Measured PM10/TSP vs. Corrected PM10/TSP ((d50 =10 μm slope=1.5 GSD =1.5)
100%
Corrected (PM10/TSP)
90%
y = 1.2585x - 0.1242 R2 = 0.9963
80% 70% 60% 50% 40% 30% 20% 10% 0% 0%
10%
20%
30%
40%
50%
60%
70%
80%
90%
Measured (PM10/TSP)
Figure 4. Relationship of measured PM10/TSP ratio and corrected PM10/TSP ratio for the PM with GSD=1.5.
799
Measured PM10/TSP vs. Corrected PM10/TSP ((d50 =10 μm slope=1.5 GSD =1.6)
100%
Corrected (PM10/TSP)
90%
y = 1.208x - 0.1002 R2 = 0.9978
80% 70% 60% 50% 40% 30% 20% 10% 0% 0%
10%
20%
30%
40%
50%
60%
70%
80%
90%
Measured (PM10/TSP)
Figure 5. Relationship of measured PM10/TSP ratio and corrected PM10/TSP ratio for the PM with GSD=1.6. Measured PM10/TSP vs. Corrected PM10/TSP ((d50 =10 μm slope=1.5 GSD =1.7)
90%
Corrected (PM10/TSP)
80% y = 1.1723x - 0.0832 R2 = 0.9986
70% 60% 50% 40% 30% 20% 10% 0% 0%
10%
20%
30%
40%
50%
60%
70%
80%
90%
Measured (PM10/TSP)
Figure 6. Relationship of measured PM10/TSP ratio and corrected PM10/TSP ratio for the PM with GSD=1.7.
800
Measured PM10/TSP vs. Corrected PM10/TSP ((d50 =10 μm slope=1.5 GSD =1.8)
90%
Corrected (PM10/TSP)
80%
y = 1.146x - 0.0707 R2 = 0.999
70% 60% 50% 40% 30% 20% 10% 0% 0%
10%
20%
30%
40%
50%
60%
70%
80%
90%
Measured (PM10/TSP)
Figure 7. Relationship of measured PM10/TSP ratio and corrected PM10/TSP ratio for the PM with GSD=1.8. Measured PM10/TSP vs. Corrected PM10/TSP ((d50 =10 μm slope=1.5 GSD =1.9)
90%
Corrected (PM10/TSP)
80% y = 1.1258x - 0.061 R2 = 0.9993
70% 60% 50% 40% 30% 20% 10% 0% 0%
10%
20%
30%
40%
50%
60%
70%
80%
90%
Measured (PM10/TSP)
Figure 8. Relationship of measured PM10/TSP ratio and corrected PM10/TSP ratio for the PM with GSD=1.9.
801
Measured PM10/TSP vs. Corrected PM10/TSP ((d50 =10 μm slope=1.5 GSD =2.0)
90%
Corrected (PM10/TSP)
80%
y = 1.1102x - 0.0534 R2 = 0.9995
70% 60% 50% 40% 30% 20% 10% 0% 0%
10%
20%
30%
40%
50%
60%
70%
80%
90%
Measured (PM10/TSP)
Figure 9. Relationship of measured PM10/TSP ratio and corrected PM10/TSP ratio for the PM with GSD=2.0. Measured PM10/TSP vs. Corrected PM10/TSP ((d50 =10 μm slope=1.5 GSD =2.1)
90%
Corrected (PM10/TSP)
80% y = 1.1102x - 0.0534 R2 = 0.9995
70% 60% 50% 40% 30% 20% 10% 0% 0%
10%
20%
30%
40%
50%
60%
70%
80%
90%
Measured (PM10/TSP)
Figure 10. Relationship of measured PM10/TSP ratio and corrected PM10/TSP ratio for the PM with GSD=2.1.
802
Measured (PM10 /T SP) vs Corrected (PM10 /T SP) Sampler: d50 =10 μm slope=1.5 100% 95% 90% 85% 80% 75%
Corrected (PM
10 /TSP)
70% 65% 60% 55% 50% 45%
GSD=1.2
40%
GSD=1.3
35%
GSD=1.4
30%
GSD=1.5
25%
GSD=1.6
20%
GSD=1.7
15%
GSD=1.8
10%
GSD=1.9
5% 0% 10%
GSD=2.0 15%
20%
25%
30%
35%
40%
45%
50%
55%
Measured (PM10 /T SP)
Figure 11. Correction chart for PM10/TSP.
60%
65%
70%
GSD=2.1 75% 80%