Terry Miller. Kim R. Holmes. 2011 Index of. econoMIc. FReedoM. Promoting
Economic Opportunity and Prosperity. Highlights of the ...
Highlights of the
2011 Index of Economic Freedom Promoting Economic Opportunity and Prosperity
Terry Miller Kim R. Holmes
RANKING THE WORLD BY ECONOMIC FREEDOM Rank Country
1 2 3 4 5 6 7 8 9 10 11 12 13 14 15 16 17 18 19 20 21 22 23 24 25 26 27 28 29 30 31 32 33 34 35 36 37 38 39 40 41 42 43 44 45 46 47 48 49 50 51 52 53 54 55 56 57 58 59 60 61 62 63 64
Overall Score
Hong Kong Singapore Australia New Zealand Switzerland Canada Ireland Denmark United States Bahrain Chile Mauritius Luxembourg Estonia The Netherlands United Kingdom Finland Cyprus Macau Japan Austria Sweden Germany Lithuania Taiwan Saint Lucia Qatar Czech Republic Georgia Norway Spain Belgium Uruguay Oman South Korea Armenia Slovak Republic Jordan El Salvador Botswana Peru Barbados Israel Iceland Colombia The Bahamas United Arab Emirates Mexico Costa Rica Saint Vincent and the Grenadines Hungary Trinidad and Tobago Malaysia Saudi Arabia Macedonia Latvia Malta Jamaica Panama Bulgaria Kuwait Thailand Romania France
89.7 87.2 82.5 82.3 81.9 80.8 78.7 78.6 77.8 77.7 77.4 76.2 76.2 75.2 74.7 74.5 74.0 73.3 73.1 72.8 71.9 71.9 71.8 71.3 70.8 70.8 70.5 70.4 70.4 70.3 70.2 70.2 70.0 69.8 69.8 69.7 69.5 68.9 68.8 68.8 68.6 68.5 68.5 68.2 68.0 68.0 67.8 67.8 67.3 66.9 66.6 66.5 66.3 66.2 66.0 65.8 65.7 65.7 64.9 64.9 64.9 64.7 64.7 64.6
Rank Country
65 66 67 68 69 70 71 72 73 74 75 76 77 78 79 80 81 82 83 84 85 86 87 88 89 90 91 92 93 94 95 96 97 98 99 100 101 102 103 104 105 106 107 108 109 110 111 112 113 114 115 116 117 118 119 120 121 122 123 124 125 126 127 128 129
Overall Score
Cape Verde Slovenia Turkey Poland Portugal Albania Belize Dominica Namibia South Africa Rwanda Montenegro Paraguay Kazakhstan Guatemala Uganda Madagascar Croatia Kyrgyz Republic Samoa Burkina Faso Fiji Italy Greece Lebanon Dominican Republic Zambia Azerbaijan Morocco Mongolia Ghana Egypt Swaziland Nicaragua Honduras Tunisia Serbia Cambodia Bhutan Bosnia and Herzegovina The Gambia Kenya Sri Lanka Tanzania Mozambique Gabon Nigeria Vanuatu Brazil Mali The Philippines Indonesia Benin Tonga Malawi Moldova Senegal Côte d’Ivoire Pakistan India Djibouti Niger Yemen Tajikistan Suriname
64.6 64.6 64.2 64.1 64.0 64.0 63.8 63.3 62.7 62.7 62.7 62.5 62.3 62.1 61.9 61.7 61.2 61.1 61.1 60.6 60.6 60.4 60.3 60.3 60.1 60.0 59.7 59.7 59.6 59.5 59.4 59.1 59.1 58.8 58.6 58.5 58.0 57.9 57.6 57.5 57.4 57.4 57.1 57.0 56.8 56.7 56.7 56.7 56.3 56.3 56.2 56.0 56.0 55.8 55.8 55.7 55.7 55.4 55.1 54.6 54.5 54.3 54.2 53.5 53.1
Rank Country
130 131 132 133 134 135 136 137 138 139 140 141 142 143 144 145 146 147 148 149 150 151 152 153 154 155 156 157 158 159 160 161 162 163 164 165 166 167 168 169 170 171 172 173 174 175 176 177 178 179 n/a n/a n/a n/a
Overall Score
Bangladesh Papua New Guinea Algeria Haiti Mauritania China Cameroon Guinea Argentina Vietnam Syria Laos Seychelles Russia Ethiopia Micronesia Nepal Bolivia Burundi Sierra Leone São Tomé and Príncipe Guyana Central African Republic Togo Maldives Belarus Lesotho Equatorial Guinea Ecuador Guinea–Bissau Liberia Angola Solomon Islands Uzbekistan Ukraine Chad Kiribati Comoros Republic of Congo Turkmenistan Timor-Leste Iran Democratic Republic of Congo Libya Burma Venezuela Eritrea Cuba Zimbabwe North Korea Afghanistan Iraq Liechtenstein Sudan
53.0 52.6 52.4 52.1 52.1 52.0 51.8 51.7 51.7 51.6 51.3 51.3 51.2 50.5 50.5 50.3 50.1 50.0 49.6 49.6 49.5 49.4 49.3 49.1 48.3 47.9 47.5 47.5 47.1 46.5 46.5 46.2 45.9 45.8 45.8 45.3 44.8 43.8 43.6 43.6 42.8 42.1 40.7 38.6 37.8 37.6 36.7 27.7 22.1 1.0 n/a n/a n/a n/a
ECONOMIC FREEDOM SCORE 80–100 70–79.9 60–69.9 50–59.9 0–49.9
FREE Mostly FREE MODERATELY FREE MOSTLY UNFREE REPRESSED
Highlights of the 2011 Index of Economic Freedom
E
conomic freedom advanced this year, regaining much of the momentum lost during the fiscal crisis and global recession. Many governments around the world have rededicated themselves to fiscal soundness, openness and reform, and the majority of countries are once again on a positive path to greater freedom.
The 2011 Index of Economic Freedom reports on economic policy developments since the second half of 2009 in 183 economies. Based on 10 measures that evaluate openness, the rule of law, and competitiveness, the Index ranks economies according to their economic freedom. The principles of economic freedom emphasized in the Index are individual empowerment, non-discrimination, and the promotion of competition.
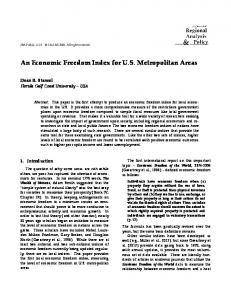
Highlights from the 2011 Index of Economic Freedom n The global average economic freedom score for the 2011 Index is 59.7, a 0.3 point increase from last year. (See Chart 1.) Despite the challenging global economic environment,
Global Average Economic Freedom Average Score in the Index of Economic Freedom Since 1995 61
60.2 60.2 59.7
60
59.4
59
58
57
57.1
56 1995
2000
2005
2010 2011
Sources: Terry Miller and Kim R. Holmes, 2011 Index of Economic Freedom (Washington, D.C.: The Heritage Foundation and Dow Jones & Company, Inc., 2011), at www.heritage.org/index.
Chart 1
heritage.org
the forces of economic freedom around the world have been resilient and even increasing. In fact, economic freedom has taken an upturn in the majority of the economies that are assessed in the 2011 Index. Those gains are particularly welcome and significant given the fact that
The Heritage Foundation • heritage.org/index
1
Biggest Gainers and Losers in the 2011 Index Nations that Gained or Lost at Least 2 Points in their Index Scores from Last Year GAINERS Rwanda Djibouti Seychelles Soloman Islands Guinea–Bissau Jordan Cape Verde Bulgaria Sri Lanka Colombia Tonga Cyprus Belize The Gambia Oman Burundi Moldova Saudi Arabia Togo
LOSERS +3.6 +3.4 +3.3 +3.0 +2.9 +2.8 +2.8 +2.6 +2.5 +2.5 +2.4 +2.4 +2.3 +2.3 +2.1 +2.1 +2.0 +2.0 +2.0
Iceland Algeria Timor-Leste Kuwait Ireland Nepal Greece Italy Ecuador Angola Chad Madagascar Albania United Kingdom
–5.5 –4.5 –3.0 –2.8 –2.6 –2.6 –2.4 –2.4 –2.2 –2.2 –2.2 –2.1 –2.0 –2.0
Sources: Terry Miller and Kim R. Holmes, 2011 Index of Economic Freedom (Washington, D.C.: The Heritage Foundation and Dow Jones & Company, Inc., 2011), at www.heritage.org/index.
Table 1
heritage.org
the biggest improvements have been achieved in developing and emerging economies where poverty reduction is a top priority. (See Table 1.) n The scores of 117 economies are better, the scores of 58 are worse, and those of four are unchanged. Of the 117 economies whose scores improved, 102 are developing or emerging economies, many of which are in Sub-Saharan Africa and the South and Central America/Caribbean region. n All regions except Europe and North America recorded increased levels of economic freedom. The Sub-Saharan Africa region, led by Rwanda, Djibouti, and Cape Verde, achieved the
2
largest score improvement, with countries gaining over half a point on average in the 2011 Index. The South and Central America/Caribbean region gained the second most freedom on average, exactly half a point, owing to significant progress in Colombia and Costa Rica, among others. The Middle East and North Africa and Asia–Pacific regions also showed gains, but North America and Europe, despite increases by some countries, experienced a decline in economic freedom and no change, respectively, on average. n Along with Hong Kong and Singapore, Australia, New Zealand, Switzerland, and Canada have solidified their status as the world’s “free” economies. These top six economies are the only countries to achieve scores above 80 on the 0 to 100 economic freedom grading scale. Hong Kong was able to uphold its status as the world’s freest economy, a position it has held for 17 consecutive years. Singapore remains a close second, narrowing the gap with Hong Kong. Australia and New Zealand have maintained their previous rankings of 3rd and 4th in the 2011 Index, while Switzerland climbed up to the 5th spot, overtaking Ireland, which fell to 7th place. The relative strength of the “free” economies is no accident. Their strong commitment to all facets of economic freedom has endowed their economies with a high degree of resilience. All are recovering rapidly from the shocks of the global slowdown.
Highlights of the 2011 Index of Economic Freedom
n Every region continues to maintain at least one of the top 20 freest economies. Nine of them are in Europe, six are in the Asia–Pacific region, and two are from North America. The other regions are represented by one country each: Chile (South and Central America/Caribbean region); Mauritius (Sub-Saharan Africa region); and Bahrain (Middle East and North Africa region). Bahrain recorded impressive progress, now becoming the world’s 10th freest economy. Across all the regions, economic freedom is the key to greater opportunity and prosperity. (See Chart 2.)
Economic Freedom and Standard of Living GDP per Capita (Purchasing Power Parity) $50,000
$47,570 40,000
Average Scores within Region
$44,310
Top five nations Bottom five nations
$34,848
30,000
$24,658
20,000
10,000
0
$10,413
Europe
$9,338 $3,042
Asia– Pacific
$8,513
$8,527
$1,485
Middle Americas SubEast and Saharan North Africa Africa
Sources: Terry Miller and Kim R. Holmes, 2011 Index of Economic Freedom (Washington, D.C.: The Heritage Foundation and Dow Jones & Company, Inc., 2011), at www.heritage.org/index.
Chart 2
heritage.org
Economic Freedom Promotes Overall Well-Being Rank in Prosperity Index 1 21
Each dot represents a nation in the Index of Economic Freedom
41 n Economic freedom is key to overall well-being. The 61 2011 edition of the Index e Lin nd confirms findings from Tre 81 previous editions regardCorrelation = 0.78 101 R2 = 0.61 ing the various tangible benefits of living in freer 101 81 61 41 21 1 societies. Not only are Rank in 2011 Index of Economic Freedom higher levels of economic Sources: Terry Miller and Kim R. Holmes, 2011 Index of Economic Freedom freedom associated (Washington, D.C.: The Heritage Foundation and Dow Jones & Company, Inc., 2011), at www.heritage.org/index, and 2010 Legatum Prosperity with higher per capita Index, at http://www.prosperity.com/downloads/ 2010LegatumProsperityIndexBrochure.pdf (November 1, 2010). incomes, but greater Chart 3 heritage.org economic freedom is also strongly correlated to overall well-being, which takes into tion, security, and personal freedom. account such factors as health, educa(See Chart 3.)
The Heritage Foundation • heritage.org/index
3
The 10 Economic Freedoms: A Global Look BUSINESS FREEDOM — 64.3
While some countries have continued to streamline and modernize their business frameworks, reforms have stalled in many others, seemingly as a result of some combination of reform fatigue and complacency. In a few countries, including the United States, ongoing regulatory changes have injected new uncertainty into the business environment, in itself a constraint on entrepreneurial activity. For the world as a whole, business freedom worsened slightly by 0.3 point, with 49 countries improving and 113 declining.
TRADE FREEDOM — 74.8
Despite the challenging global economic environment, the world average for trade freedom improved by 0.6 point in the 2011 Index. Average applied tariffs fell by almost half a percentage point over the past year to 6.4 percent. Only a few of the countries whose scores fell this year actually increased their tariffs. Most resorted instead to a variety of other restrictive measures that impede the free flow of goods or services, continuing a disturbing trend toward increasing non-tariff barriers.
FISCAL FREEDOM — 76.3
Over the previous year, 36 countries have introduced reforms in direct taxes or have implemented tax cuts as previously planned, despite the fiscal challenges caused by the global economic slowdown. Six countries, including the United Kingdom, Iceland, and Mexico, implemented either temporary or permanent tax rate increases. Overall fiscal freedom improved by 0.9 point in the 2011 Index. The average top tax rate on individual income is now 28.7 percent, and the average top tax rate on corporate income is 24.8 percent. The average total tax burden as a percentage of GDP is 24.4 percent.
GOVERNMENT SPENDING —63.9
The average score for government spending decreased by 1.1 points in the 2011 Index. In response to the global financial and economic turmoil, many governments around the world, particularly in advanced economies, launched various stimulus programs that increased spending. Deficits and debt levels have increased, and better management of public finance is urgently needed in many countries. The average level of government spending as a percentage of GDP is 33.5 percent, up from 32.8 percent in the 2010 Index. The average level of gross public debt as a percentage of GDP in advanced economies has risen sharply to over 90 percent.
MONETARY FREEDOM — 73.4
The 2011 Index registered a sharp improvement in monetary freedom, with the global average score up 2.8 points as a result of reduced inflationary pressures. Inflation has fallen more sharply in emerging economies than in the developed world. Interest rates have been
4
brought down considerably, close to the zero floor in many advanced economies, but price control measures have increased in some economies.
INVESTMENT FREEDOM — 50.2
Although progress was uneven, investment freedom advanced in the 2011 Index. The average investment freedom score improved by 1.3 points. Of the 102 foreign investment–related policy measures during 2009, 71 focused on further liberalization and promotion of investment. Leading the global recovery in foreign direct investment flows, developing and transition economies attracted half of global FDI inflows.
FINANCIAL FREEDOM — 48.5
Following dramatic adjustments in the financial sector during the previous year, stability has improved and only a few countries’ financial freedom scores changed in the 2011 Index. The effectiveness of financialsector reform measures that were implemented during the first half of 2010 remains to be seen, but policy uncertainty continues. Governments that have reversed bailouts or other interventionist actions were not further penalized. Overall, the average financial freedom score remained essentially unchanged from the past year.
PROPERTY RIGHTS — 43.6
The average score on property rights declined by 0.2 point in the 2011 Index. Some governments sought to justify expropriations and nationalizations on the basis of the global financial and economic turmoil. On the positive side, protection of property rights improved in 15 countries.
FREEDOM FROM CORRUPTION — 40.5
Corruption continues to be a significant drag on economic freedom, and scores for freedom from corruption continue to lag behind those of other components of the Index of Economic Freedom. The average score for freedom from corruption did not change in the 2011 Index. Only 15 countries scored 80 or higher on this component, while 129 countries scored below 50. High levels of persistent corruption in many of the less developed countries continue to severely undermine economic growth. LABOR FREEDOM — 61.5 In light of the growing importance of labor-market flexibility in enhancing productivity and improving job growth, many economies have adopted more flexible labor regulations in recent years. Regrettably, reform progress slowed considerably this year, and the global average score for labor freedom decreased by 0.6 point in the 2011 Index, with 64 countries improving and 106 declining.
Highlights of the 2011 Index of Economic Freedom
Economic Freedom Around the World
O
f the 179 economies graded in the 2011 Index, six are “free” economies that score above 80. With ratings between 70 and 80, the next 27 countries are “mostly free.” These 33 economies provide institutional environments in which individuals and private enterprises enjoy a substantial degree of economic freedom in the pursuit of greater prosperity and success. An equal number of countries are divided between “moderately free” and “mostly unfree,” accounting, in the middle of the distribution, for the largest share of the countries graded in the Index—114 countries. With scores below 50, there are 32 countries that remain economically “repressed.” (See Chart 1.) Each of the world’s regions has registered at least one country that is ranked among the top 20 freest economies in the 2011 Index. Average levels of economic freedom, however, vary widely among the regions, and there are some stark differences in regional economic performance. Indeed, countries often do share certain characteristics—cultural, geographical, historical, or others—with their regional neighbors that may help to shed light on the particular challenges to economic freedom that they face.
Global Distribution of Economic Freedom Number of Nations in Each Freedom Category
57
57
32
27 6 Free
Mostly Moderately Mostly Repressed Free Free Unfree
Sources: Terry Miller and Kim R. Holmes, 2011 Index of Economic Freedom (Washington, D.C.: The Heritage Foundation and Dow Jones & Company, Inc., 2011), at www.heritage.org/index.
Chart 1
heritage.org
As shown in Chart 2, economic freedom varies noticeably by region, with inhabitants of North America and Europe enjoying greater levels of economic freedom than those who live in other regions of the world. Despite varying degrees of economic freedom across the regions, the relationship between economic freedom and prosperity remains constant within the regions. Per capita incomes are much higher in countries that are economically free. Not surprisingly, overall human development also thrives in an environ-
The Heritage Foundation • heritage.org/index
5
ment that is economiEconomic Freedom by Region, with Population cally free. Economic Index of Economic Freedom Score freedom is about more 90 than a business enviNorth Circle sizes are relative America ronment in which 80 = 500 million people to region’s population 75.5 entrepreneurship and 75 prosperity can flourEurope 443 million South and Middle 66.8 70 ish. Across all of the East/ Central Asia– North America/ regions, as demonstratPacific Africa Caribbean 65 57.4 813 million 60.6 60.2 Subed in Chart 3, higher Saharan 60 economic freedom Africa 460 million 334 million 53.5 induces greater overall 55 human development as 3.7 billion 50 768 million measured by the United Sources: Terry Miller and Kim R. Holmes, 2011 Index of Economic Freedom Nations Human Devel(Washington, D.C.: The Heritage Foundation and Dow Jones & Company, Inc., 2011), at www.heritage.org/index; International Monetary Fund, World Economic opment Index, which Outlook Databases, at http://www.imf.org/external/ns/cs.aspx?id=28 (November 18, 2010) assesses the combined Chart 2 heritage.org progress of life expectancy, literacy, educaMaxim Pinkovskiy of the Massachution, and the standard of living. setts Institute of Technology and Xavier Previous editions of the Index have Sala-i-Martin of Columbia University confirmed the tangible benefits of living also find that world poverty has indeed in freer societies. Not only are higher been disappearing faster than previlevels of economic freedom associously thought. As economic freedom ated with higher per capita incomes has advanced steadily over the past and higher GDP growth rates, but decades, the global poverty rate has those higher growth rates seem to crebeen cut significantly. According to the ate a virtuous cycle, triggering faster two prominent scholars, “the percentage poverty reduction and further improvements in Human Poverty Index (HPI) economic freedom. Over Change in Percentage of the decade, the countries the Population in Poverty, with improvements in ecoFrom 2001 Index of Economic Freedom from the 1999 HPI Index to 2011 Index of Economic Freedom to the 2009 HPI Index nomic freedom achieved –4.5 All countries much better reductions in –5.8 Countries that gained economic freedom poverty, almost by a factor –3.1 Countries that lost economic freedom of two, as measured by the Note: Data compiled from the Index of Economic Freedom, 2001 to 2011, and United Nations Human the Human Poverty Index, 1999 to 2009. Sources: Terry Miller and Kim R. Holmes, 2011 Index of Economic Freedom Poverty Index. (See Table 1.) In a recent study that estimates the world’s income distribution,
6
(Washington, D.C.: The Heritage Foundation and Dow Jones & Company, Inc., 2011), at www.heritage.org/index; and Human Development Reports, United Nations Human Development Programme, at http://hdr.undp.org/en/reports (November 17, 2010).
Table 1
Highlights of the 2011 Index of Economic Freedom
heritage.org
of the world population living on less than $1 a day went down to 5.4 percent in 2006 from 26.8 percent in 1970,” with poverty rates dramatically falling across all the regions.
Diverging Patterns of Economic Freedom While the global average score for the 2011 Index has improved since last year, progress has not been uniform across the
Economic Freedom and Human Development by Region Each dot represents a nation in the Index of Economic Freedom
Global Correlation = 0.70, R2 = 0.49
Asia–Pacific 1.00 0.75
Europe 1.00
Human Development Index
0.75
al Glob d Trene Lin
0.50
0.50
0.25
0.25
0
0 20
30
40
50
60
70
80
2011 Index of Economic Freedom Score
90
20
30
Middle East/North Africa
40
50
60
70
80
90
70
80
90
70
80
90
North America
1.00
1.00
0.75
0.75
0.50
0.50
0.25
0.25
0
0 20
30
40
50
60
70
80
90
20
30
South and Central America/Caribbean
40
50
60
Sub-Saharan Africa
1.00
1.00
0.75
0.75
0.50
0.50
0.25
0.25
0
0 20
30
40
50
60
70
80
90
20
30
40
50
60
Note: Trend lines are for all countries in the Index of Economic Freedom. Sources: Terry Miller and Kim R. Holmes, 2011 Index of Economic Freedom (Washington, D.C.: The Heritage Foundation and Dow Jones & Company, Inc., 2011), at www.heritage.org/index; and Human Development Reports, United Nations Human Development Programme, at http://hdr.undp.org/en/reports (November 17, 2010).
Chart 3
The Heritage Foundation • heritage.org/index
heritage.org
7
regions. North America and Europe have lagged, while much of the developing world has surged ahead. (See Chart 4.)
One-Year Freedom Score Change Change in Score Since 2010 Region Index of Economic Freedom North America –0.1 Europe Middle East/North Africa Asia–Pacific South and Central America/Caribbean Sub-Saharan Africa
No change +0.2
Sub-Saharan Africa +0.4 achieved the largest +0.5 +0.6 score improvement, Sources: Terry Miller and Kim R. Holmes, 2011 Index of Economic Freedom with countries gain(Washington, D.C.: The Heritage Foundation and Dow Jones & Company, Inc., 2011), ing over half a point at www.heritage.org/index. Chart 4 heritage.org on average in the 2011 Index. The South and Central America/Caribbean region below the world average in fiscal freedom gained the second most freedom on and 20 points below the world average in average, exactly half a point. The Middle government spending—a reflection of East/North Africa and Asia–Pacific their bloated government budgets that regions also showed gains. Economic fund high levels of welfare spending. Rigid freedom held steady in Europe and labor regulations also continue to hamper actually declined in North America. the region’s freedom, with negative results Table 2 shows components of economic freedom in which regions perform better or worse than the world averages. Every region has two or more components in which the average level of economic freedom falls below the world average. The North America region recorded drops in fiscal freedom and government spending, which now trail the world averages. European countries fall over five points
for job creation and employment growth. South and Central America/Caribbean countries lag behind world averages in six components of economic freedom, particularly freedom from corruption and property rights. The Middle East/North Africa region has lower than average scores in six economic freedoms, the Asia–Pacific region is behind in six, and Sub-Saharan Africa lags in nine.
Monetary Freedom
Investment Freedom
+3.9 +4.4 +1 –0.6 –1 –3.8
+21.5 +21.5 +31.4 +24.5 +17.9 +19.7 +15 +17.6 +15.5 +0.3 +0.1 –0.6 –2 –1.2 –0.4 –4.6 –2.6 –1.5 –0.4 –0.1 –12.2 –7.3 –4.7 –4.2 +4.1 –7.3 –7.4 –12.4 –11.4 –5
Labor Freedom
Government Spending –0.4 –20 +8 +3.8 +4.8 +8
Property Rights
Fiscal Freedom –0.4 –5.2 +1.5 +11.2 +1.9 –1.9
Financial Freedom
Trade Freedom
+27.3 +10.4 +12.7 +11 –1.4 –0.3 +2.4 +1.4 0 –4.2 –13.6 –7.4
Business Freedom
Region North America Europe South and Central America/Caribbean Middle East/North Africa Asia–Pacific Sub-Saharan Africa
Freedom from Corruption
Each Region’s 10 Economic Freedoms Compared to the World Average
Sources: Terry Miller and Kim R. Holmes, 2011 Index of Economic Freedom (Washington, D.C.: The Heritage Foundation and Dow Jones & Company, Inc., 2011), at www.heritage.org/index.
Table 2
8
Highlights of the 2011 Index of Economic Freedom
heritage.org
The Limits of Governments
A
critical battle has been raging between friends and foes of economic liberty. The global economic and financial turmoil of the past two years emboldened critics of the capitalist, free enterprise system and raised questions about the best policy framework for supporting economic growth, employment, and overall prosperity. Questions relating to the role and size of government have been front and center, both in national debates and in international discussions: n With countries from Europe to China facing the demographic challenges of aging populations, problems of funding pensions on a sustainable basis are becoming acute. n Health costs are rising rapidly around the world, with many countries facing hard choices about the allocation of care and rationing. n The recession has strained social safety nets almost everywhere; increased spending in some countries has turned what was previously a debate about long-term funding solutions into an acute crisis demanding immediate decisions about austerity measures to restrain national debt.
With battle lines drawn more starkly than at any time since the fall of the Soviet Union, the advocates of free enterprise and economic freedom have faced new challengers from some unexpected quarters, particularly the governments of the United States and, until May of 2010, the United Kingdom. These governments, championing state intervention and government control for the first time since the Index of Economic Freedom began ranking countries in 1995, have led the calls for greater international regulation of business, backed away from the cause of free trade, and shed economic freedom at home, stifling their own growth and, in effect, turning off two of the most important engines that had driven world growth for half a century or more. When dealing with democracies, of course, battles are fought not just among countries, but also within them through the political system and the electoral process. A great debate emerged, particularly in the United States, between those who claimed that economic freedom caused, or at least exacerbated, the first global economic crisis of the new century and those who blamed past government interventions that inflated unsustain-
The Heritage Foundation • heritage.org/index
9
able bubbles in housing and financial markets. U.S. voters, apparently more interested in practical solutions than ideology, responded pragmatically. As the first shock wave of the global financial troubles washed over them in late 2008, they elected President Barack Obama and installed a Congress with large left-leaning majorities that massively increased government spending and regulation. Then, only two years later, voters just as massively rejected the President’s failed statist solutions, as well as many of the politicians who had championed them. In Europe, decades of high social welfare spending and stifling regulation have combined to reduce economic and social dynamism and flexibility. As electorates were clamoring for action during the financial crisis and recession, governments’ scope for effective response proved surprisingly small. For governments increasingly constrained by budget deficits and rising debt, the disconnect between their past promises and their capability to fulfill them, and between their financial assets and liabilities, became difficult to ignore. A fundamental rethinking of the social contract, the basic relationship between government and citizen, became, for some countries like Greece or France, not just an academic exercise but a political debate that spilled into the streets.
Right-Sizing Government The Index of Economic Freedom has never, in its methodology, claimed that there was an appropriate or ideal level of government spending against which
10
countries’ economic performance should be measured. Factors as diverse as culture and geography have an impact on the need for government. Demands on government vary widely between developed and developing countries. It is undeniable, however, that there is an opportunity cost to government spending: resources used by government are unavailable for private-sector consumption or investment. In addition, governments, because they operate outside of market constraints and competition, are typically susceptible to excessive bureaucracy, corruption, and waste. Whatever the ideal level of government may be, the political and economic developments of the past year have made clear that in many societies, particularly among the more developed countries, the limits of appropriate or tolerable government spending may have been reached or even surpassed. Debates are underway in many of these countries that may fundamentally alter the relationship between citizen and state and provide new insights into our understanding of government spending as a constraint on economic freedom. With global economic recovery far from secure, many countries are at a critical juncture and face decisive policy choices. Leaders will either acknowledge the limits of government and make necessary policy adjustments, or they will carry on with ill-guided policies that empower governments but not people. The alternatives are clear: openness or protectionism; austerity or fiscal collapse; entrepreneurial dynamism or economic stagnation.
Highlights of the 2011 Index of Economic Freedom
The 2011 Index results demonstrate clearly that for many of the countries of the world, particularly those that experienced the inevitable results of state economic control under Communist systems in the past, policy solutions that would re-regulate economic activity or undo the integration of economies in a globalized trade and investment market hold little attraction. Their skepticism is justified. Countries that reduced government spending had economic growth rates almost two percentage points higher in 2009 than countries whose government spending scores worsened, and countries with the highest rates of government spending had gross domestic product (GDP) growth rates 4.5 percentage points lower on average than countries where government spending was best contained. (See Chart 1.)
Economic Freedom: The Foundation for Resilience, Innovation, and Growth While the global economic crisis has tested confidence in economic freedom, the Index results, when compared with real data about changes in economic and social conditions in societies around the world, provide strong evidence that the free-market system remains not only viable—with such core features as private property rights, openness, and flexibility almost uncontested—but uniquely able to promote long-term prosperity. Over the past decades, the globalized economic and trading system that is based on economic freedom has fueled unprecedented economic growth around the world. From 1980 to 2008, the world economy achieved real GDP expansion
Government Size and Economic Growth Nations with better scores in the Government Spending component of the Index of Economic Freedom also have faster-growing economies. +2% +1%
2009 GDP Growth Rate
+1.4%
+1.6%
+1.8%
0% –1% –2% –3%
–2.7%
Worse Scores
-2.5%
Government Spending Scores (by Quintile)
Better Scores
Sources: Terry Miller and Kim R. Holmes, 2011 Index of Economic Freedom (Washington, D.C.: The Heritage Foundation and Dow Jones & Company, Inc., 2011), at www.heritage.org/index.
Chart 1
heritage.org
of around 145 percent, lifting hundreds of millions of people out of poverty. Globally, poverty has fallen by 40 percent since 1990. Economic freedom has helped economies to become more flexible and resilient and has promoted increased productivity and higher wages. The positive relationship between economic freedom and prosperity has been confirmed yet again in the 2011 Index. GDP per capita is much higher in countries with greater economic freedom. Chart 2 shows a strong positive relationship between the level of economic freedom and GDP per capita. Given this relationship, it should be apparent that a government’s most effective stimulus activity will not be to increase its own spending or increase layers of regulation, both of which
The Heritage Foundation • heritage.org/index
11
Today’s successful economies are not necessarily geographically large or richly blessed with natural resources. Many economies have managed to expand opportunities for their citizens by enhancing their economic dynamism and vitality. Economic freedom is highly correlated with societies’ openness to entrepreneurial activity that creates new jobs and increases opportunity and choice for individuals in advancing their own well-being. (See Chart 3.)
Economic Freedom Promotes Greater Prosperity GDP per Capita (Constant 2000 U.S. Dollars) $60,000
$40,000
e
Each dot represents a nation in the Index of Economic Freedom
$50,000
Trend Lin
reduce economic freedom. The best results are likely to be achieved instead through policy reforms that improve the incentives that drive entrepreneurial activity, creating greater opportunities for investment and job growth.
Correlation = 0.67 R2 = 0.45
$30,000 $20,000 $10,000 $0 30
40
50
60
70
80
90
2011 Index of Economic Freedom Score Sources: Terry Miller and Kim R. Holmes, 2011 Index of Economic Freedom (Washington, D.C.: The Heritage Foundation and Dow Jones & Company, Inc., 2011), at www.heritage.org/index; World Bank Group, World Development Indicators Online, at http://publications.worldbank.org/WDI/ (November 5, 2010); International Monetary Fund, World Economic Outlook Databases, at http://www.imf.org/external/ns/cs.aspx?id=28 (November 5, 2010).
Chart 2
Economic Freedom Promotes Entrepreneurial Dynamism
heritage.org
For countries in Rank in the Entrepreneurship and Opportunity Sub-Index which the economic cri1 sis lingers, and particuEach dot represents a nation in the Index larly for those in which 21 of Economic Freedom job creation is a priority, 41 it is imperative to pick nd Treine L up the pace of economic 61 reform. The political will 81 to resist elite and special Correlation = 0.80 101 interests that support R2 = 0.64 the status quo, whether 101 81 61 41 21 1 through tariffs and other Rank in the 2011 Index of Economic Freedom protectionist measures Sources: Terry Miller and Kim R. Holmes, 2011 Index of Economic Freedom or through domestic (Washington, D.C.: The Heritage Foundation and Dow Jones & Company, Inc., 2011), at www.heritage.org/index; 2010 Legatum Prosperity Index at regulations so complex http://www.prosperity.com/downloads/2010LegatumProsperityIndexBrochure.pdf (November 4, 2010). that only the largest and Chart 3 heritage.org most well-entrenched companies can afford to implement them, is critical. Reforms regulatory and financial burden for the to facilitate business startups are essenprivate sector will be on the fast track to tial, and those countries that lighten the economic success in the future. 12
Highlights of the 2011 Index of Economic Freedom
2011 Index of Economic Freedom
g om
miller HOlmeS
2011 Index of econoMIc FReedoM Promoting Economic Opportunity and Prosperity
Terry Miller Kim R. Holmes
The Index of Economic Freedom is a joint publication of The Heritage Foundation and The Wall Street Journal. The complete text of the Index, which includes individual country pages, component scores, regional analysis, and essays highlighting particular issues related to economic freedom, is available online at heritage.org/index, or may be purchased in hard copy from The Heritage Foundation Bookstore, 214 Massachusetts Avenue, NE, Washington, DC 20002–4999, 1-800-544-4843.
DISTRIBUTION OF ECONOMIC FREEDOM
Economic Freedom Scores 80–100 Free 70–79.9 Mostly Free 60–69.9 Moderately Free 50–59.9 Mostly Unfree 0–49.9 Repressed Not Ranked
2011 Index of Economic Freedom
Regaining the Path of Freedom World economic freedom is again on the rise. Policy missteps that contributed to fiscal crisis and recession have been repudiated by voters in some countries and disciplined by market forces in others. Countries that have stayed true to the principles of economic freedom are reaping the rewards: rapid recovery and renewed growth. In fact, average incomes in countries that gained economic freedom this year are projected to grow more than 4 percent! heritage.org/index
The Heritage Foundation • 214 Massachusetts Avenue, NE • Washington, DC 20002 • heritage.org The Wall Street Journal • Dow Jones & Co. • 200 Liberty Street • New York, NY 10281 • www.wsj.com