Jul 25, 2013 ... Here is a quick reference for choosing analytics and data mining .... o Pang-Ning
Tan, Michael Steinbach and Vipin Kuma's Introduction to Data ...
Towards a Functional Taxonomy for Data Analytics Executive Summary Here is a quick reference for choosing analytics and data mining techniques to use on your data first. “First” because undoubtedly there will be snags and hiccoughs in the process, and you’ll move on to other options and learn along the way. What is your question? Do any of the variables in my data set correlate (move together)? What implied “rules” have driven decisions in the past? How can I expect this continuous numerical data to behave in the future, based on what it has done in the past?
I have a bunch of records (perhaps transactions of shopping cart checkout), and I want to discover common groupings of items (like diapers and beer).
I want to group my records into groups based on numeric vales, and I have a hunch that there are “k” groups.
Try this first: Caveats: (links are to example videos) Correlation Matrix Do NOT confuse correlation with http://bit.ly/ViKDA3 causality. Two variables can move together without any real relationship. Decision Tree http://bit.ly/Zoh554 Regression Be very careful, you may not have collected all the pertinent data in a very complex system. It is easy to leave something out. Polynomial regression can “look pretty” and neatly fit a curvy line to some data points, but it might not really apply. Use it as a basis to ask more questions: for example, “Are sales leveling out?” or “Is momentum increasing, and if so why?” Create Association You may need to convert your data Rules using from numeric (1s and 0s showing Frequency Pattern whether an item appeared in a Growth (FPshopping cart) to binominal before Growth) you apply the FP-Growth operator. So http://bit.ly/12iI7LP the flow is: 1. Select only the pertinent attributes you want to use 2. Convert from numerical to binominal 3. Apply FP-Growth 4. Create Associations k-Means Clustering Your data must be all numeric. http://bit.ly/168Ri5q You need to guess the number of groups you want “k.”
Detail As an academic, a data scientist and a corporate consultant, I have wrestled with this issue for a long time. A client or a student asks, “Which technique should I use for this problem?”. And the careful academic in me hesitates and says, “It depends.” As data scientists we have spent long years examining algorithms, thinking
Page 1
www.ArcLight.biz
© 7/25/2013, Bonnie K. Holub
about their strengths and weaknesses, figuring out when they apply and when they don’t apply (some distinctions can be subtle, detailed to explain, complicated) and we don’t want to mislead people. After all, we ARE scientists. More than one manager has sighed exhaustedly and said, “Look, there are only two things data mining algorithms can do: cluster like members in a group, and predict the future through regression, so which algorithm should I use?” Academics know that in December of 2007 a paper presented at the IEEE International Conference on Data Mining titled, “Top 10 Algorithms in Data Mining,” surveyed the top 10 (details of the process appear here: http://www.cs.uvm.edu/~icdm/algorithms/ICDM06-Panel.pdf) algorithms that appeared in the literature to that point. This paper was an award winner from the KDD conference. And this paper is cited regularly in books such as Peter Harrington’s Machine Learning in Action, (Manning Publications, 2012). And, while this has given great fame to these algorithms, are they the best for your application? Do they work on “real world” data or just manufactured examples in a laboratory? So the question becomes: how can we resolve these two pressures on us: the pressure to be thorough, careful scientists, and the pressure to answer the questions of those who, rightly, expect responses and results. This list is an effort to try to provide a starting point for novices, or a starting checklist for practitioners who have a data (and possibly a data mining) problem that they want to attack. Inevitably, things won’t work, and you’ll need to seek out another algorithm, or refine the data, but you won’t know that until you try something. And the goal of this work is to give you some ideas about where to start. Due acknowledgement is owed to Peter Harrington, Linoff and Berry1, and Matthew North’s work2 which have contributed to this piece. So, to satisfy my academic heart, and calm my risk-averse fears, here are some caveats:
Use data mining techniques prudently. If something SEEMS to be working, read more about it. Learn exactly what is going on in the statistical formulas. Remember YOU are responsible for the results you generate. Have colleagues critique your work carefully to make sure you’re not, for example, deluding yourself into seeing causality when only co-occurrence exists. Excellent texts exist, and good references include: o Pang-Ning Tan, Michael Steinbach and Vipin Kuma’s Introduction to Data Mining, AddisonWesley, 2005. o Jiawei Han, Micheline Kamber and Jian Pei’s Data Mining: Concepts and Techniques, Morgan Kauffman, 2011.
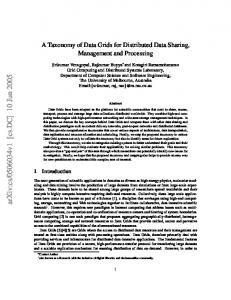
Next, let’s examine what I’m trying to do here: develop taxonomy. Most taxonomies exist as a way to categorize domains of knowledge. According to Merriam-Webster, “branch of science concerned with classification, esp. of organisms; systematics.” That last part is important: systematics – we’re trying to systematize something. In biology, taxonomies help us to identify organisms. In technology they group together similar algorithms or computational techniques to facilitate understanding them, or learning about them. So, a typical taxonomy of data mining algorithms includes some of these nodes:
1
Linoff, Gordon S., & Berry, Michael J.A., Data Mining Techniques: For Marketing, Sales and Customer Relationship Management, Wiley, 2011. 2 North, Matthew, Data Mining for the Masses, Global Text Press, 2012.
Page 2
www.ArcLight.biz
© 7/25/2013, Bonnie K. Holub
Datta Mining
Supervised Learning
Classificaation
Unsuperviseed
Regression
Cluste ring
Density Estimation
k‐‐Nearest Neighbor N
Linear
k‐Means CClustering
Exectatio on Maximizatiion
Decision D Trees
Polnomial Regression n
DBSCAN
Parzen window w
Naive Bayes
Locally Weighted Linear
Support S Vector Machines M
Ridge
Lasso
The probllem with this organization o is that it is buillt with regard to “how” thee functions wo ork, not “whatt they do.” So, for f example, iff you have a business b probllem like, “I’ve got a list of aall the transacttions in my sto ore showing which w items were w bought together, and I’d d like to learnn how stronglyy individual iteems are linkedd to other item ms.” In this casse the answer is: look at thee a priori unsuppervised learnning algorithm m, there is no obvious way w to connectt the question,, “what items are linked,” aand the answerr, “a priori unssupervised learning.” t analysis frrom the Know wledge Managgement literatuure (From Shaaw, M.J., Subramaniam, C., Tan, Consider this G. W. and d Welge, M. E., “Knowledge Managemen nt and Data M Mining for Marrketing”, Decission Support Sysstems, Vol. 31, Isssue 1, Ma 20001, pp. 127-1227).
Page 3
www w.ArcLight.bizz
© 7/25/20133, Bonnie K. H Holub
der blogger An ndreas Muelleer’s Machine Learning L Cheaat Sheet (http:///peekabooOr, consid vision.bloggspot.de/20133/01/machinee-learning-cheeat-sheet-for-sscikit.html) (foor skikit-learn))
Each of th hese seems to be in search of o the same “h holy grail,” thaat is, an introdduction to datta mining techniquess for beginnerrs or casual users. But nonee of them satissfied my needd to categorizee techniques b by the business problem p one iss trying to solvve. So, I devised the table aat the top of tthis piece. Lett me know wh hat you think of it.
Appendix x: Terminolo ogy Since dataa mining algoriithms come out o of the field d of statistics, there are som me terminologyy specifics thaat are worth notting. Binominaal – like the commonly used d term “binom mial” (which dooes not have tthe second “n n” and which iis pronounceed with the “long o” instead d of the shortt “o” used herre), it means oone of two valuues. Binominaal means thaat the values arre names (the source of “no omin,” like in “nominal” annd “nomenclatture”) and can n be numeric or o character baased. Binomiall means that itt is one of twoo numbers (num mbers only, no ot characters).
Page 4
www w.ArcLight.bizz
© 7/25/20133, Bonnie K. H Holub
Data Mining uses the terms “attribute” and “label” (or sometimes “class label”) in very specific ways. Here is how you can think of them in terms of data base or logic programming terms with which you may already be familiar: Data Base Term
Data Warehousing
Spreadsheets
Examples
Records, Tuples
Rows (typically)
Attribute
Field
Observations, Cases, Examples Variables, Attributes
Class Label, Category Dependent Attribute, or Target Attribute, Consequent Antecedent, Predictor Attribute, Independent Variable
Sometimes: Key Field
Page 5
Logic Programming
Columns (typically) Conclusion, Goal
Premise
www.ArcLight.biz
© 7/25/2013, Bonnie K. Holub