Spatial Aspects Concerning Economic Structures
online
José Luis Sánchez-Hernández, Enrique Ruiz-Budría, Susana Ramírez-García, Javier Aparicio-Amador, Eugenio Climent-López, Consuelo del Canto-Fresno Identifying Worlds of Wine Production: A Quantitative Approach
RUPRECHT-KARLS-
UNIVERSITÄT HEIDELBERG E X Z E L L E N Z U N I V E R S I TÄT
Issue 2014-01| Volume 12 www.spaces-online.com
online
Please quote as
Author
Keywords JEL codes
SPACES aims to present conceptual frameworks and empirical studies on economic action in spatial perspective to a wider audience. The interest is to provide a forum for discussion and debate in relational economic geography.
Sánchez-Hernández, José Luis; Ruiz-Budría, Enrique; Ramírez-García, Susana; Aparicio-Amador, Javier; Climent-López, Eugenio and del Canto-Fresno, Consuelo (2014): Identifying Worlds of Wine Production: A Quantitative Approach. SPACES online, Vol.12, Issue 2014-01. Toronto and Heidelberg: www.spaces-online.com. José Luis Sánchez-Hernández, Department of Geography, University of Salamanca, C/Cervantes 3, E-37002 Salamanca, Email:
[email protected] (corresponding author) Enrique Ruiz-Budría, Department of Geography and Regional Planning, University of Zaragoza, Email:
[email protected] Susana Ramírez-García, Department of Human Geography, Complutense University of Madrid, Email:
[email protected] Javier Aparicio-Amador, Department of Geography, University of Salamanca, Email:
[email protected] Eugenio Climent-López, Department of Geography and Regional Planning, University of Zaragoza, Email:
[email protected] Consuelo del Canto-Fresno, Department of Human Geography, Complutense University of Madrid, Email:
[email protected] worlds of production, resources, products, methodology, wine districts, Spain A13, B52, C43, L15, L66, Q18
Abstract The theory of worlds of production has been influential in food studies since the late 1990s. Worlds of production are defined as combinations of decisions taken through the interaction among producers and customers about two issues: the use of standardized or specialized resources, and the production of generic or dedicated goods. Nevertheless, the literature based on this theory is qualitative and based on case studies of single food clusters. This article tests an exploratory and quantitative methodology for classifying food clusters into the typology of worlds of production. The empirical support comes from a sample of sixteen Spanish wine districts. Twenty-one statistical indicators for each district have been calculated: eleven indicators are related to resources and ten ones are related to goods. Seven districts belong to the interpersonal world of production, which is consistent with the European model of wine production that highlights geographical origin. The rest of the sample splits among the other worlds of production. Implications are twofold: first, worlds of production are not internally homogeneous categories; second, tight regulation of the European wine industry does not hinder stakeholders from developing their locally-specific strategies to meet competition in markets.
Editors: Harald Bathelt, Johannes Glückler External Advisor: Heiner Depner ISSN: 1612-8974 © 2013 SPACES online. The authors maintain full copyright of the papers.
2
Identifying Worlds of Wine Production: A Quantitative Approach
1
Introduction
Literature about ‘worlds of production’ (WPs) flourished in the late 1990s, following the path-breaking article of Salais and Storper (1992) and, specially, their subsequent joint book’s theoretical and empirical development (Storper and Salais 1997). Both texts marginally explore different quantitative ratios to predict profitability at the company level in each of the four WPs: industrial, innovation, market and interpersonal. Nevertheless, WP-based research in economic geography has been fully qualitative and discursive. This bias is obvious in the sub-field of food production, distribution, and consumption, where this theoretical framework has been highly influential during the last fifteen years. Clusters of wine, cheese, fish, milk or meat producers (see Section 2 for a review) have been scrutinized from this perspective to highlight the differences in resource use and product orientation that support their inclusion in one of the four WPs. This article pretends to complement this qualitative approach by the design, testing and discussion of an exploratory quantitative methodology for classifying food-production clusters into the aforementioned fourfold typology of WPs. A sample of sixteen Spanish wine districts, which encompassed 706 producers in 2009 and accounted for 15.6 per cent of the Spanish wine labeled with the Protected Designation of Origin (PDO) quality scheme, supplies the empirical material for this methodological essay. Such a methodology may become a useful tool to inform wine value chain stakeholders’ strategies and local development policies, too, because it qualifies both producers and territories, highly interdependent in food production and marketing. In the context of food-oriented clusters, private actors and public authorities use to share common interests in two broad fields: resource use and product orientation, the two critical dimensions that underpin this methodology for qualifying wine districts into the WP typology. Although the choice of indicators is industry-specific, the overall methodological design is potentially suitable for further research on other food production clusters, and perhaps beyond the food industry as well. This way, it would be possible to compare different clusters within the same industry (e.g. dairy), different clusters within the same sector (food), and perhaps different clusters across different sectors (e.g. food, apparel, and furniture…). In addition, monitoring a cluster sample over time to check the trajectories of individuals within the WP framework constitutes another fruitful contribution of this methodology. The article is structured as follows. Section 2 develops the concept of ‘world of production’, emphasizing its recent influence on food studies. Section 3 explains the methodological design, including data, indicators and calculation procedures. Results are presented and discussed in Section 4. Section 5 highlights the main findings and suggests some further implications and applications of this methodology.
3
2
Worlds of production: from discourse to measurement
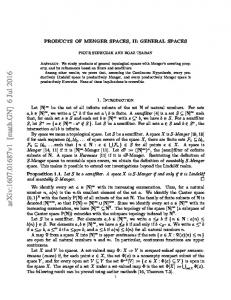
Salais and Storper’s (1992) strongest statement is that the industrial economy is founded on each company’s decisions about resources and markets, that is, about how to produce and for whom. Those decisions should result in profitable and marketable products that meet the mutual expectations of both producers and consumers. According to their proposal, ‘worlds of production’ are coherent combinations of micro-decisions taken over time by the continuous interaction among producers and customers along two main decisionmaking axis: first, the use of either standardized or specialized resources; second, the production of either generic or dedicated goods. Standardized resources and technologies are usually ubiquitous and suitable for achieving scale economies and low unitary prices. On the opposite, specialized resources are attached to specific places where an embedded community of experts has developed the ability to deliver products differentiated by their quality, design, origin or reliability. In addition, generic goods are mainly oriented towards large mass markets which are rather predictable in structure, volume and evolution. These are also termed ‘consolidated’ markets by Storper and Salais (1997). Dedicated goods are targeted towards specific consumer niches which appreciate product novelty, quality, tradition, differentiation, and even customization. By crossing the two dimensions, Salais and Storper (1992) and Storper and Salais (1997) identify up to four possible ‘worlds of production’: industrial (standardized resources for generic or consolidated markets; e.g. apparel, ironmongery), network or niche market (standardized resources for niche markets; e.g. cell phones, automobiles), interpersonal (specialized resources for dedicated products; e.g. crafts, luxury and designintensive industries) and innovation (specialized resources for generic products; e.g. microprocessors, pharmaceutics). A number of theorists (Murdoch and Miele 1999; Stræte 2004; Morgan et al. 2006) have adapted this typology to the specific case of food industry (Figure 1).
Figure 1
The four worlds of food production (authors’ design from Murdoch and Miele (1999); Straete (2004); Morgan et al. (2006)).
4
The world of mass industrial food production uses standardized technologies to achieve economies of scale in the delivery of huge amounts of generic (or slightly differentiated) food stuff to the mass consumer market. The industrial process is suitable for feeding large markets ruled by fierce price competition and also complies with demanding health standards (traceability, safety regulations) at the expense of very homogeneous tastes. The world of niche-market food production also relies on standardized technologies, but its products are focused on the specific demands of consumer niches which often prefer food differentiated by contextual factors or extrinsic qualities like brand reputation, geographical origin or convenient packaging. The world of local and interpersonal food production combines specialized production processes, developed by artisans or specialists who deliver traditional food to regular purchasers within a network of long-term trustbased relationships: organic food and small-scale local specialties are typical examples of this world of production. The world of high-technology food production applies technological innovations from biotechnology and pharmaceutics to deliver new kinds of products like nutraceutics, functional and GMO food, which include new features that exceed the nutritional values of ordinary food and allegedly try to improve consumers’ health and well-being. This theoretical pattern has been used in a number of case-studies which can be divided into two broad categories. First, those who discuss the profile of a single food cluster at a given moment and subsequently assess its position within the typology. Murdoch et al. (2000), Trabalzi (2007), Amilien et al. (2007) or Morgan et al. (2006) focus on local small-scale producers of yoghourt, lamb/beef meat, olive oil, fruit, vegetables, and different kinds of cheese (organic, mozzarella, Pélardon, Gammalost), located in Wales, Italy, Norway, France, and California. The opportunities and constrains of the production of food endowed with attributes of specialization and dedication (interpersonal WP) are usually highlighted in this literature, very often concerned with the linkage between food production, rural development, and sustainability. Kirwan (2006) stresses the particular role of farmers’ markets as a meeting point for this sort of WP so dependent on the close interaction between producers and consumers. In quite a similar vein, Lindkvist and SánchezHernández (2008) and Sánchez-Hernández (2011) have compared two food value chains (Norwegian salted fish and Spanish PDO wines) and discussed why the former still remains in the industrial WP while the latter has steadily adapted its technologies and marketing strategies to meet the requirements of the niche market WP. Secondly, some authors take a more dynamic perspective and underline the factors that explain the movement across the WP framework for eggs and meat producers (Murdoch and Miele 1999), dairy producers (Stræte 2004; 2008), and PDO wine districts (Sánchez-Hernández et al. 2010). Such a movement, usually from the industrial to the niche market WP, implies a deep change in the use of resources and in the markets addressed, so all these contributions have conceptualized the change to a new WP as a true example of technical, organisational and commercial innovation which involves every actor along the value chain. However, all this literature is purely qualitative in its research design, data sources, result presentation and discussion of their implications. The same applies to WP-based case studies beyond of the food industry, from racing car (Henry and Pinch 2000) and kit car production (Raven and Pinch 2003) to cartoon studios (Yoon and Malecki 2009). To our knowledge, an attempt to settle a reliable methodology for comparative studies about the relationship of food clusters and WPs has not been addressed yet in the field of economic geography. Accordingly, some questions remain hard to answer. How to check the position of any given food
5
district in the fourfold typology of worlds of food production? How to clearly identify its specific combination of standardized/specialized resources and generic/dedicated products? And how to compare a sample of clusters along these two dimensions? Therefore, the rest of this paper aims at the development, testing and discussion of a quantitative methodology for classifying food clusters in the WP framework. This methodology is still at an initial stage, so it is subject to further refinement and improvement. Nevertheless, it is helpful to sketch some answers to all these questions and, in doing so, opens a new path in research about food and WPs.
3
Wine clusters and worlds of food production: developing a methodology
The wine industry is specially suitable as a test field for this methodological essay because it encompasses a wide scope of produce that may properly fit into a WP perspective: branded wines, varietal wines, coupage wines, organic wines, aged wines, red wines, white wines, rosé wines, still wines, fortified wines, sparkling wines, non-alcoholic wines, cheap wines, affordable wines, icon wines… In addition, wine production is geographically clustered and wine is very often marketed with a strong appeal to its place of origin. Therefore, a linkage between wine production and the WP framework is not only interesting at the industry level, but also in a geographical perspective, because it may provide information about how local territorial resources are currently used and how the district’s wine is positioned in the domestic and foreign markets. Sixteen Spanish wine districts have been selected for this purpose (Figure 2). All of them belong to inland regions (Aragón, Castilla y León, Castilla-La Mancha) which are sparsely populated and where the wine economy makes a significant contribution to the socioeconomy, landscape and settlement pattern of its large rural areas. Madrid is, of course, a particular case: it is a huge metropolitan area with some rural internal peripheries in the Northern, Western and Southern borders; the latter still keeps some vineyards and wineries which are hypothesized to belong to a WP of their own. These sixteen wine districts follow the rules of the PDO food quality scheme, enacted by European Union authorities. PDOs bear the name of a wine-producing district with a long tradition, carefully delimited and rather homogeneous in climate and soil. Local wine producers must demonstrate before the Administration the singularity and authenticity of their wines, due to natural conditions, specific winemaking procedures and local grape varieties. In return, the authorities grant those producers with the exclusive right to use the PDO’s geographic name to co-label their wines in addition to their own trademarks. Each PDO is steered by a Regulatory Council whose members are grape-growers, wineries and regional authorities. The Council’s goals are threefold: guaranteeing a minimum quality of the wines co-labeled with the PDO’s hallmark, monitoring the use of the PDO’s name against counterfeiting, and launching marketing campaigns to promote these wines in domestic and foreign markets.
6
Figure 2: Localization of the PDO wine districts (authors’ design with data from Regulatory Boards and the Ministry of Agriculture).
Accordingly, wineries which voluntarily subscribe this scheme must locate their facilities within the PDO limits and should only process grapes harvested in the vineyards supervised by the PDO’s Regulatory Board. Authorized grape varieties are mainly local, whereas some other varieties, usually French ones, may be grown up within the PDO boundaries upon Board’s approval. Nevertheless, PDO-labeled wines do always include a higher proportion of the local grapes, so-called main varieties in the Regulatory Councils’ specifications. PDO districts thus operate as integrated wine clusters and are suitable for the goal of this article for two main reasons: geographical delimitation and data collecting. A quantitative methodology needs raw data to assess resource use and product orientation, and these data must be attached to a bounded territory. Therefore, PDO districts (Figure 2) are chosen as the basic geographical unit or scale to develop this quantitative and comparative methodology. This assumption simplifies the collection and processing of information and strengthens the geographical perspective because the comparison is not merely drawn among bundles of colocated companies, but among territories which are supposed to operate in different worlds of wine production due to their specific mix of resource use and product orientation. Quantitative data about wine PDOs in Spain are available from different sources. The Ministry of Agriculture, Food and Environment publishes an annual report that includes the basic figures and facts for all Spanish wine
7
PDOs. The two most widespread newspapers in Spain also publish their own catalogues of wines and wineries (El Mundo 2009; El País 2009), very detailed in their content and carefully updated every year. Most of Regulatory Boards also support a website with information and statistics about their members (grape-growers, wineries, vineyards, production), whereas there are sharp differences in scope and content across PDOs. An online survey was also designed and submitted by e-mail in summer 2010 to all the PDO-member wineries, but the response rate was just 25.8 per cent, ranging from 9.1 per cent to 42.8 per cent between PDOs: these results may be useful for a joint analysis of the whole winery population, but they were finally discarded for this PDO-level approach. In addition, semi-structured interviews were conducted with managers and/or technical staff from each PDO Regulatory Board in order to collect additional data for some of the indicators designed for this study.
8
Table 1: Proxy indicators for resource use and product orientation in a wine PDO (authors’ elaboration).
RESOURCES
Code
Meaning (Positive / Negative) (+) Standardized (-) Specialized
R1
Vineyard acreage planted with high-yielding varieties (% of the total PDO acreage)
R2
Vineyard acreage planted in trellis (% of the PDO acreage)
(+) Standardized (-) Specialized
R3
Wine production (average 2007-2009) divided by the number of wineries in the PDO
(+) Standardized (-) Specialized
R4
Vineyard acreage planted with global varieties (% of the total PDO acreage)
(+) Standardized (-) Specialized
R5
Wineries owned by non-local capital (% of the number of wineries in the PDO)
(+) Standardized (-) Specialized
R6
Vineyard acreage planted with local or main varieties (% of the total PDO acreage)
(+) Specialized (-) Standardized
R7
Wineries owned by local capital (% of the number of wineries in the PDO)
(+) Specialized (-) Standardized
R8
Vineyard acreage owned by cooperative firms (% of the total PDO acreage)
(+) Standardized (-) Specialized
R9
Wineries certified as ‘organic’ producers (% of the number of wineries in the PDO)
(+) Specialized (-) Standardized
R10
Organic vineyard acreage certified by the Regulatory Board (% of the total PDO acreage)
(+) Specialized (-) Standardized
R11
Vineyard acreage planted with endangered varieties (% of the total PDO acreage)
(+) Specialized (-) Standardized
P1
Non-aged wine qualified by the Regulatory Board (% of the total qualified)
(+) Generic (-) Dedicated
P2
Average price for the PDO’s wine bottle (75 cl)
(+) Dedicated (-) Generic
P3 P4 P5 PRODUCTS
Description
P6
P7
P8 P9 P10
Number of trademarks marketed by the PDO wineries divided by the number of wineries with their own trademarks Market segments (basic, popular premium, premium, super-premium, ultra1 premium I, ultra-premium II, icon) where the PDO wines are sold (Weaver Index) Trademarks marketed by the PDO wineries which appeal to local culture (% of the total number of trademarks) Wineries which rule on-site wine sales points (% of total number of wineries in the PDO) (P7a) Sum of each PDO wine’s ‘stars’ awarded by the Guía Peñín in 2009 and 2010, divided by the number of wineries in the PDO (P7b) Sum of each PDO wine’s ‘stars’ awarded by the 2009 Parker Guide, divided by the number of wineries in the PDO (average of Z points for both indicators) Wineries that arrange guided tours around their facilities and vineyards (% of the total number of wineries in the PDO) Medals and awards achieved by PDO wineries in the Bacchus (2010), Zarcillo (2009)and Bruxelles (2010) wine contests divided by the number of wineries in the PDO Wine certified as ‘organic’ by the Regulatory Board (% of the total volume qualified)
(+) Dedicated (-) Generic (+) Generic (-) Dedicated (+) Dedicated (-) Generic (+) Dedicated (-) Generic (+) Dedicated (-) Generic (+) Dedicated (-) Generic (+) Dedicated (-) Generic (+) Dedicated (-) Generic
1 Basic: 0-3; Popular Premium: 3-5; Premium: 5-7; Super-Premium: 7-14; Ultra-Premium I: 14-75; Ultra-Premium II: 75-150; Icon: more than 150 (Bernetti et al. 2006).
9
Two criteria have informed the design and choice of indicators. First, indicators should be calculated from raw data available in nation-wide current statistical or documentary sources; data requests from Regulatory Boards should be reduced at the minimum to avoid subjectivity on the part of researchers and/or interviewees and heterogeneity in data records. In this way, replication, addition of new case studies and future monitoring become much easier and affordable tasks. Secondly, a balanced distribution in the number of indicators for each dimension is necessary to get a coherent final assessment of the WP each PDO belongs to. So up to eleven indicators have been designed for resource use and ten ones for product orientation (see Table 1); P7 is made of two sub-indicators (P7a and P7b), so the true number of product-related indicators is also eleven. According to the dimension they belong to and to the content or meaning of each indicator, four groups can be distinguished. First, indicators related to standardization (R1, R2, R3, R4, R5, and R8) are all measuring the use of resources which are not PDO-specific, but available elsewhere to a greater or lesser extent. Accordingly, it is assumed that grapes from high-yielding varieties (R1) or collected from vineyard planted in trellis (R2), which also renders higher yields, are the basis of scale economies in large wineries (R3) which usually produce cheaper wines for mass markets. The average industrial size of wine cooperatives (R8) is much higher than the overall sample’s average and they have to accept all grapes supplied by their members, so their focus is more in quantity than in quality. The share of foreign grape varieties (R4) would represent a PDO’s effort to capitalize on the reputation of a widely known resource that, combined with local grapes, is supposed to improve access to larger and more homogeneous markets. A similar rationale explains the allocation of R5 (share of non-local producers) to this category: non-local producers mostly belong to larger wine (or food) corporations which are using standardized procedures, technologies, and distribution channels to reach a wider audience of wine consumers with a richer portfolio of wines from different places. Second, indicators related to specialized resources (R6, R7, R9, R10, and R11) highlight the use of localized and non-transferable assets. Therefore, two main indicators of specialization are the reverse of R4 and R5, ascribed to the previous category. The share of local grape varieties (R6) - the cornerstone of every PDO - and the share of local producers (R7) - who are knowledgeable of grape-growing and winemaking traditions measure the linkage between wine production and the PDO’s territory. Indicator R11 (share of endangered varieties) goes further in this direction by emphasizing the raising market strategy of endorsing ‘rareness’ to wines produced with grapes in risk of extinction and only available in very short series. The acquisition of organic labels (for wineries - R9 - or grape-growers - R10 - ) is included as a sort of specialized resource (an agricultural and industrial joint process, in this case) because it strengthens the localness and nonsubstitutability of the PDO’s grapes. Third, indicators related to generic products addressed to mass markets (P1 and P4) try to cover the two main features of a wine as a marketable item: the produce itself and the target market. A high share of non-aged wine (P1) suggests that the PDO is focusing on the most available and easy-to-drink wines. Indicator P4 is measuring the diversification or concentration of each PDO’s wine sales in the seven market segments. A high value of the Weaver index suggests that the PDO is striving to cover as many segments as possible, so its wines are available for most consumers. This corresponds to a generic positioning in final markets. On the opposite, a low value of the Weaver index means that the PDO is narrowly focused on few segments and is thus delivering dedicated wines tailored for a particular audience.
10
Finally, a fourth set of indicators (P2, P3, P5, P6, P7, P8, P9, and P10) captures the complex ways implemented by PDOs and wineries to make their wines different or dedicated in order to reach those consumers sensitive to features like novelty, tradition, sustainability or reputation. These singularities are often embodied in higher prices (P2), while cheap wines are linked to mass markets where competition is mostly ruled by price. A high score in P3 (average of trademarks by winery) means that the PDO is making several different wines to reach specific niches of consumers instead of delivering a lot of wine under the same brand. A high share of trademarks whose terms or images appeal to the local culture, landscape, history, or literature (P5) is reinforcing the link between produce and territory so important for a great share of wine lovers. Many of these concerned consumers often enjoy wine tourism, either in one-day excursions or in longer trips. Accordingly, high scores in indicators P6 (share of wineries which sell their wines on premises) and P8 (share of wineries which arrange guided tours to their facilities) underline the PDO’s engagement with these practices that enhance interpersonal trust and meet visitors’ demands of more information and experiences about the singularities of local wines. Wine guides and magazines are also a powerful tool for qualifying wines with the reputation of experts and critics whose assessments are very influential on final sales: P7 merges two well-known wine guides (Parker and Peñín) to calculate an average score for each PDO. High scores mean that a given PDO’s wines are achieving a differentiated profile in the market, since wine lovers usually monitor this sort of publications. The same applies for indicator P9, substituting ‘stars’ or ‘points’ in guides by medals awarded in three prestigious wine contests. Finally, P10 correlates indicators R10 and R11 by measuring the sensitivity of the PDO to the growing demand of organic wines among a group of highly concerned consumers.
11
Table 2: Table 2. Z-scores by indicator and PDO (authors’ elaboration according to Table 1. Dimension R = (R1+R2+R3+R4+R5-R6-R7+R8-R9-R10-R11) / 11. Dimension P = (-P1+P2+P3-P4+P5+P6+P7+P8+P9+P10) / 10). Interpersonal WP Code
Ribera del Duero
Toro
R1
-0,87
R2
0,16
R3
Industrial WP Uclés
Arribes
Tierra de León
-1,08
-1,08
-0,16
0,46
0,92
-0,68
1,00
-0,25
-0,70
-0,64
-0,94
0,04
-0,41
-0,53
-0,03
-1,24
-1,24
-0,23
0,62
0,75
0,11
-2,08
0,48
-0,26
1,30
1,30
-1,36
-0,38
-1,30
-0,79
0,76
1,06
0,95
-0,30
1,68
-0,89
0,69
0,58
-0,89
-0,89
R10
-0,41
-0,30
-0,52
-0,40
0,67
-0,52
-0,52
R11
-0,30
-0,30
-0,30
-0,30
-0,30
3,70
-0,30
P1
0,11
0,36
0,54
-0,55
-0,78
-2,37
-0,48
P2
2,45
0,54
0,43
0,65
-1,02
-1,29
-0,81
P3
-0,08
0,25
-0,07
-1,20
2,13
-0,99
P4
0,79
0,79
-0,05
0,79
-0,90
-1,75
Cigales
Arlanza
Calatayud Mondéjar
-0,73
0,01
-0,60
0,29
-0,98
-0,95
0,05
-0,94
-0,25
-0,54
-0,52
-0,70
R4
-1,10
-1,26
0,50
R5
0,20
2,14
R6
0,96
1,01
R7
-1,04
R8 R9
Niche-market WP
High-technology WP Vinos Tierra del Vino de de Zamora Madrid -0,05 -1,08
Bierzo
Cariñena
Rueda
Somontano
Campo de Borja
0,69
2,21
0,68
-0,37
1,93
0,21
1,08
-0,77
0,12
1,97
1,35
0,47
-0,66
-1,60
-0,68
-0,66
-0,52
2,05
0,45
0,24
2,41
-0,74
-0,60
0,45
0,03
0,25
1,76
-0,19
2,23
0,86
-1,06
-0,50
-1,24
1,75
-0,45
-0,32
-0,83
0,83
0,07
0,80
-0,08
0,17
0,45
-0,25
0,34
-0,04
-1,43
0,23
-2,84
-0,87
0,67
0,54
1,30
-1,60
0,23
-0,09
0,91
-0,81
0,03
0,22
0,17
-0,07
1,26
0,40
0,85
0,66
-1,46
-1,49
0,92
-0,09
0,02
-0,89
-0,89
0,32
-0,89
0,27
0,39
0,32
-0,89
2,30
-0,52
-0,52
-0,30
-0,41
-0,41
0,74
0,59
-0,52
3,35
-0,30
-0,30
-0,30
-0,28
-0,30
0,37
-0,30
-0,30
-0,17
-1,05
1,00
0,56
-0,26
1,18
-1,07
0,61
0,98
1,20
0,24
-0,55
0,31
-0,74
0,43
1,37
-0,73
-0,22
-1,06
-0,07
-0,57
-0,50
-1,27
-0,95
0,29
1,43
1,31
-0,55
0,86
-1,75
0,79
-0,05
0,79
-0,05
-0,05
0,79
0,79
0,79
-1,75
P5
0,34
0,59
1,21
1,26
0,19
0,85
-1,68
0,62
0,45
-0,43
-1,22
0,59
0,61
-0,53
-1,96
-0,89
P6
-0,06
-0,24
0,75
0,38
-0,25
1,63
1,63
-1,28
-0,10
0,67
-2,04
-0,37
0,87
0,19
-1,08
-0,72
P7
0,47
1,33
-0,62
-0,63
0,87
-0,67
-0,11
-0,75
-0,45
0,18
-0,06
0,17
0,38
0,40
-0,27
-0,25
P8
-0,04
0,32
0,61
-0,17
-0,95
2,45
-0,27
-0,95
-0,64
0,18
-1,55
-0,37
0,96
1,26
0,18
-1,02
P9
1,23
0,97
0,60
0,21
-0,51
-1,33
-0,19
-1,13
-0,99
-0,45
-0,05
2,54
0,01
0,29
-1,02
-0,19
P10
-0,24
-0,05
-0,40
3,65
0,49
-0,40
-0,40
-0,40
-0,40
-0,05
-0,40
-0,14
-0,32
-0,24
-0,40
-0,29
Dimension R
-0,19
-0,16
-0,12
-0,28
-0,37
-0,43
-0,15
0,50
0,20
0,19
0,60
0,21
0,51
0,52
-0,16
-0,87
Dimension P
0,32
0,26
0,20
0,39
0,26
0,44
0,03
-0,40
-0,41
-0,22
-0,67
0,20
0,56
0,05
-0,71
-0,30
12
Subsequently, a spreadsheet was designed that included the sixteen PDOs and the twenty-one indicators with the latest data available, typically 2009 or 2010. This 16 x 21 matrix was standardized into Z-scores2 to avoid the distortions resulting from the different size of each PDO and the heterogeneous units for each indicator (averages, percentages, indices...). Those Z-scores are displayed in Table 2. Cells with scores > 0,0 mean that the PDO achieves better results than the sample’s average in that indicator.
Figure 3
A sample of Spanish wine PDOs in the typology of worlds of food production (authors’ elaboration according to Figure 1 and Table 2).
2 The Z-score indicates how many standard deviations the value i of the variable is found. It is a ratio in which the numerator is the difference between the value of the variable i and the arithmetic mean of the values of the variable, and in which the denominator is the standard deviation. Z-scores have an arithmetic mean of 0 and a standard deviation equal to 1.
13
In order to allocate each PDO within the theoretical framework displayed in Figure 1, all the indicators of each dimension were reduced to a single figure (cf. the note at the bottom of Table 2). In the dimension of resources, indicators that measure standardization have a positive sign (sum) and indicators that measure specialization have a negative sign (subtraction): the overall sum is divided by eleven (the number of indicators for resources). In the dimension of products, indicators that measure dedication have a positive sign (sum) and indicators with a negative sign (subtraction) are those corresponding to generic production: the overall sum is divided by ten (indicators for products). It is assumed that all indicators weigh equally. Figure 3 shows the final outcome of this methodological process whose results are discussed in the next Section.
4
Results and discussion
According to Figure 3, seven PDOs belong to the interpersonal WP, four to the industrial WP, three to the niche market WP and only two to the high-technology one. This overall distribution is consistent with the notion of PDO, which enhances the European model of wine production differentiated by its geographical origin and addressed to consumers who are knowledgeable of those singularities related to local nature and tradition. Such a model is pervasive in Spain and official statistics report an increase of PDO-protected wine production and consumption every year. The seven PDOs in the interpersonal WP are made of small wineries (low R3) specialized in aged red wine (low R1). They also rely on local grape varieties (high R6) and their trademarks and brands draw on local traditions (high P5). Scores of local capital (R7), direct sales on premises (P6) and awards in contests (P9) are also high in four of the seven cases. In addition, score in number of trademarks (P3) is low, so they are developing a market identity sharply targeted on specific consumers. This WP includes two large PDOs, Ribera del Duero and Toro, whose aged red wines enjoy a great reputation for quality and local embeddedness. Their model has been closely imitated by smaller districts in the same region of Castile and Leon (Cigales and Arlanza, see Figure 2) which have switched from their former specialization in rosé wines to benefit from the popularity of quite expensive (high P2) red ones. In a similar vein, youngest and smaller PDOs in the other regions (Calatayud, Uclés, Mondéjar) who cannot compete with larger and more experienced ones are focusing on local resources and dedicated red wines to meet the never-ending demand of connaisseurs for new districts and new wines. In sum, this set of locally-embedded producers focused on a limited range of quality stuff demanded by narrow market segments complies with the concept of an interpersonal WP. The remaining WPs include far less PDOs and, to some extent, can be described as variants of the main interpersonal model. The industrial WP’s core product is a red wine for daily consumption which lacks the traits of specialty or distinctiveness attached to the former category. This industrial WP includes four PDOs leaded by large cooperative companies (R8) which make wine from high-yielding (R1) varieties and also rely on global varieties (R4) above the sample’s average. They score very low in medals and awards (P9), so their quality is not outstanding, and the number of trademarks (P3) is also low, so they are probably concentrating their marketing efforts in developing well-known brands for the mass market. The PDO Cariñena has for long borne a reputation of lower quality and cheap prices, the same as Arribes and Tierra de León, where cooperative firms are the most important players in the industry. The PDO Bierzo shares the main features of this model, but it is located closer to the centre of the chart because it highly relies on a specific resource (the Mencía grape is only found in this area). Therefore, these PDOs meet the concept of an industrial WP:
14
reliance on (more) standardized resources to supply a wine that does not fully compete in the more demanding segments of the market. The PDOs which belong to the niche-market WP are also focusing their wines to more knowledgeable consumers who are interested in novelty and difference. But these three districts (Rueda, Somontano and Campo de Borja) keep apart from the canonic interpersonal model because they draw on more standardized resources. In this point, all three PDOs share some common traits: greater role of non-local firms (R5) and search for scale economies (trellis-R2, and wine production per winery-R3). The fact that these PDOs produce high-quality white wines (namely Rueda, but some Somontano producers too) in addition to red ones explains those scores: white-wine production usually demands larger processing facilities because most of the produce is sold without aging and must be bottled and delivered quickly. In addition, big food and wine corporations have settled down their branch wineries in these PDOs to include these local specialties in their portfolios. This diversification strategy looks smart because these PDOs’ wines outperform in guides (P7) and contests (P9), that is, they enjoy a very good reputation among trendy consumers. High values of P3 (trademarks per winery) are also consistent with the more complex wine supply from these PDOs (Somontano being the most remarkable case, with the highest value of dimension P), that encompasses red, white, sparkling, and also organic wines (high values of R9). All in all, this profile matches with the theoretical definition of a niche market WP where (rather) standardized resources are used to deliver a wide range of dedicated products, including the upper segments of the market (high P2 in Rueda and Somontano). Finally, two PDOs fall into the so-called high-technology food WP. Its members are the least conventional PDOs of the sample. Tierra del Vino de Zamora is the smallest PDO in terms of production, so the results for dimensions R and P should be cautiously assessed. Vinos de Madrid is the only PDO located in the fringe of a large metropolitan region and its results were supposed to be influenced by this geographical issue from the very beginning of the research: its position in the chart is highly expressive of its singularity. These PDOs are not delivering any high-tech or functional wines (e.g. non-alcoholic, canned), so they cannot benefit from any monopolistic market position, as it is often the case for innovative foods. In opposition to theoretical predictions, wines from these districts are not easy to find in the marketplace because the production is quite scarce. So, how is it possible to make sense of these two PDOs in the WP framework? In their original conceptualization, Salais and Storper (1992) used to term this combination of resources and products as the world of innovation: a community of producers who rely on specialized resources to design goods purported to be massively used in final markets. To some extent, this definition accounts for the path chosen by these two districts. They are using specialized resources (high R6, low R1-high yielding varieties, R2-trellis, and R3-winery size) to make non-aged wines (high P1) which are sold at cheap prices (low P2) and lack of market reputation (low P7 and P9) and attachment to local culture (low P5). This practice may be understood as an under-exploitation of the potential of engagement in the interpersonal WP, where these local grapes are used to make aged and more expensive red wines. Instead of capitalizing on local resources to meet the demands of novelty and origin from the upper segments of the market, these districts are producing generic and affordable wines. It must be noticed that the high scores of Vinos de Madrid in indicators related to organic production (R9, R10) are simultaneously explaining its very peripheral position in Figure 1 and the dismissal of opportunities from the growing market segment of organic wine. This descriptive discussion raises four main implications at the theoretical level. First, both the statistical results and their representation in the chart demonstrate that worlds of (wine) production are not homogeneous or monolithic entities, but include a plurality of possibilities within each main category. In
15
addition to some basic common features within each WP, there are also different combinations of resource use and market orientation at the local level that finally fall into the same broad WP. This finding opens up a number of opportunities for producers and territories to build their own distinctive profile within a given WP by combining their resources on locally contingent ways. Secondly, the same applies to the very concept of PDO. These food quality schemes have been subject to both progressive and neoliberal criticism for their alleged elitism, parochialism, protectionism, and conservatism. PDOs as a whole are supposed to preserve tradition and reject innovation. These results clearly show that PDOs, and their somewhat strict rules, are not at odds with diversity: there is a strong core of practices embodied in the interpersonal WP, but local contingency related to size, location, specialization, or corporate strategies may explain the development of place-specific combinations of resources and products. Therefore, thirdly, it is possible for industrial clusters, wine PDOs in this case, to move across the WP frame by the reflexive re-combination of available resources and the re-orientation of their products. Storper and Salais (1997) already discussed this possibility from a theoretical perspective, but our operationalization sheds light on the changes which are necessary to shift a cluster’s position in the fourfold WP typology. Fourth, it is possible to measure the foundations of the four WPs and, at the same time, to avoid any kind of qualification in terms of good or bad models, a temptation that arises when comparing, for instance, (old fashioned?) industrial to (smarter?) interpersonal or innovative WPs. Indicators for profitability, sustainability, market share, or social welfare might be included in future refinement of this methodology to support a more qualitative judgment of each WP’s overall results.
5
Conclusions
An exploratory quantitative methodology has been designed, tested and discussed in this article to classify food clusters in the theoretical framework of WPs. Eleven indicators for resource use and ten more ones for product orientation have been calculated in sixteen wine PDOs from different Spanish regions. Raw data come from readily available sources for the sake of comparison, verifiability and future monitoring of each cluster/PDO evolution. In this sense, the methodology suggests a new research avenue beyond the current qualitative literature based on one or two case studies. This quantitative methodology turns WP theory into practice because the sixteen cases are split into the four possible worlds. Namely, the internal diversity of the sample is properly unveiled by this methodology. This is an important finding because PDOs are usually conceptualized as a one-size-fits-all model of food production and this methodology demonstrates that their resources and products are used and targeted in quite different ways. Furthermore, the cases allocated to each WP fit into its theoretical formulation, quite neatly for the industrial, interpersonal and niche-market categories. However, in addition to the basic similarities within each WP, the mix of resource use and product orientation for each PDO reflects some local singularities. This fact implies that WPs are not rigid categories, but allow for some internal diversity as well. The accuracy of this methodology is underpinned by the allocation of 43.75 per cent of the sample to the interpersonal WP, whose theoretical foundations fulfill the European model that links wine’s intrinsic and extrinsic qualities to its geographical origin. A comparison of this dataset with another sample of wine districts from the so-called New World producers (California, Australia, South Africa, Chile, Argentina) would be helpful to test to which extent this methodology is contextual or suitable for application outside Europe.
16
Another potentially controversial point is related to the high-technology/innovative WP: the two PDOs cannot be properly labeled in those terms, even though their strategies loosely fit into the original conceptualization of this WP. Three options come up at this point. First, there are no truly innovative/high-tech cases in the sample, according to the prevailing definition of this WP. Second, new indicators should be developed to capture the dynamics of this WP carefully. Third, the notion of a high-tech/innovative world of food production needs further refinement to be tested in the empirical realm or is only suitable for a narrow range of food value chains. From the standpoint of the application of geographical knowledge, this methodology may be relevant because its indicators measure both economic and territorial facts. This is possible, of course, due to the bounded nature of the PDO system itself and its agro-industrial nature, but the localized nature of food production clusters, at least in Europe, smoothes future attempts to extend this essay to other case studies. Advantages are not only related to data collection, but to territorial governance of food clusters too. Both economic stakeholders and local-territorial authorities may benefit from this potentially useful tool for comparing themselves with competitors from other food clusters/districts and for taking informed and cooperative decisions about strategic planning. Indicators provide rich information about the way to move to a different WP from the actual set of local resources, for instance. In the context of a reflexive capitalism (Storper, 1997), economic actors -both individual and collective- have the chance to reflect upon their position in the global economy, capitalize on their internal strengths and react upon external threatens. Such a dynamic extension of the methodology, designed for a static snapshot of a cluster sample, constitutes a promising field for applied geography.
17
Acknowledgements The authors are grateful for the support of the research project grant «Governance, innovation and conventions in the wine districts of Spain: typology and prospective of designations of origin based on the theory of worlds of production», funded by the Spanish Ministry of Science and Innovation (ref. CSO200805793-C03/GEOG) and the Regional Government of Castilla y León (ref. SA080A08) during the period 20082011.
18
References Amilien, V., Forth, F. and Ferras, N. (2007): Hyper-real territories and urban markets: changing conventions for local food – case studies from France and Norway. Anthropology of Food Special Issue 2. http://aof.revues.org/446 (17.01.2014). Bernetti, I., Casini, L. and Marinelli, N. (2006): Wine and Globalisation: Changes in the International Market Structure and the Position of Italy. British Food Journal 108: 306-315. EL MUNDO (2010): Catálogo de Bodegas y Vinos de España. EL MUNDO, Madrid. EL PAÍS (2010): Anuario de los Vinos de España. EL PAÍS, Madrid. Henry, N. and Pinch, S. (2000): Spatialising Knowledge: Placing the Knowledge Community of Motor Sport Valley. Geoforum 31: 191-208. Kirwan, J. (2006): The Interpersonal World of Direct Marketing: Examining Conventions of Quality at UK Farmers’ Markets. Journal of Rural Studies 22: 301-312. Lindkvist, K.B. and Sánchez, J.L. (2008): Conventions and Innovation: A Comparison of Two Localized Natural Resource-Based Industries. Regional Studies 42: 343–354. Ministerio de Agricultura, Alimentación y Medio Ambiente (2014): Denominaciones de Origen Protegidas (D.O.P.) e Indicaciones Geográficas Protegidas (I.G.P.): Cifras y datos. http://www.magrama.gob.es/es/alimentacion/temas/calidad-agroalimentaria/calidaddiferenciada/dop/htm/cifrasydatos.aspx (14.08.2013). Morgan, K., Marsden, T. and Murdoch, J. (2006): Worlds of food: Place, power, and provenance in the food chain. Oxford University Press, Oxford. Murdoch, J., Marsden, T. and Banks, J. (2000): Quality, Nature and Embeddedness: Some Theoretical Considerations in the Context of the Food Sector. Economic Geography 76: 107-125. Murdoch, J. and Miele, M. (1999): ‘Back to Nature’: Changing ‘Worlds of Wroduction’ in the Food Sector. Sociologia Ruralis 39: 465-483. Raven, Ch. and Pinch, S. (2003): The British Kit Car Industry: Understanding a 'World of Production'. European Urban and Regional Studies 10: 343-354. Salais, R. and Storper, M. (1992): The Four ‘Worlds’ of Contemporary Industry. Cambridge Journal of Economics 16: 169-193. Sánchez, J.L. (2011): The Food Value Chain as a Locus for (Dis)Agreement: Conventions and Qualities in the Spanish Wine and Norwegian Salted-Cod Industries. Geografiska Annaler Series B – Human Geography 93: 105-119.
19
Sánchez, J.L., Aparicio, J. and Alonso, J.L. (2010): The Shift between Worlds of Production as an Innovative Process in the Wine Industry in Castile and Leon (Spain). Geoforum 41: 469–478. Storper, M. (1997): The regional world: Territorial development in a global economy. The Guilford Press, New York. Storper, M. and Salais, R. (1997): Worlds of production: The action frameworks of the economy. Harvard University Press, Cambridge MA. Stræte, E.P. (2004): Innovation and Changing ‘Worlds of Production’: Case-Studies from Norwegian Dairies. European Urban and Regional Studies 11: 227-241. Stræte, E.P. (2008): Modes of Qualities in Development of Speciality Food. British Food Journal 110: 62-75. Trabalzi, F. (2007): Crossing Conventions in Localized Food Networks: Insights from Southern Italy. Environment & Planning A 39: 283-300. Yoon, H. and Malecki, E.J. (2009): Cartoon Planet: Worlds of Production and Global Production Networks in the Animation Industry. Industrial and Corporate Change 19: 239-271.