Apr 23, 2017 - scuffing them up with a stick or by throwing sand or earth over them, to ensure that they are not counted twice. The same sites are then checked ...
2017 DWT Otter Survey Introduction The fifth DWT Spring Otter Survey took place over the weekend of the 22nd/23rd April 2017. The surveys are carried out across the entire DWT area, which follows the boundary of the 1966 Vice County, and slightly beyond. It stretches from the River Tees in the south to the River Tyne in the north, and from the border with Cumbria in the west to the North Sea coast in the east and encompasses an area of around 3,000 km2. For the third year Tees Valley Wildlife Trust also joined the survey and thereby increased the number of patches covered in the Tees Valley. Methodology Following the methodology that has been used by the Somerset Otter Group in Somerset, South West England for over two decades we have trained more than 120 volunteer, citizen science surveyors in identifying otter field signs. Each volunteer surveyor is then allocated a ‘patch’ of watercourse, either close to where they live or somewhere they frequent regularly. Within that ‘patch’ the surveyor identifies a number of ‘sites’ which are either known or likely spraint spots e.g. bridges, prominent rocks or the confluence of two watercourses. On the weekend of the survey the volunteer surveyors check their sites for field signs on both mornings. Spraint and/or tracks found on the first morning are recorded with a grid reference or latitude/longitude coordinates and the signs are then marked in some way, either by scuffing them up with a stick or by throwing sand or earth over them, to ensure that they are not counted twice. The same sites are then checked on the morning of the second day. Any field signs found on Day 2 that were definitely not there the day before indicate otter activity the previous night and are classified as a ‘hit’. The data points of second day ‘hits’ are then mapped in GIS software and allocated to discrete territories. Additionally, if very fresh spraint is found on the first day but not on the second, in an area that is sufficiently isolated from any other survey area/watercourse that would make it unlikely that an otter could have travelled between them in one night, it is classified as a ‘near miss’. Also, in some survey patches remote-capture cameras are deployed during the survey. If no fresh spraint is found in that patch but an otter is captured on camera it is classified as a ‘reasonable suspicion’ otter territory (providing the same criteria are met as for the ‘near miss’). The analysis estimates the number of active otter territories not individual animals. It is reasonable to assume that many of the adjudicated territories will contain females with cubs meaning the number of actual otters will be greater than the number of territories. This is as
accurate as we can be when surveying for an elusive, wide-ranging, cryptic animal that has no individually identifiable markings. Caution is always used when allocating ‘hits’ to territories therefore fresh signs are generally lumped together into one territory rather than split into two if they are in close proximity to each other. Results summary There were five visuals of otters over the survey weekend, one of which was on a camera trap, but the other four were live sightings. Weather conditions this year were generally good with some rain on Friday night providing a nice clean, soft substrate for tracks and the weekend was then dry with sunshine in many areas. Over the weekend 99 teams of volunteers checked a patch of watercourse amounting to over 120 people in total. Due to some volunteer surveyors doubling up and checking more than one patch the total number of patches covered was 114. The number of sites contained in those patches was 629. There were however 45 empty patches due to a slight reduction in volunteer numbers, late drop-outs due to illness and the non-returned forms of a few participants. Of the 629 sites checked 272 (43%) were positive for otter signs which is a very slight decrease from last year. A further 20 sites had possible or inconclusive signs. There were 337 sites (54%) which were totally negative – an almost identical percentage to 2016 (Figure 1). There were 70 Day 2 ‘hits’ (fresh signs) which is down on last year but within the range of previous years. As usual, many of these ‘hits’ were close together in the same or neighbouring patches and so have been adjudicated to belong to a single territory. There were four patches where fresh deposits were found on Day 1 but nothing new was discovered on Day 2, and that were sufficiently isolated from the next nearest ‘hit’, allowing us to be fairly confident that we were just not looking in the right place on the Sunday. These have been adjudicated as ‘Near Miss’ otter territories. There was also a sighting of two otters the week after the survey weekend on a patch that is totally isolated from all neighbouring patches and where we had no surveyor. This has been adjudicated as a Reasonable Suspicion territory.
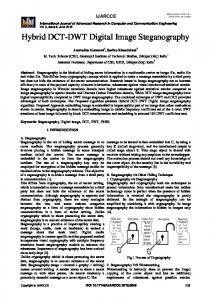
Figure 1. Locations of surveyed sites in 2017 survey. The number of estimated territories this year was 37 which is two more than last year and the highest total yet, although still within the range of previous years (Table 1). It remains to be seen if the otter population is still increasing or has reached its limit.
Table 1. Summary of DWT Annual Otter Surveys
April 2013 Patches Total sites Sites positive % sites positive % sites negative ‘Hits’ Located territories Near misses/Reasonable suspicion Adjudicated territories
93 517 216 42 56 59 26 3 29
Surveys Summary April 2014 April 2015 100 112 588 608 212 260 36 43 60 53 67 56 29 27 6 9 35
36
April 2016 119 644 281 44 53 78 30 5
April 2017
35
37
114 629 272 43 54 70 32 5
Conclusion This being the fifth year of the survey it is once again reassuring that the results are remarkably consistent with those from previous years. Not only does this give us confidence that we are getting things about right, but it also suggests that the otter population is relatively stable at this time. Whether that population is at carrying capacity (the maximum number of animals that can be supported in a given environment in terms of food and habitat) or not it is difficult to say. It is also impossible to know how the current population compares with the historic population as there are no figures to compare with.