20 Pentium 4 1.8. 500 PBS Innsbruck. Table 27.1: The Austrian Grid infrastructure. Austria: Innsbruck, Linz, Salzburg, and Vienna. The Austrian Grid currently.
27 ASKALON: A Development and Grid Computing Environment for Scientific Workflows Thomas Fahringer, Radu Prodan, Rubing Duan, J¨ urgen Hofer, Farrukh Nadeem, Francesco Nerieri, Stefan Podlipnig, Jun Qin, Mumtaz Siddiqui, Hong-Linh Truong, Alex Villazon, and Marek Wieczorek
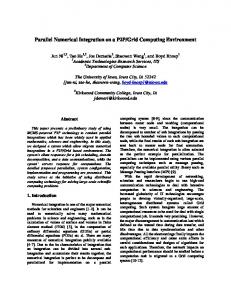
27.1 Introduction Most existing Grid application development environments provide the application developer with a nontransparent Grid. Commonly, application developers are explicitly involved in tedious tasks such as selecting software components deployed on specific sites, mapping applications onto the Grid, or selecting appropriate computers for their applications. Moreover, many programming interfaces are either implementation-technology-specific (e.g., based on Web services [24]) or force the application developer to program at a low-level middleware abstraction (e.g., start task, transfer data [22, 153]). While a variety of graphical workflow composition tools are currently being proposed, none of them is based on standard modeling techniques such as Unified Modeling Language (UML). In this chapter, we describe the ASKALON Grid application development and computing environment (see Figure 27.1) [137], whose ultimate goal is to provide an invisible Grid to the application developers. In ASKALON, the user composes Grid workflow applications graphically using a UMLbased workflow composition and modeling service. Additionally, the user can programmatically describe workflows using the XML-based Abstract Grid Workflow Language (AGWL), designed at a high level of abstraction that does not comprise any Grid technology details. The AGWL representation of a workflow is then given to the ASKALON WSRF-based middleware services (runtime system) for scheduling and reliable execution on Grid infrastructures. The Resource Manager service is responsible for negotiation, reservation, allocation of resources, and automatic deployment of services required to execute Grid applications. In combination with the AGWL, the Resource Manager shields the user from the low-level Grid middleware technology. The Scheduler is a service that determines effective mappings of single or multiple workflows onto the Grid using graph-based heuristics and
27 ASKALON
(UML)
Scheduling & Optimization
Application Composition
Execution Control
Fault Management
451
(AGWL)
Analysis of Non-Functional Parameters
Web Services
Resource/ Service Management
Measurement/ Monitoring of NonFunctional Parameters
Prediction of Non-Functional Parameters
QoS/SLA Management
Grid Infrastructure
Job Submission
File Transfer
Information Service
Security
Figure 27.1: The ASKALON architecture. optimization algorithms that benefit from Performance Prediction and Resource Manager services. Additionally, the Scheduler provides Quality of Service (QoS) by dynamically adjusting the optimized static schedules to meet the dynamic nature of Grid infrastructures through execution contract monitoring [365]. The Execution Engine service targets reliable and fault-tolerant execution of workflows through techniques such as checkpointing, migration, restart, retry, and replication. Performance Analysis supports automatic instrumentation and bottleneck detection (e.g., excessive synchronization, communication, load imbalance, inefficiency, or nonscalability) within Grid workflow executions. We are currently extending our analysis to comprise service-level negotiation and agreement on a variety of nonfunctional parameters. A Performance Prediction service estimates execution times of workflow activities through a training phase and statistical methods using the Performance Analysis service.
27.2 Workflow Case Study and Grid Infrastructure We present the functionality of the ASKALON environment for modeling, specification, scheduling, and performance-oriented execution of scientific
452
Fahringer et al.
workflows in the context of a real-world material science application deployed on the Austrian Grid infrastructure. WIEN2k [52] is a program package for performing electronic structure calculations of solids using density functional theory, based on the fullpotential (linearized) augmented plane-wave ((L)APW) and the local orbital (lo) method. We have ported WIEN2k as a Grid application by splitting the monolithic code into several coarse-grained activities coordinated in a workflow, as illustrated in Figure 27.2. The LAPW1 and LAPW2 activities can be solved in parallel by a fixed number of so-called k-points. A final activity, converged, applied on several output files, tests whether the problem convergence criterion is fulfilled. The number of recursive loops is statically unknown. For the experiments that we will present throughout this chapter, we have solved a problem case with 252 parallel k-points (i.e., size of the two parallel sections – LAPW1 and LAPW2). We have chosen a problem size of 8.5, which represents the number of plane-waves used and is equal to the size of the eigenvalue problem (i.e., the size of the matrix to be diagonalized). ASKALON serves as the main application development and computing environment for the Austrian Grid [33] infrastructure, which aggregates over 300 processors geographically distributed across several different sites in
Figure 27.2: The WIEN2k workflow.
27 ASKALON Site Altix1.jku Altix1.uibk Schafberg Gescher Agrid1 Arch19 Arch20 Arch21
Architecture NUMA, SGI Altix 3000 NUMA, SGI Altix 350 NUMA, SGI Altix 350 COW, Gigabit Ethernet NOW, Ethernet NOW, Ethernet NOW, Ethernet NOW, Ethernet
# 14 14 14 16 20 20 20 20
CPU Itanium 2 Itanium 2 Itanium 2 Pentium 4 Pentium 4 Pentium 4 Pentium 4 Pentium 4
GHz 1.6 1.6 1.6 3 1.8 1.8 1.8 1.8
RAM 61408 15026 15026 1024 512 500 500 500
Mgr. Fork Fork Fork PBS PBS PBS PBS PBS
453
Location Linz Innsbruck Salzburg Vienna Innsbruck Innsbruck Innsbruck Innsbruck
Table 27.1: The Austrian Grid infrastructure. Austria: Innsbruck, Linz, Salzburg, and Vienna. The Austrian Grid currently uses Globus Toolkit version 2 [144] as the main platform for security, job submission, file transfer, and resource information. Table 27.1 summarizes a subset of the Austrian Grid that we have used for the results presented in this chapter. The SGI Altix 3000 parallel computer in Linz has a total of 64 processors, while the Altix 350 computers in Innsbruck and Salzburg both comprise 16 parallel processors. However, the local system administrators only provide 14 concurrent processors to a regular Austrian Grid user, which is also the machine size that we used in our experiments. The Grid site in Vienna (Gescher) is a Beowulf cluster, while the four workstation network sites in Innsbruck are labs intensively used by students during the day but automatically rebooted in Grid mode during the night, weekends, or holidays.
27.3 Workflow Generation ASKALON offers the users two interfaces for generating large-scale scientific workflows in a compact and intuitive form: graphical modeling using the UML standard (see Section 27.3.1) and a programmatic XML-based language (see Section 27.3.2). 27.3.1 UML Modeling-Based Workflow Composition ASKALON offers to the end user the privilege of composing workflows through a graphical modeling service based on the UML standard that combines Activity Diagram modeling elements in a hierarchical fashion. We have implemented this graphical service as a platform-independent workflow editor in Java based on the Model-View-Controller paradigm comprising three main components: graphical user interface (GUI), model traverser, and model checker. The GUI consists of the following components: menu, toolbar, drawing space, model tree, and element properties. The drawing space consists of a tabbed panel that can contain several diagrams. The model traverser provides the possibility to walk through the model, visit each
454
Fahringer et al.
Figure 27.3: The WIEN2k UML representation. modeling element, and access its properties (for instance, element name). We use the model traverser for the generation of various model representations; for instance, an XML representation serves as input for the ASKALON Grid environment. The model checker is responsible for the correctness of the model. Figure 27.3 shows the UML representation of the WIEN2k workflow, which consists of several diagrams. The hierarchical representation allows the user to focus on the basic constructs of the full workflow and easily understand them. The left panel shows the main sequential outermost while loop, called whileConv, which embraces the entire workflow. The workflow inputs and outputs are specified by opening additional dialog boxes that define the input and the output ports of this activity. To display the loop body that implements one iteration of the while loop, the user selects the Edit/Loop Body menu item in the pop-up menu or selects the second loop body node. As a consequence, the loop body of the while loop is displayed, as shown in the right window, with arrows representing the control flow dependencies. For each activity, the user specifies typed data input and output ports through a special dialog box, as shown in the right window of Figure 27.3.
27 ASKALON
455
27.3.2 Abstract Grid Workflow Language We have designed an XML-based workflow language that enables the description of workflow applications at a high level of abstraction that shields the user from the middleware complexity and dynamic nature of the Grid. The Abstract Grid Workflow Language (AGWL) [138] enables the composition of workflow applications from atomic units of work called activities interconnected through control-flow and data-flow dependencies. Activities are represented at two abstract levels: activity types and activity deployments. An activity type is a simplified abstract description of functions or semantics of an activity, whereas an activity deployment (not seen at the level of AGWL but resolved by the underlying Resource Manager) refers to an executable or deployed Web service and describes how they can be accessed and executed on the Grid. In contrast to most existing work, AGWL is not bound to any implementation technology such as Web services. The control-flow constructs include sequences, directed acyclic graphs (dag), for, forEach, while and do-while loops, and if and switch constructs, as well as more advanced constructs such as parallel activities, parallelFor and parallelForEach loops, and collection iterators. In order to modularize and reuse workflows, so-called subworkflows can be defined and invoked. Basic data flow is specified by connecting input and output ports between activities, while more advanced data-flow constructs include collections and access to abstract data repositories. Optionally, the user can specify properties and constraints for activities and data-flow dependencies that provide functional and nonfunctional information to the runtime system for optimization and steering of the Grid workflow execution. Properties define additional information about activities or data links, such as computational or communication complexity, or semantic description of workflow activities. Constraints define additional requirements or contracts to be fulfilled by the runtime system that executes the workflow application, such as the minimum memory necessary for an activity execution or the minimum bandwidth required on a data-flow link. The AGWL representation of a workflow can either be automatically generated from the UML representation or manually written by the end user. In both cases, AGWL serves as input to the ASKALON runtime middleware services (see Figure 27.1). Figure 27.4 illustrates a representative excerpt of the WIEN2k AGWL representation, which can be automatically generated from the UML representation or manually written by the end user. The highest level of the WIEN2k workflow consists of a while loop whileConv. In this while loop, the activities LAPW0, pforLAPW1 (parallel for loop), LAPW2 FERMI, pforLAPW2 (parallel for loop), and MIXER are invoked sequentially. The activities pforLAPW1 and pforLAPW2 are parallel for loops that execute a large number (i.e., 252 for the case study considered) of LAPW1 and LAPW2
456
Fahringer et al.
... whileConv/overflag ... ...
Figure 27.4: WIEN2k AGWL excerpt. activity invocations in parallel. It is important to notice at this stage that one runtime output port of the activity LAPW0 called kpoints (see also Figure 27.3) represents the number of parallel loop iterations that will be executed by the following parallel loops (i.e., pforLAPW1 and pforLAPW2), which is statically unknown. Therefore, the workflow can dynamically change its shape at runtime, depending on the runtime value of this output port. The condition to exit the outermost while loop refers to the data loop port overflag, which can be changed after each iteration by the data output port of the activity MIXER referred by the loopSource attribute. Finally, the output port overflag returns the final result of the workflow.
27.4 Resource Manager ASKALON’s Resource Manager, called GridARM, renders the boundaries of Grid resource management and brokerage and provides resource discovery,
27 ASKALON
457
advanced reservation, and virtual organization-wide authorization along with GLARE, a dynamic registration framework for activity types and activity deployments [383]. GridARM covers physical resources, including processors, storage devices, and network interconnections, as well as logical resources comprising Grid/Web services and executables. Based on Scheduler requests, the GridARM discovers resources or software components, performs user authorization to verify resource accessibility, optionally makes a reservation, and returns the result. The result could be a list of resources along with their specifications, a list of software components, or a reservation ticket, depending on the request type. In case of a failure, a Resource Manager can interact with other GridARM instances distributed in the Grid to recursively discover and allocate the required resources. Moreover, the GridARM monitors the allocated resources and propagates exceptional situations to the client. It also works as coallocation manager. Grid resource discovery and matching are performed based on the constraints provided by the Scheduler in the form of a resource request (see Section 27.5). The GridARM can be configured with one or more Monitoring and Discovery services [101] (of Globus versions 2 and 4) and the Network Weather Service [472]. Advanced reservation of the Grid resources (including computers and software components) based on the constraints provided by the requester is a distinguishing feature of the Resource Manager. The Scheduler can negotiate for a reservation based on time, cost, and QoS models. The essential attributes of a reservation include resource contact information, time frame, and resource requester and provider constraints. The acquisition of reserved resources by the Execution Engine is only possible by providing a valid user credential based on which the reservation was made or a valid reservation ticket. GLARE, as part of GridARM, is a distributed framework for dynamic registration, automatic deployment, and on-demand provision of workflow activities. The framework provides an effective mapping between high-level application descriptions (called activity types) and actual installations (called activity deployments) on specific Grid sites. Activity types are described in a hierarchy of abstract and concrete types. Concrete types may have activity deployments that are shielded from the Grid application developer. On-demand deployment of activities is triggered automatically when they are requested by the client. GLARE is built based on a superpeer distributed framework. Figure 27.5 illustrates a real-world example of a concrete activity type of WIEN2k [52] called wien:lapw0, which inherits generic wien2k and wien types. The activity type wien:lapw0 can have two activity deployments: a legacy executable, lapw0, and a WSRF-compliant service called WS-WienLAPW0, both visible to the GLARE framework only internally. GLARE performs on-demand installation of these activity deployments and maps them automatically to the activity types, thus shielding the Grid from the application developers.
458
Fahringer et al.
Activity Types
Wien
wien2k
wien:LAPW0
Visible to Clients/Application Developers Invisible to Clients/Application Developers
lapw0
Activity Deployments
WS-WienLAPW0
Visible to GLARE
Executable
Web/Grid Service
Figure 27.5: WIEN2k activity type to deployment mapping. We have developed a graphical console to GridARM and GLARE that can be used to browse current Grid sites and the activity types available (see left panel of Figure 27.6). For each Grid site or activity type, the concrete deployments can be retrieved. Additionally, the user can use this tool to add/remove, register/unregister, and update activity types and deployment entries and automatically deploy/undeploy actual software components (services and executables). GLARE provides a special activity type called askalon.service that stores configuration and deployment information of the ASKALON middleware services (i.e., Scheduler, Execution Engine, GridARM). This activity type is the entry point to the ASKALON middleware services by providing the required discovery and invocation functionality. Together with AGWL, GLARE has the responsibility of shielding the user from low-level Grid middleware and resource details.
27.5 Scheduler The Scheduler service prepares a workflow application for execution on the Grid. It processes the workflow specification described in AGWL, converts it to an executable form, and maps it onto the available Grid resources.
27 ASKALON
459
Figure 27.6: GridARM and GLARE console snapshots. The scheduling process starts when the Execution Engine sends a scheduling request with a workflow description. The workflow consists of nodes representing activity types connected through control- and dataflow dependencies, as well as overall workflow input and output data. The Scheduler uses the Resource Manager to retrieve the current status of the Grid resources and to determine available activity deployments that correspond to the workflow activity types. In addition, the queries submitted by the Scheduler to the Resource Manager can contain constraints that must be honored, such as processor type, minimum clock rate, or operating system. The Performance Prediction service supplies predicted activity execution times and data transfer times required by the performance-driven scheduling algorithms. The scheduling process consists of three main phases: (1) refinement, performed by the workflow converter component of the Scheduler; (2) mapping, performed by the scheduling engine component; and (3) rescheduling upon important events triggered by the event generator component (see Figure 27.7).
460
Fahringer et al.
27.5.1 Workflow Refinement The workflow converter resolves all the ambiguities and refines sophisticated workflow graphs into simple directed acyclic graphs (DAGs) on which existing graph-scheduling algorithms can be applied. Initially, several assumptions are made for various workflow parameters such as conditionals (e.g., while, if, switch) or loop iteration bounds (e.g., number of parallel loop iterations) that cannot be evaluated statically before the execution begins. Afterward, a set of refinements are applied to refine the original complex but compact workflow specifications into a pure DAG-based representation. Typical transformations include branch prediction, parallel loop unrolling, and sequential loop elimination. Transformations based on correct assumptions can imply substantial performance benefits, particularly if a strong imbalance in the workflow is predicted. Incorrect assumptions require appropriate runtime adjustments such as undoing existing optimizations and rescheduling based on the new Grid information available. 27.5.2 Workflow Scheduling The scheduling engine is responsible for the actual mapping of a converted workflow onto the Grid. It is based on a modular architecture, where different DAG-based scheduling heuristics can be used interchangeably. The algorithms with varying accuracy and complexity are based on different metrics as optimization goals. We have currently incorporated three scheduling algorithms: Heterogeneous Earliest Finish Time (HEFT) [493], a genetic algorithm [365], and a myopic just-in-time algorithm acting like a resource broker, similar to the Condor matchmaking mechanism used by DAGMan (see Chapter 22). All algorithms receive as input two matrices, representing the predicted execution time of every activity instance on each computation architecture and the predicted transfer time of each data dependency link on every Grid site interconnection network, and deliver a Grid schedule. Scheduler
Enactment Engine
rescheduling request
Event Generator
scheduling request
Workflow Converter
notification event converted workflow
Performance Analysis Resource Manager
resource info HEFT Algorithm Genetic Algorithm ...
Myopic Marchmaking
Scheduling performance info Engine
scheduled workflow
Figure 27.7: The Scheduler architecture.
Performance Prediction
27 ASKALON
461
As explained in Section 27.3.2, a peculiarity of the WIEN2k workflow is that the number of parallel activities is unknown until the first activity finishes its execution and instantiates its output port kpoints. As a consequence, the workflow converter initially assumes a value of one for this output port, which produces a schedule that serializes all workflow activities onto the fastest Grid processor available. In order to graphically display the Gantt chart produced by the Scheduler (see Figure 27.8(a)), we have customized and integrated the Jumpshot tool [491] originally developed for postmortem visualization of MPI(CH) programs. 27.5.3 Workflow Rescheduling After the initial scheduling, the workflow execution is started based on the current mapping until the execution finishes or any interrupting event occurs. The event generator module uses the Monitoring Service to watch the workflow execution and detect whether any of the initial assumptions, also called execution contracts, have been violated. The execution contracts that we currently monitor include structural assumptions made by the workflow converter, external load on processors, processors no longer available, congested interconnection networks, or new Grid sites available. In case of a contract violation, the Scheduler sends a rescheduling event to the Execution Engine, which generates and returns to the Scheduler a new workflow based on the current execution status (by excluding the completed activities and including the ones that need to be reexecuted). We have formally presented this approach in detail in [365]. In the case of WIEN2k workflow, the number of parallel activities kpoints is determined after the first activity completes, which triggers a rescheduling event because of a workflow structural change. Figure 27.8(b) illustrates a sample Gantt chart upon a rescheduling event for three Grid sites and 100 parallel activities (kpoints). One can clearly see the two parallel activities LAPW1 and LAPW2, whose inner activities are distributed across all processors available. The middle sequential activity LAPW2 FERMI synchronizes the parallel activities of LAPW1 and scatters them once again for the next parallel activity, LAPW2. One can also notice that at least two parallel activities are serialized on each processor, which we will interpret as a serialization overhead in Section 27.7. Figure 27.8(c) illustrates the outcome of applying our scheduling algorithms at the rescheduling events generated by the completion of the first activity. The results show that optimization algorithms such as HEFT and genetic search produce substantially better schedules than the myopic matchmaking. HEFT is also superior to the genetic algorithm since it is a workflow-specific heuristic highly suitable for heterogeneous environments such as the Grid. The full-graph scheduling approach produces better results than the workflow partitioning strategy [116], especially in the case of strongly unbalanced workflows when one parallel iteration contains significantly more
462
Fahringer et al.
(a) Initial Gantt chart.
(b) Gantt chart after rescheduling. 2500
Scheduling Time [sec.]
700
Makespan [sec.]
2000
1500
1000
500
600 500 400 300 200 100
0
Genetic algorithm
Myopic algorithm
HEFT
HEFT, part. depth 3
Scheduling Algorithms without performance prediction
with performance prediction
(c) WIEN2k execution time.
0
Genetic algorithm
Myopic algorithm
HEFT
HEFT, part. depth 3
Scheduling Algorithms
(d) WIEN2k scheduling time.
Figure 27.8: Scheduling experimental results. work than the others. We can also notice that the genetic algorithm needs two orders of magnitude longer than the other algorithms for achieving results of the same quality; however, its ratio to the overall workflow execution time is still negligible (see Figure 27.8(d)).
27 ASKALON
463
27.6 Execution Engine The Execution Engine is the central service of the ASKALON middleware responsible for controlling the execution of a workflow application based on the Grid mapping decided by the Scheduler. The main tasks performed by the Execution Engine are to coordinate the workflow execution according to the control-flow constructs (i.e., sequence, if, switch, while, for, dag, parallel, parallelFor) and to effectively resolve the data-flow dependencies (e.g., activity arguments, I/O file staging, high-bandwidth thirdparty transfers, access to databases) specified by the application developer in AGWL. The Execution Engine provides flexible management of large collections of intermediate data generated by hundreds of parallel activities that are typical of scientific workflows. Additionally, it provides a mechanism to automatically track data dependencies between activities and performs static and runtime workflow optimizations, including archiving and compressing of multiple files to be transferred between two Grid sites or merging multiple activities to reduce the job submission and polling for termination overheads. The Execution Engine provides fault tolerance at three levels of abstraction: (1) activity level, through retry and replication; (2) control-flow level, using lightweight workflow checkpointing and migration (described later in this section); and (3) workflow level, based on alternative task workflowlevel redundancy and workflow-level checkpointing. Checkpointing and recovery are fundamental techniques for saving the application state during normal execution and restoring the saved state after a failure to reduce the amount of lost work. The Execution Engine provides two types of checkpointing mechanisms, described below. Lightweight workflow checkpointing saves the workflow state and URL references to intermediate data (together with additional semantics that characterize the physical URLs) at customizable execution time intervals. The lightweight checkpoint is very fast because it does not backup the intermediate data. The disadvantage is that the intermediate data remain stored on possibly unsecured and volatile file systems. Lightweight workflow checkpointing is typically used for immediate recovery during one workflow execution. Workflow-level checkpointing saves the workflow state and the intermediate data at the point when the checkpoint is taken. The advantage of the workflow-level checkpointing is that it saves backup copies of the intermediate data into a checkpoint database such that the execution can be restored and resumed at any time and from any Grid location. The disadvantage is that the checkpointing overhead grows significantly for large intermediate data. The Execution Engine provides a comprehensive monitoring interface through which the user can observe online various metrics that characterize the progress of the overall workflow execution. First of all, the user is provided with a dialogbox displayed in Figure 27.9(a), that enables one to customize personal monitoring metrics and charts, including histograms, line charts, or
464
Fahringer et al.
(a) Monitoring dialog box.
(b) Activity state distribution bar charts.
(c) Activity state execution histogram.
Figure 27.9: Online workflow-monitoring snapshots. online bar charts. Figure 27.9(b) displays two online bar charts that show the workflow activity states on each Grid site before and after the rescheduling phase. The left chart shows that the activity LAPW0 is in a preparation phase, while the following ones are waiting to be executed on the same site due to control-flow dependencies and assuming one k-point per LAPW1 and LAPW2 parallel section (see Section 27.5). The right chart of Figure 27.9(b) displays an execution snapshot after rescheduling the workflow on four Grid sites, where each bar corresponds to one Grid site and displays the number of activities in each state scheduled on that site. The histogram in Figure 27.9(c) traces at regular customizable time instances the number of workflow activities in each possible state (i.e., waiting, preparing, submitted, active, checkpointing, completed, failed, data transfer).
27 ASKALON
465
27.7 Overhead Analysis One of the main concerns when executing scientific workflows on the Grid is achieving faster completion times proportional to the performance or quality of the Grid resources available. The distributed execution of workflow applications on the Grid, however, is prone to large overhead that must be understood in order to improve the overall speedup and efficiency. As part of a service that analyzes nonfunctional parameters for Grid applications, we have developed a formal overhead analysis model that defines the execution time of a Grid workflow application as the sum between a theoretical ideal time Tideal and a set of temporal overheads that originate from various sources: T = Tideal + T otal Overhead. Describing the sources of the temporal overheads, classifying them in a finegrained hierarchy, and measuring them in a systematic manner is the scope of our overhead analysis effort. We model a workflow application as a directed graph (Nodes, Edges), where Nodes = {N1 , . . . , Nn } is the set of workflow nodes and Edges =
n−1 {(Nj , Nk ) | j > k} is the set of control-flow dependencies. i=1 (Ni , Ni+1 ) The edges in the latter union set model backward dependencies that implement recursive loops. A node N can have any of the following types: (1) computational activity (or remote job submission), CA; (2) data transfer activity (or file transfer between Grid sites), DT; (3) parallel section, denoted as NP ar = (Np1 , . . . Npm ); and (4) subworkflow, denoted as (Nodesi , Edgesi ), recursively defined according to this definition. For the moment, we ignore in our analysis the arbitrary DAG-based workflow structures, which are nevertheless supported by AGWL. The ideal execution time of a sequential computational activity, CA, ideal denoted as TCA , is the minimum of the wall-clock execution times on all idle processor types available on the Grid. The ideal execution time of a data ideal transfer activity is zero since we consider it an overhead: TDT = 0. The ideal execution time of a parallel section NP ar is the fastest ideal � ideal � execution time of a single computational activity: TNideal = min TCA . The ideal P ar ∀CA∈NP ar
execution time of a workflow (Nodes, Edges) is the sum of the ideal execution times of all (computational and parallel section) activities N ∈ Nodes: Tideal = ∀N∈Nodes TNideal . We propose a new hierarchical classification of performance overhead for Grid workflow applications, which we currently base on four main categories: middleware, loss of parallelism, data transfer, and activity overheads (see Figure 27.10). Additionally, we consider the difference between the total overhead and the sum of the measured identified (nonoverlapping) overheads as unidentified overhead , which has to be minimized by an effective performance analysis tool. A high unidentified overhead value indicates that
466
Fahringer et al.
temporal overheads unidentified overhead middleware resource brokerage performance prediction scheduling optimization algorithm rescheduling execution management control of parallelism fork construct barrier job preparation archive / compression of data extract / decompression job management submission decision policy submission latency completion polling queue queue waiting queue residency restart job failure job cancel service latency resource broker performance prediction scheduler execution management security loss of parallelism load imbalance serialisation replicated job data transfer file staging stage in stage out access to database third party data transfer input from user data transfer imbalance activity parallel overheads external load
Figure 27.10: Workflow overhead classification.
27 ASKALON
467
the analysis is unsatisfactory and further effort is required to spot new sources of overhead in the workflow execution. Normalized metrics are valuable means for understanding the importance of the temporal overheads with respect to the entire workflow execution. We define the value of an overhead To normalized against the workflow execution as the overhead severity, which quantifies the importance of the performance overhead for the specific workflow execution: SV = TTo . In addition, we define the workflow speedup as the ratio between the M fastest single-site execution time (of the entire workflow) Tseq and the actual execution time of the workflow on the Grid T : � M� min Tseq ∀M∈Grid S= . T Furthermore, we define the workflow efficiency as the speedup normalized against the number of the Grid sites used, where each Grid site M is weighted with the speedup of the corresponding single site execution time: � �� M Tseq min S ∀M� ∈Grid E=
, where: SM = . M Tseq M∈Grid SM The efficiency formula therefore becomes: T −1 . M −1 ∀M∈Grid (Tseq )
E=
The fastest Grid site has a weight of one, whereas the slowest Grid site has the smallest weight (i.e., closest to zero). The rationale behind the speedup formula is that only by normalizing against the fastest parallel computer available can the scientists get a true indication of what they can gain by extending their focus to Grid computing. Beyond a detailed overhead analysis, our experiments try to answer the following question: Assume that we execute and measure the execution time of a workflow on the fastest Grid site available and thereafter incrementally add the next fastest site to the Grid execution environment. Does the execution time of a specific application decrease considerably compared with the singlesite execution? If we can demonstrate reasonable speedups and understand the nature of the most relevant overheads, the application groups are likely to become interested in Grid computing and give us additional support in porting their applications as Grid workflows. We proceeded by executing the workflow application on every individual Grid site and ranked the sites according to the execution times obtained (see Table 27.1). In our experiments, the SGI Altix machines delivered the fastest execution times, followed by the 3 GHz Pentium 4 compute cluster from Vienna (Gescher) and the Pentium 4 workstation networks in Innsbruck
468
Fahringer et al.
4,5
Time [seconds]
9000 8000
4
7000
3,5 3
6000
2,5
5000
2
4000 1,5
3000 1
2000 0,5
1000
0 altix1.jku schafberg altix1.uibk gescher
0 altix1 / schafberg
gescher
Grid site
speedup
(a) Single site comparison.
arch20
arch21
efficiency
90
Overhead severity [percentage]
90% 80% 70% 60% 50% 40% 30% 20% 10%
ch
21
20
60 50 40 30 20 10 0
(c) Total overhead severity. 7000
unidentified * external load * data transfer * load imbalance * job submission job preparation * scheduler prediction resource broker serialisation ideal time
4000 3000 2000 1000
1
0
ar ch 2
(d) Overhead severity. external load * 8%
5000
9
Grid site configuration
total overhead
6000
ar ch 2
id 1 ag r
al tix 1. jku sc ha fb er g al tix 1. ui bk ge sc he r
Grid site configuration ideal time
serialisation * resource broker prediction scheduler job preparation * job submission load imbalance * data transfer * external load * unidentified
70
ar
ar
ar
ch
ch
19
1
r
k
he
ag rid
ge sc
g
ui b
er
1. tix al
ha fb sc
al
tix
1.
jku
0%
80
ar ch 1
Percentage
arch19
(b) Speedup and efficiency.
100%
Time [seconds]
agrid1
Grid site configuration
agrid1 / arch
unidentified * 2%
data transfer * 13%
resource broker 0%
serialisation 0% prediction 2% load imbalance * 28%
0
schedule 0%
1 ar ch 2
ar ch 2
9 ar ch 1
id 1 ag r
ge sc he r
al tix 1. jku sc ha fb er g al tix 1. ui bk
0
ideal time 28%
Grid site configuration
(e) 252 k-point executions.
job preparation * 18% job submission 1%
(f) Overhead breakdown for eight sites.
Figure 27.11: WIEN2k overhead analysis results. (see Figure 27.11(a)). The ideal execution time of the SGI Altix machines and Gescher are almost equal, but Gescher has a significantly higher PBS queuing time (over one minute), which makes it only fourth in the overall Grid site
27 ASKALON
469
ranking. After establishing a ranking of the Grid sites, we proceeded with the repeated execution of the workflow on multiple Grid sites by incrementally adding the next fastest site to the Grid environment. The speedup curve displayed in Figure 27.11(b) shows that the Grid execution improves up to seven sites. The improvement comes from the parallel execution of the computationally expensive k-points on multiple Grid sites, which significantly lowers the execution time of the parallel sections. The efficiency curve gently decreases in both cases and remains above 0.5, which we find promising considering the modest problem sizes executed and the rather high overhead experienced. Figure 27.11(e) displays the contribution of the ideal execution time and the most significant overheads to the real execution time. We have marked with asterisks the most severe overheads, which the reader can follow in a top–bottom order on the individual bars. The severity of the total overhead constantly decreases with the Grid size from over 80% on one site to 45% on eight Grid sites (see Figure 27.11(c)). Figure 27.11(d) summarizes in one graph the overhead severities in every Grid site configuration, which indicates the importance of each overhead and guides the application and middleware developers to the parts on which to concentrate the next tuning efforts. The most important overhead is the serialization overhead due to the limited Grid size, which cannot accommodate the entire number of parallel activities that have to be serialized on some of the processors (typically through a job queuing system such as PBS). This overhead accounts for over 90% of the total overhead on a single site, but decreases to zero on eight sites. This overhead indicates the performance that could be gained by acquiring or adding new processors to the Grid environment. If extending the Grid size is irrelevant to the user, one could consider this overhead as part of the ideal execution time. The second severe overhead is the loss of parallelism due to load imbalance, which fluctuates depending on the number of k-points, processors available, and the size of the serialized block of each processor. In our experiments, it steadily grows with the Grid size because of the slower processors added to the Grid environment (see Figure 27.11(f)). The next important overhead is the job preparation overhead for compression/decompression of a large number of files into/from an archive with the purpose of reducing the data transfer overhead. The WIEN2k activities have a large number of data dependencies (i.e., files), which increase proportionally with the number of parallel k-points (about three times). Moreover, the size of the data that need to be transferred between activities increases with the number of k-points and Grid sites (about 500 MB for 100 k-points). Therefore, it becomes crucial to archive and compress the output files before transferring them over the network to the next activity. This overhead remains relatively constant for the first four Grid site configurations. The Pentium 4 workstation networks (which are part of a large, intensively
470
Fahringer et al.
used student workstation network), however, exhibit unexpectedly large access latencies to the shared AFS file system upon decompressing file archives of about 50 MB. This overhead grows linearly with the number of archives used (i.e., n − 1 tar archives for n Grid sites), which significantly slows down the execution. We managed to keep the data transfer overhead relatively constant (about 140 seconds) by using parallel streams over the GridFTP protocol to transfer the archives between sites. Additionally, we exhibit a constant imbalance on parallel data transfers of between 50 and 60 seconds per workflow execution. The external load overhead is significant for one and two Grid site executions and decreases with the number of Grid sites. Its severity slightly increases with the Grid size; however, its value decreases and is proportional with the number of activities that execute concurrently on the SGI Altix parallel machines (which is obviously decreasing with the Grid size). The overhead is not simply due to external factors but is also caused by the nature of the NUMA SMP architecture concurrently executing 14 parallel activities. This overhead consists of remote memory accesses and contention on the shared bus, operating system parallel process management, and cache coherency protocols. For compute clusters and workstation networks, the external load is (almost) zero due to the dedicated access to the single processors via the PBS queuing system. The overheads of the ASKALON middleware services, comprising the Resource Broker, Scheduler, and Performance Prediction, are constant and count for less than 1% each of the entire execution time.
27.8 Conclusions In contrast to many existing systems, ASKALON supports workflow composition and modeling using the UML standard and provides an XMLbased programming interface that shields the application developer from lowlevel middleware technologies. A separate Resource Manager, which covers both physical resources and workflow activities, renders the boundaries of resource brokerage, virtual organization-wide authorization, and advanced reservation, and provides mechanisms for Grid resource discovery, selection, and allocation along with resource requester and provider interaction. Our Scheduler supports HEFT and genetic search as optimization algorithms which perform significantly better than a pure resource broker, in particular in the case of unbalanced workflows. The Scheduler benefits significantly from a Performance Prediction service that provides expected execution times based on a training phase and statistical methods. The Execution Engine efficiently handles large collections of data dependencies produced by hundreds of parallel activities specific to scientific workflows. We have demonstrated significant performance gains through two checkpointing methods for saving
27 ASKALON
471
and restoring the execution of Grid workflows upon engine and application failures. We have demonstrated the integrated use of the ASKALON services for real-world scientific workflows executed in the Austrian Grid infrastructure. Our future work will focus on further optimization of workflow executions to increase their scalability on the Grid, scheduling based on QoS parameters to be negotiated between the Scheduler and the Resource Manager, and automatic bottleneck detection and steering based on online performance analysis.
27.9 Acknowledgments This research was partially supported by the Austrian Science Fund as part of the SFBF1104 Aurora project and the European Union as part of the IST2002-511385 K-Wf Grid and IST-034601 Edutain@Grid projects.