THE RAFFLES BULLETIN OF ZOOLOGY 2007 THE RAFFLES BULLETIN OF ZOOLOGY 2007 Supplement No. 14: 273-279 Date of Publication: 31 Jan.2007 © Academia Sinica and National University of Singapore
AN UNDERWATER CAMERA SYSTEM FOR REAL-TIME CORAL REEF FISH MONITORING Rong-Quen Jan Research Center for Biodiversity, Academia Sinica, Taipei, Taiwan 115 Email:
[email protected]
Yi-Ta Shao Institute of Cellular and Organismic Biology, Academia Sinica, Taipei, Taiwan 115
Fang-Pang Lin National Center for High-performance Computing, Hsinchu, Taiwan 300
Tung-Yung Fan National Museum of Marine Biology and Aquarium, Pingtung, Taiwan 944
Yueh-Yuan Tu and Hsien-Shiow Tsai Department of Industrial Safety and Environmental Protection, Taiwan Power Company, Taipei, Taiwan 100
Kwang-Tsao Shao Research Center for Biodiversity, Academia Sinica, Taipei, Taiwan 115 Email:
[email protected] (Corresponding Author)
ABSTRACT. – With the recent progress in information communication technology, an unmanned underwater video recording system was installed for long-term monitoring of coral reef organisms, including fishes. This underwater monitoring system was established in a protected embayment near the water inlet of the Third Nuclear Power Plant in Southern Taiwan (21°57'N 120°45'E). A set of nine cameras supplemented with illuminating lights was installed ~ 3 - 6 m deep on existing coral reefs. All video images taken by the underwater cameras were digitized and transmitted wirelessly to receivers in a nearby control room. The data was distributed some 300 km Northward via asymmetrical digital subscribed lines (ADSL) to the National Center for High-performance Computing (NCHC) for storage. The coral reef ecosystem is presently being continuously monitored. The 24 hour image files mirror the diurnal variations in the fishes’ activities. Peaks of species occurrence were observed in the early morning (i.e., 0740 hours), one hour before noon and in the late afternoon (~ 1600 - 1620 hours). By contrast, species occurrence was lower in the period between 1200 and 1500 hours. The real-time underwater images taken from different habitats were relayed by network links to distant users at ECO-GRID @ TW (http://sensor6.nchc.org.tw/). The network has been in operation since July 2004. With the introduction of this system, people are now able to watch real-time images of the amazing fishes on coral reefs via Internet broadcasting. KEY WORDS. – Coral reef, fish assemblage, long-term monitoring, marine protected area.
INTRODUCTION Coral reef environments are ever-changing, long-term data sets are often required to delineate the complex processes of ecological succession. Collection of long-term data mainly relies on well-designed monitoring schemes (Jan et al., 1994; Carleton & Done, 1995). A successful monitoring program of a fish species or a fish community normally involves the use of a wide spectrum of appropriate techniques (Sanderson & Solonsky, 1986; Matlock et al., 1991). Dating back to 1954,
Brock’s team surveyed fishes along 17 transect lines at nine different localities in Hawaii (Brock, 1954), equipped with scuba diving equipment. Ever since then, visual surveys by scuba diving have been widely adopted as a means of collecting ichthyological data. Currently, visual surveys are also supplemented with photography and video recording. This underwater visual census technique succeeds in studying assemblages and densities of fish without having to capture or collect them (Brock, 1982; Connell et al., 1998). However, data collection is often affected by weather and restrained by
273
Jan et al.: System for real-time fish monitoring observation times. There are also other drawbacks. For example, timid fish may hide themselves in crevices or remain aloof from divers. Also, data accuracy is subjected to changes in accordance with the experience of the investigators (Sale & Sharp, 1983; Benedetti-Cecchi et al., 1996; Edgar et al., 2004). With the recent progress in information communication technology, we were able to introduce an unmanned underwater video recording system for the long-term monitoring of coral reef organisms, including fishes. This system is currently installed on coral reefs on the Southernmost coast of Taiwan. Unlike the unmanned video recording used to estimate fish densities in trawl nets of fishing boats (Butherz, 1982; Cappo et al., 2004), these video cameras take images 24 hours a day. These continuous image data will help in elucidating the ecological processes which primarily involve slow processes, rare events (episodic phenomena) and high temporal variability at the study site (Jan & Chang 1991; Jan et a1., 2001; Hsiao et al., 2003). This program was initiated by marine ecologists and has been closely developed with the Taiwan Eco-grid system (Porter et al., 2005). Presently, real-time video images are accessible online via Internet broadcasting. Worldwide Eco-grid researchers and end users can now perform comparative studies between sites and attempt to understand the dynamics and health of coral reefs. In addition, such a monitoring scheme may help enhance the public’s awareness of marine conservation. It also facilitates the Long-Term Ecological Research (LTER)
on the Kenting coral reef ecosystems by supplying continuous image data of one of the study sites (Shao & Jan, 2002). The instruments were divided into three units, each monitoring a different type of habitat. Each unit had three underwater cameras, three white lights and three infrared lights. Many technical difficulties surfaced while building this system. In this paper we present an overview of the system and describe how these difficulties were dealt with. This realtime online underwater video system can be a versatile tool for many purposes and we hope that its application may stimulate new ideas for coral reef monitoring.
THE STUDY SITE The monitoring system was installed in an embayment encompassing the water inlet of the Third Nuclear Power Plant of Taiwan Power Company (Taipower) (21°57'N 120°45'E). This embayment is adjacent to Nanwan Bay, part of the marine environment managed by the Kenting National Park Authority. From years of controlled access, the embayment has been protected from impacts arising from fisheries and recreational activities. In addition, natural disturbances from strong waves and typhoons were reduced by the surrounding breakwater. This embayment has functioned as a marine protected area (MPA) for coral reefs and it was also chosen as a study site for LTER programs (Shao & Jan, 2002).
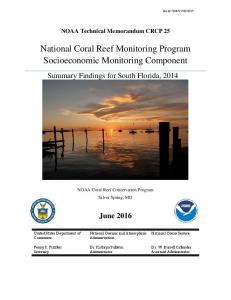
Fig. 1. Conceptual diagram showing three sites of camera installation (A, B and C) in the embayment and the bidirectional pathway of data transmission in this monitoring system. ADSL = asymmetrical digital subscriber line.
274
THE RAFFLES BULLETIN OF ZOOLOGY 2007 THE MONITORING SYSTEM Concepts and design. – The system was designed to incorporate data capture and transmission to allow remote monitoring. These two components were linked together and integrated as shown in the conceptual diagram (Fig. 1). Data capture was accomplished using video cameras with a 22 : 1 zoom lens and a high-sensitivity charge-coupled device (CCD). The composite camera attempted to retain its lowlight-level sensitivity while taking high-resolution image frames (470 TVL). The housing of the camera is grenadeshaped and was hand-made from stainless steel with a registered waterproof depth of 300 m. The underwater cameras were connected by coaxial cables (of 50 to 80 m lengths) to network video servers kept in electro-mechanical control boxes on shore. There, the video images taken by the
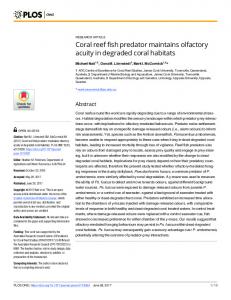
Fig. 2. Graph showing design of the underwater camera platform.
cameras were transformed into high-quality digital images for wireless transmission (the use of wireless transmission assures the portability and flexibility of the underwater monitoring system in future applications). Data was received by a receiver unit installed in a control room located on the other side of the embayment. Through the control room, the data was then distributed via asymmetrical digital subscribed lines (ADSL) to the National Center for High-performance Computing (NCHC), located 300 km North in Hsinchu, where the image data was stored and analyzed to fit in with the Ecogrid infrastructure. Underwater camera platform. – The underwater camera was anchored to the sea bed to optimize image-taking. The cameras and lights were mounted on a platform (Figs. 2 & 3) whose rectangular base (~ 1.5 - 2.0 m2) was defined by four 1.5 m long stainless steel pipes (33.5 mm in diameter). Twothirds of each pipe was rammed into the seabed by power hammers operated by divers. To create the platform, each pipe was inter-locked by angled steel and stainless steel bolts. The platform was provided with additional support against currents by two extra pipes set at an angle of 45° from the current front to the platform base. Power supply and cables. – A secure power supply was devised for the monitoring system. The incoming 110 V AC power was converted into ~ 5 - 25 V DC for the use by the cameras and lights. Coaxial cables enveloped in silicone layers were used for both power and data transmission. At each site, all cables were bundled and fixed to avoid intermingling. The parts of the cables that were submerged
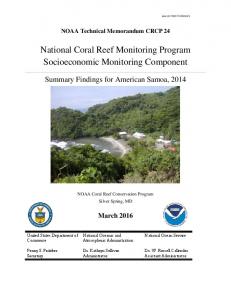
Fig. 3. Underwater view of cameras and torchlights installed at site A. C = camera; T = torchlight; I = infrared light.
275
Jan et al.: System for real-time fish monitoring in the water were further encased in polyglass hoses to protect them from fouling or mechanical damage caused by the biting of herbivorous fishes. No underwater plugs were used in this system.
lights and platform have to be cleaned every five days to maintain normal function. At each site, a diver takes approximately 30 minutes to perform a regular gear check and cleaning duties.
Artificial illumination. – The underwater system was equipped with remote-controllable illumination for night-time monitoring. White light produced by the 45 W high-color temperature lamps (H3 standard) was used for all-range illumination, while infrared light was used for short-range (preferably less than 30 cm) overnight observations (e.g., Holbrook & Schmitt, 1997). To avoid disturbing the natural daily light cycle or causing injury to photosensitive organisms, lights were turned on only when scheduled.
Real-time images online. – The system was installed in May 2004 and was functioning stably by July 2004. Currently, the real-time images are accessible at ECO-GRID @ TW (http://sensor6.nchc.org.tw/). Website visitors may choose to watch video streams from sites A to C with the option of six streams on a screen, or nine streams on a screen (Fig. 4). There is also a short video edited from continuous image data taken at site B on 24 May 2004. The video demonstrates how a piece of brown algae (Sargassum sp.) was completely consumed by a group of Naso unicornis and Siganus fuscescens. The NCHC also provides data files to Eco-grid researchers for academic use.
Maintenance. – Corrosion of the metal parts (all made of stainless steel) were evident after three months, but was not serious. Fouling organisms, including algae and barnacles grew more rapidly than expected on the camera housings and platforms, causing them to have increased drag in the current. Moreover, a three-spot damselfish, Dascyllus trimaculatus, chose to spawn on the window glass of one of the housings, interfering with the camera’s auto-focusing mechanism. As there seemed to be no preventive measures against biofouling, the entire monitoring system including cameras, torch
Diurnal variations of fish activities. – The 24 hour image files were used to mirror diurnal variations in fish activities at site A. The site was located in the inner corner of the embayment (Fig. 1) on a reef outcropping composed of limestone with a base of 4.2 × 3.8 m. It was among the few reefs located outside the surge zone. The water depth from the top of the lowest outcrop of the reef is 3 m. The reef is
Fig. 4. Real-time images from nine camera sets (sites A to C) viewed simultaneously via Microsoft® Internet Explorer in a Chinese version of Windows®.
276
THE RAFFLES BULLETIN OF ZOOLOGY 2007 characterized by a platy formation of table coral, Acropora hyacinthus. Such a reef structure provides shelter for many nocturnal fishes in the daytime. Near the bottom of this limestone reef, a small clump of lavender coral, A. aspera, occurred with groups of pomacentrids and butterflyfishes. The shallow water allowed efficient daylight penetration. Three camera sets were placed on a platform in front of the tabular reefs (Fig. 5). These cameras were in fixed positions (i.e., enabling zoom but not panning or tilting). Cameras A and B were set to cover an angle of 120° to obtain a panoramic view of the tabular reefs, while Camera C was set to face a smaller reef several metres away to the right side of the tabular reefs. Video files obtained on 22 October 2004 were used for analysis. Image streams taken in the period between 0600 and 1740 hours were divided into thirty-five 20 minute intervals for examination. For each camera set, fish species appearing in the first five minutes of each time interval were visually identified. Results showed that Camera A captured 45 fish species over the entire day, Camera B captured 47 species and Camera C recorded 43 species (Fig. 6). In total, 65 fish species were observed at this site. Among these, 32 species (49%) appeared before 0700 hours. The number of species reached 55 (85%) at noon. Another six species, including three nocturnal species, were added to the list after 1620 hours. The total number of species observed in each time interval was in the range of seven to 17 (Fig. 7). Three peaks occurred: in the early morning (i.e., 0740 hours), one hour before noon and in the late afternoon (~ 1600 - 1620 hours). By contrast, low numbers (fewer than 12 species) occurred in the period during 1200 to 1500 hours.
completely missing from the list and the mid-water Meiacanthus grammistes was the only entry of the Blenniidae. The efficiencies differed between each camera set. In each time interval, Camera A on average covered 80% of the fish fauna, Camera B covered 78% and Camera C covered 60%. Among these cameras, only Cameras A and B, which covered the same habitat, showed a significant correlation in species number (r = 0.62, p < 0.05).
PROSPECTS This real-time underwater visual monitoring system evolved from similar systems used on land. Many of the virtues inherent for on-land systems (Porter et al., 2005) also apply to ichthyological studies, including the following: 1) Data collection is unobtrusive. Therefore, it is useful in fish behavioral studies where the appearance of divers may change the behavior of the system under study; 2) continuous monitoring may reveal new insights into temporal variations of a fish assemblage and also help identify the factors accounting for such variations. For example, diurnal variations of fish activities at site A showed how the species composition could be affected by the time when the observation is taken; 3) the real-time system provides rapid access to data, hence allows for rapid experimental manipulation when required, or concurrent analysis between
Fishes observed on more than half of the occasions include Dascyllus reticulatus (present in all 35 time intervals), Dascyllus aruanus (35), Acanthurus nigrofuscus (25), Amphiprion clarkii (24), Canthigaster valentini (21), Chaetodon trifascialis (20), Scarus sp. (19), Balistoides viridescens (18), Centropyge tibicen (16) and Thalasomma lutescens (16). These fishes also dominated the afternoon assemblages. Since the cameras were set to monitor mobile species, sedentary fishes or those with small bodies tended to be overlooked. Thus, members of the Gobiidae were
Fig. 5. Sketch graph showing the topography of site A and the location where the cameras were installed. Circles = existing underwater landmark; D = depth in metres.
Fig. 6. Bar charts showing numbers of newly observed fish species in the first five minutes of each 20-minutes interval during 0600 1740 hours. Cams A to C = Camera A to C. Combined = data combined from Cameras A to C.
277
Jan et al.: System for real-time fish monitoring sites and 4) the system can be controlled remotely. The bidirectional data flow facilitates flexibility in the type of data collected. For example, with the lens zoom function, the target can be switched between mobile species and sedentary fishes when required. However, the system also has its limits as the cameras are in fixed positions. When they are used to collect assemblage data, biases inherent with the mobility of different species are difficult to systematize. Additionally, as with other video studies, the accuracy of the density and size estimates for different fish species is questionable (Edgar et al., 2004). This monitoring system not only brings real-time images to end users, but it also stores them. The long-term image dataset can be integrated with information obtained from related studies (mainly the LTER project) on hydraulics, water quality and biology to facilitate comparative analyses between impacts caused by anthropogenic factors (e.g., water pollution and sedimentation) and natural factors (e.g., typhoons and El Niño) on the community and ecosystems. Moreover, coral reproduction and coral bleaching in the MPA were monitored, either due to public concerns (Fan et al., 2002) or as an early warning of environmental changes. It can also be used as a tool to study the behavior of the sea anemone, Condylactis sp., whose recent outbreak in Nanwan Bay has changed the local community (Chen & Dai, 2004). Meanwhile, the monitoring system has recently withstood two typhoons, Haitang (~ 16 - 20 July 2005) and Matsa (~ 3 - 6 August 2005), providing valuable image data for before-and-after typhoon comparisons.
While this monitoring system offers a new sampling tool for ecologists, it also opens a window for people to watch the fascinating phenomena on coral reefs. Marine museums and aquariums such as the Monterey Bay (USA), Vancouver (USA) and Asamushi (Japan) Aquariums also provide realtime streams on their web sites. Apparently, all these programs have an immediate effect of enhancing public awareness of marine organisms, thereby building support for the conservation of marine ecosystems. In the future, we hope the system will be further equipped with scientific sensors to collect non-biological environmental data in parallel, including water temperature, salinity, conductivity, turbidity, pH, dissolved oxygen and light intensity, thereby providing a more powerful tool for scientists. Overall, we hope the application of this underwater monitoring system will stimulate new ideas for coral reef monitoring, thereby improving our knowledge of the management of coral reefs.
ACKNOWLEDGEMENTS We thank the Third Nuclear Power Plant of Taipower for logistical support. Y. H. Liu, K. Y. Huang, Y. T. Wang, P. W. Chen and C. Wei for their help with the fieldwork and two anonymous reviewers for commenting on the manuscript. This research was funded by grants (TPC-73-92-07309) from Taiwan Power Company and (NSC92-2621-B-001-003 and NSC93-2621-B-001-005) from the National Science Council of the Republic of China. Microsoft, the Internet Explorer browser and the Windows OS are registered trademarks of Microsoft Corporation.
LITERATURE CITED Benedetti-Cecchi, L., L. Airoldi, M. Abbiati & F. Cinelli, 1996. Estimating the abundance of benthic invertebrates: a comparison of procedures and variability between observers. Marine Ecology Progress Series, 138: 93-101. Brock, R. E., 1982. A critique of the visual census method for assessing coral reef fish populations. Bulletin of Marine Science, 32: 269-276. Brock, V., 1954. A preliminary report on a method of estimating reef fish populations. Journal of Wildlife Management, 18: 297308. Butherz, E. L., 1982. Reef fish assessment-snapper/grouper stocks in the western North Atlantic - south of Cape Hatteras, NC. In: Huntsman, G. R., W. R. Nicholson & W. W. Fox, Jr. (eds.), The biological bases for reef fishery management. National Oceanic and Atmospheric Administration Technical Memorandum NMFS-SEFC-80, NC, Washington, DC. Pp. 124141. Cappo, M., P. Speare & G. De’ath, 2004. Comparison of baited remote underwater video stations (BRUVS) and prawn (shrimp) trawls for assessments of fish biodiversity in inter-reefal areas of the Great Barrier Reef Marine Park. Journal of Experimental Marine Biology and Ecology, 302: 123-152.
Fig. 7. Number of fish species observed in the first five minutes of each 20-minutes interval during 0600 - 1740 hours. Cams A to C = Cameras A to C. Combined = data combined from Cameras A to C.
278
Carleton, J. H. & T. J. Done, 1995. Quantitative video sampling of coral reef benthos: large-scale application. Coral Reefs, 14: 3546.
THE RAFFLES BULLETIN OF ZOOLOGY 2007 Chen, C. A. & C. F. Dai, 2004. Local phase shift from Acroporadominant to Condylactis-dominant community in the Tiao-Shi Reef, Kenting National Park, southern Taiwan. Coral Reefs, 23(4): 508.
Jan, R. Q., C. F. Dai & K. H. Chang, 1994. Monitoring of hard substrate communities. In: Kramer, K.J.M. (ed.), Biomonitoring of coastal waters and estuaries. CRC Press, Boca Raton. Pp. 285-310.
Connell, S. D., M. A. Samoilys, M. P. Lincoln Smith & J. Leqata, 1998. Comparisons of abundance of coral-reef fish: catch and effort surveys vs. visual census. Australian Journal of Ecology, 23: 579-586.
Jan, R. Q., J. P. Chen, C. Y. Lin & K. T. Shao, 2001. Long-term monitoring of the coral reef fish communities around a nuclear power plant at southern Taiwan. Aquatic Ecology, 35: 233-243.
Edgar, G. J., N. S. Barrett & A. J. Morton, 2004. Biases associated with the use of underwater visual census techniques to quantify the density and size-structure of fish populations. Journal of Experimental Marine Biology and Ecology, 308: 269-290. Fan, T. Y., J. J. Li, S. X. Ie & L. S. Fang, 2002. Lunar periodicity of larval release by pocilloporid corals in southern Taiwan. Zoological Studies, 41: 288-294. Holbrook, S. J. & R. J. Schmitt, 1997. Settlement patterns and process in a coral reef damselfish: in situ nocturnal observations using infrared video. Proceedings of the 8th International Coral Reef Symposium, 2: 1143-1148. Hsiao, C. Y., T. C. Chen, C. F. Dai & R. Q. Jan, 2003. Colonization of juveniles of the damselfish Dascyllus reticulatus (Richardson) on the southern coast of Taiwan. Zoological Studies, 42: 551555. Jan, R. Q. & K. H. Chang, 1991. A monitoring study of the succession on marine sessile macro-organisms five years before and after the operation of a nuclear power plant. In: Jeffrey, D. W. & B. Madden (eds.), Bioindicators and Environmental Management. Academic Press, London. Pp. 21-35.
Matlock, G. C., W. R. Nelson, R. S. Jones, A. W. Green, T. J. Cody, E. Gutherz & J. Doerzbacher, 1991. Comparison of two techniques for estimating tilefish, yellow-edge grouper, and other deepwater fish populations. Fisheries Bulletin, 89: 91-99. Porter, J., P. Aazberger, H. W. Braun, P. Bryant, S. Gage, T. Hansen, P. Hanson, C. C. Lin, F. P. Lin, T. Kratz, W. Michener, D. Shapiro & T. Willams, 2005. Wireless sensor networks for ecology. BioScience, 55: 561-571. Sale, P. F. & B. J. Sharp, 1983. Correction for bias in visual transect censuses of coral reef fishes. Coral Reefs, 2: 37-42. Sanderson, S. L. & A. C. Solonsky, 1986. Comparison of a rapid visual and a strip transect technique for censusing reef fish assemblages. Bulletin of Marine Science, 39: 119-129. Shao, K. T. & R. Q. Jan, 2002. Current status and LTER project of the coral reef ecosystem in Kenting National Park. Proceedings of IUCN/WCPA-EA-4 Taipei Conference. Taiwan Organizing Committee for the Fourth Conference of the Protected Areas in East Asia, Taipei, pp. 351-359. World Wide Web: http://sensor6.nchc.org.tw/
279