Z. Yi, C. Heng, W.K. Wong / Journal of Risk and Financial Management 2(2009) 38-74
China’s Stock Market Integration with a Leading Power and a Close Neighbor
Zheng Yi a , Chen Heng b , Wing-Keung Wong c a
School of Finance Southwestern, University of Finance and Economics b
c
Fortune SGAM Fund Management Company
Department of Economics, Hong Kong Baptist University
ABSTRACT Current integration and co-movement among international stock markets has been boosted by increased globalization of the world economy, and profit-chasing capital surfing across borders. With a reputation as the fastest growing economy in the world, China’s stock market has continued gaining momentum during recent years and incurred growing attention from academicians, as well as practitioners. Taking into account economic and geographical considerations, the US and Hong Kong are considerably the most comparable stock markets to China. The usual vector error correction model (VECM) could overlook the long memory feature of cointegration residual series, which can in turn exert bias on the resulting inferences. To overcome its limitations, we employ a fractionally integrated VECM (FIVECM) in this paper to investigate the long-term cointegration relations binding China’s stock market to the aforementioned stock markets. In addition, by augmenting the FIVECM with multivariate GARCH model, the return transmission and volatility spillover between market return series were revealed simultaneously. Our empirical results show that China’s stock market is fractionally cointegrated with the two markets, and it appears that China’s stock market has stronger ties with its neighboring Hong Kong market than with the world superpower, the US market. KEYWORDS:
Stock markets, Cointegration, FIVECM and MGARCH
ACKNOWLEDGMENTS: This paper is funded by a research grant at Southwestern University of Finance and Economics ( 211 Project, Phase III ).
Correspondence author: Wing-Keung Wong, Department of Economics, Hong Kong Baptist University, Kowloon Tong, Hong Kong. Tel: (852)-3411-7542, Fax: (852)-3411-5580, Email:
[email protected]
38
Z. Yi, C. Heng, W.K. Wong / Journal of Risk and Financial Management 2(2009) 38-74
1. INTRODUCTION
Globalization has been gaining momentum and has become irreversible regardless of sporadic oppositional influences. This phenomenon is a direct result of increased interaction between world economies, including both developing and developed countries. The stock market is one of the forefront players in this unprecedented spectacle in history, whilst the examination of integration within the world stock markets is one of the most important issues in finance.
A large number of studies have been examining integration among the world’s stock markets. In an era of increasing globalization where there is a substantial capital flows across countries, integration among world stock markets has important practical relevance for both investors and financial policy makers. An important determinant of interdependence among stock markets across countries is economic integration in the form of trade and investment flows. The dividend discount model suggests that the current share price equals the present value of future cash flows, which depends on the earnings growth of a company. On the other hand, earnings growth also depends on the macroeconomic conditions of the domestic market as well as the macroeconomic conditions in countries with which a country trades and sources its investment flows (Shamsuddin and Kim, 2003). Thus, interdependence in stock markets may also reflect geographical proximity among markets with economically close ties. They are expected to exhibit high levels of market linkages because of the presence of similar investor groups and cross-listed companies.
However, greater financial integration implies reduced opportunities for international portfolio diversification. Co-movements among markets can result in contagious effects where in an effort to form a complete information set, investors incorporate price changes in other markets into their trading decisions, inferring that shocks and errors in one market can be transmitted to other markets. Such contagious effects have been 39
Z. Yi, C. Heng, W.K. Wong / Journal of Risk and Financial Management 2(2009) 38-74 exacerbated by major events which have affected world stock indices in recent decades such as the 1987 stock market crash, Asian financial crisis in 1997, and the recent world financial crisis in 2008. Correspondingly, individual countries’ monetary and fiscal schemes are being designed to tackle possible external infections.
This paper focuses on examining relations between China’s stock market and world markets partially represented by the US and Hong Kong markets. We attempt to detect the relations between China and these two particular markets because these two markets are believed to have stronger relations with China than other markets in the world. The US market is the leading and most influential market in the world, it is also the largest trading partner of and the biggest foreign direct investment source for China. Hong Kong, on the other hand, is China’s closest market due to economic, political, and geographical factors. Interdependence in stock markets may also reflect geographical proximity between markets, like China and Hong Kong, whom have economically close ties which are expected to exhibit high levels of market linkages because of the presence of similar investor groups and cross-listed companies. Conclusions from the interactions of China’s stock market with the US and Hong Kong markets may depict the main topology of China’s market in the world, the former shows the hierarchical importance of the world’s superpower, and the latter exhibits a close neighbor in the evolution of China’s stock market. Inferences could be valuable to international portfolios coving these markets.
In addition, this paper makes a methodological contribution to extend the vector error correction model (VECM) to the fractionally integrated VECM (FIVECM) in examining the co-movements of the China’s market with the US and HK markets. Using FIVECM enables investors not only to reveal the existence of a long-run equilibrium relationship and short-run dynamics among cointegrated variables, it also accounts for possible long memory in the cointegration residual series which may otherwise bias the estimation and draw misleading inference. Furthermore, conditional heteroskedasticity is often observed in market return series due to ever-changing underlying economic conditions over time. Accordingly, we augment the FIVECM with a GARCH-type model to capture the second 40
Z. Yi, C. Heng, W.K. Wong / Journal of Risk and Financial Management 2(2009) 38-74 moment autocorrelations in the return series. In particular, we employ the BEKK(1,1) model proposed by Engle and Kroner (1995) to model the evolution of conditional variances. Since there are no restrictions 1 imposed on the coefficient matrices of conditional mean and conditional variance equations, lead-lag relations in the return series and the possible volatility spillover effects are simultaneously revealed in this model.
Our empirical findings clearly demonstrate that China’s stock market is fractionally cointegrated with both US and Hong Kong markets. Though the volatility spillover between China and the US markets is not clear, in this paper we discovered information transmissions between China and Hong Kong markets. Overall, our empirical evidence demonstrates that China’s stock market has a closer relation with Hong Kong market than the US market. This finding reflects the fact that China’s stock market and financial market as a whole is still under-liberalized and regulated, which renders it operating relatively independent of world’s leading market. The close nexus between China’s and Hong Kong markets is also attributable to the strong dependency of the HK economy to mainland China. We further divided the sample into two sub-samples marked by the East Asian Financial Crisis in 1998 and the recent world financial crisis in 2008 to the financial integration, in order to study the possible structural breaks caused by the crises. However, the estimation results did not show much difference for the two sub-samples before and after the crisis. Therefore, we will skip the discussion of the results for the sub-periods and stick to one sample investigation.
The remainder of the paper is organized as follows: Section 2 reviews the major literatures and states the motivations for this paper. Section 3 describes the data and methodology employed. Section 4 presents the empirical results and implications.
1
Except mild restrictions imposed on the elements of coefficients matrices in order to ensure identification
of BEKK(1,1) model. Readers may refer to Propositions 2.1-2.3 of Engle and Kroner (1995) for more information. 41
Z. Yi, C. Heng, W.K. Wong / Journal of Risk and Financial Management 2(2009) 38-74 Conclusions are made in Section 5.
2. LITERATURE REVIEW AND MOTIVATIONS
The basic tenant of portfolio theory is that international investors should diversify assets across countries, provided that returns to stocks across countries are not highly correlated. The seminal studies of market interdependence and portfolio diversification include Grubel (1968), Levy and Sarnat (1970), Ripley (1973), and Lessard (1974). These studies have investigated integration between developed markets, integration between emerging markets, and integration between one or more developed markets and several emerging markets.
Most of the early studies used correlation analysis to examine short-run linkages between markets. However since the beginning of the 1990s, several studies, of which Kasa (1992) is one of the earliest, have used cointegration methods to examine whether there are long-run benefits from international equity diversification. Whether stock markets are cointegrated carries important implications for portfolio diversification. Cointegration between markets imply that there is a common force, such as arbitrage activity, to bring the movements of stock markets together in the long run, inferring that testing for cointegration is a test of the level of arbitrage activity in the long-run. In theory, if stock markets are not cointegrated, arbitrage activity to bring the markets together in the long-run is zero, inferring that investors can potentially obtain long-run gains through international portfolio diversification (Masih and Masih, 1997, 1999). On the other hand, if the markets are cointegrated, the predictability of each stock market can be enhanced through using information contained in the other stock markets. In this situation, the potential for making supra-normal profits through international diversification in the cointegrated markets is limited in the long run. This is because supra-normal profits will be arbitraged away in the long-run and, in the absence of
42
Z. Yi, C. Heng, W.K. Wong / Journal of Risk and Financial Management 2(2009) 38-74 barriers or potential barriers generating country risk and exchange rate premiums, one would expect similar yields for financial assets of similar risk and liquidity irrespective of nationality or location (von Furstenberg and Jeon, 1989).
Granger (1986) suggests that cointegration between two prices reflects an inefficient market on the basis that if two prices share a common trend in the long run, this implies predictability of each price’s movement, which in turn indicates that one market may be affected by another. The more accepted view, however, is that cointegration does not necessarily imply anything about efficiency (Dwyer and Wallace, 1992). For example, Masih and Masih (2002) suggest that a market is inefficient only if by using the predictability, investors can earn risk-adjusted excess returns, but predictability itself does not necessarily say anything about risk-adjusted excess rates of return.
Most studies testing for long-run relationships between markets have typically used the method of cointegration pioneered by Engle and Granger (1987) and Johansen (1988). Fernandez and Sosvilla (2001, 2003) examined stock market integration between the Japanese market and Asia Pacific markets, and United States market and Latin American markets, respectively, using the Johansen (1988) and Gregory and Hansen (1996) approaches to cointegration and found more evidence of cointegration allowing for a structural shift in the cointegration vector. On the other hand, Siklos and Ng (2001) considered whether stock markets in the Asia-Pacific region were integrated with each other, and with the United States and Japan using the Gregory and Hansen (1996) approach to testing for cointegration, and found that the 1987 stock market crash and 1991 Gulf War were turning points in the degree of integration.
Other common approaches to analyze co-movement include VAR analysis and Bayesian approach. For example, using VAR analysis, Eun and Shim (1989) found evidence of co-movements between the United States stock market and other world equity markets. Investigating the dynamics of stock market returns of the US, Japan and
43
Z. Yi, C. Heng, W.K. Wong / Journal of Risk and Financial Management 2(2009) 38-74 Asia-Pacific stock markets, Cheung and Ng (1992) found that the United States market was a dominant global force from 1977 through 1988. However, not all research supports cointegration among international stock markets. Using Bayesian methods, Koop (1994) concluded that there are no common stochastic trends in stock prices across selected countries. Due to the significance of October 1987 crash of the US market, Lee and Kim (1994) examined and found that national stock markets became more integrated after the crash. Similarly, using a VAR and impulse response function analysis, Jeon and Von-Furstenberg (1990) showed a stronger co-movement among international stock indices after the 1987 crash. There is a large literature on integration among the Asia-Pacific markets or integration between major world equity markets and Asia-Pacific markets. For example, Ng (2002) and Daly (2003) examined market linkages between Southeast Asian stock markets. There are several studies which consider whether the Japanese and/or United States market is cointegrated with Asia-Pacific markets (Cheung and Mak, 1992; Chung and Liu, 1994; Pan et al. 1999; Johnson and Soenen, 2002).
When a set of variables are cointegrated, the well-known Granger representation theorem yields vector error correction model (hereafter VECM) as the proper model to incorporate both cointegration relation and short-run dynamics among cointegrated variables. Most of cointegration studies listed above employs VECM to reveal the relations between underlying variables. The key aspect of VECM is that cointegration residual or error which is supposed to be I(0) process exerts correction effect to the long-run dynamics of underlying series. Specifically, when cointegrated variables deviate from the long-run relation, the immediately past period cointegration error acts as a force to pull the drifting variable back toward the equilibrium. This adjustment mechanism is based on the key assumption that the cointegration error follows a stationary I(0) process. However, the cointegration error between economic and financial series has been found to exhibit long memory feature which is consistent with neither stationary I(0) nor nonstationary I(1) processes. This special stochastic process is termed I(d) process with d being fractional real number, see, for example, Baillie (1996). When the cointegration error follows I(d) process which is found to be case for this study, long history of lagged 44
Z. Yi, C. Heng, W.K. Wong / Journal of Risk and Financial Management 2(2009) 38-74 cointegration errors also have correction effect to the dynamics of cointegrated variables. FIVECM has been applied to optimizing dynamic hedging ratios in derivatives market, like Lien and Tse (1999), but rare in studies on cointegration of equity markets.
Since China’s market has a short history, the interactions and relations between China’s market and other world markets have not been extensively investigated. One exception is Huang et al (2000) who examined whether there is a long-run relationship between the stock markets of the United States, Japan and the South China Growth Triangle using the Gregory and Hansen (1996) method and found that the only markets among these which are cointegrated were Shanghai and Shenzhen. However, China’s stock market, initiated in early 1990s, has made a leaping progress during its only fifteen years’ presence, the total capitalization has reached US$464.29 billion, 1378 companies are listed and more than 72 million investors are registered across the country (as of date Feb. 2005). Today, China is widely considered the most promising developing market. China’s rising stock market echoes its fast-growing economy and its increasing interaction with the world in terms of trade. China’s GDP has more than tripled from 1993 to 2003, the total amount of foreign trade (imports plus exports) of China jumped from US$115 billion in 1991 to US$1100 billion in 2004. China’s astonishing economic achievements during the last two decades are largely attributed to open and market-oriented economic policies implemented from early 1980s. As China’s economy is increasingly integrated with the world economy, China has also stepped up reforms and liberalizations of its financial market. Especially prior to and after joining the WTO, China accelerated the deregulation in financial market, meaning a great deal of the previous restrictions imposed on financial markets were lifted. Within 3-5 years, China’s financial market will be completely open to foreign investors. International investment funds are also preparing to the fully take advantage of the lucrative opportunities offered by China’s market. It is worthwhile at this critical point to assess the integration of China’s stock market with the world market proxied by the US and Hong Kong markets in this paper. The resulting inferences could yield some valuable insights to investors as
45
Z. Yi, C. Heng, W.K. Wong / Journal of Risk and Financial Management 2(2009) 38-74 well as policy makers.
3. DATA AND METHODOLOGY
3.1. Data description
We employed weekly data for the period from January 1998 through May 2009, giving 595 observations, in our study. Downloaded from Datastream, the stock price indices are the Shanghai All Shares Index ( SHH t ) for China2, Hangseng Index ( HS t ) for Hong Kong, and S&P 500 ( SPt ) for the United States. To avoid the ‘day-of-the-week effect’ which suggests that the stock market is more volatile on Mondays and Fridays, we use the Wednesday indices, readers may refer to Lo and MacKinlay (1988) and Chen, et al. (2008) for the details. The sample covers the whole history of the Chinese stock market up to the commencement of this study.
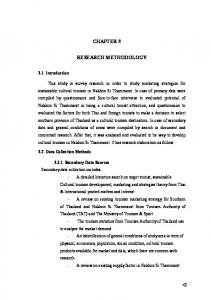
The normalized indices with starting value for each index is set to be 100 are displayed in Figure 1, revealing that the Shanghai All Shares index is more volatile than the other two indices. This is also confirmed by the summary statistics of the data shown in Table 1. From the table, we notice that the standard deviation for the Shanghai All Shares index is 0.389, higher than those of S&P 500 and Hangseng indices, revealing higher variability in the China’s stock market. The most striking feature of the S&P 500 index from the figure is its continuous growth from early 2003 through mid 2007 when it reached a peak and then fell due to the subprime crisis which triggered the global financial crisis in 2008. Compared with S&P 500, Shanghai and Hangseng indices exhibit more large short-lived ups and downs in our studying period. 2
Shanghai All Shares index is the most commonly quoted index to represent China’s stock market, because
most large (especially state-owned) companies are listed in Shanghai stock exchange (SHSE). The market capitalization of Shenzhen Stock Exchange is about half that of SHSE, and thus, it is less used to represent China’s stock market. 46
Z. Yi, C. Heng, W.K. Wong / Journal of Risk and Financial Management 2(2009) 38-74
120
Figure 1: Stock indices of China, USA and Hong Kong
100
105
110
115
C HN SH H HK HS U S SP
199 8
1999
2000
2001
2002
200 3
2004
200 5
2006
2007
2008
2009
Notes : CHN SHH, HK HS, and US SP represent the normalized values of the Shanghai All Shares index, Hang Seng Index, and S&P 500, respectively. All indices are normalized so that they start at 100.
Table 1:
Descriptive statistics of data SHH t
SPt
HS t
Min:
6.928
6.569
8.833
Mean:
7.475
7.076
9.537
Max:
8.705
10.353
7.354
Std Dev.:
0.389
0.165
0.296
Skewness:
1.303
-0.582
0.371
Kurtosis:
1.244
-0.318
-0.224
Statistics
Notes: SHH t , HSt , and SPt are the logs of the weekly Shanghai All Shares index, Hangseng index, and S&P 500 index, respectively. The kurtosis is the excess kurtosis.
47
Z. Yi, C. Heng, W.K. Wong / Journal of Risk and Financial Management 2(2009) 38-74 3.2: Methodology
To examine the existence of the cointegration relationship between stock price indices, we employ the Granger two-step procedure. In the first step, we fit the following dynamic ordinary least squares (DOLS) model to each pair of stock price indices: y1t = α + β y 2t + Here,
( y1t , y2t )
p
∑ ω ′ ∆y
j =− p
j
2t − j
+ ηt .
(1)
are the pair of stock indices chosen from SHH t , HS t , and SPt .
Regression (1) is superior to the ordinary least squares, because the estimate βˆ from (1) is found by Stock and Watson (1993) to be super-consistent3 and asymptotically efficient. The estimated cointegration residual ( zˆt ) can then be constructed by: zˆ t = y1t − βˆ y 2t .
(2)
The definition of the cointegration approach suggests that some linear combinations of a set of I(1) variables could turn out to be stationary I(0) processes4. However, as first noted in early 1980’s, the characteristics of auto-dependence in cointegration residuals are found to comply with neither I(1) nor I(0) process. Baillie (1996) points out that the dichotomy between I(1) and I(0) could be too restrictive. Thereafter, researchers turn attention to investigate the process in the halfway between I(1) and I(0); that is, the fractionally integrated I(d) process with fractional real number d . In econometrics, the focus of study is on the I(d) process with -0.5