photographs, satellite images, or more abstract GIS ... It also provides GIS users
with the visualisation, user interface, and object .... A good example is the Virtual.
39 Virtual environments and GIS J N NEVES AND A CÂMARA The coupling of virtual environments (VEs) and traditional GIS creates what can be termed a virtual GIS. This integration brings to virtual environments the spatial analysis and query functions common to GIS. It also provides GIS users with the visualisation, user interface, and object manipulation features inherent to VEs. Several virtual GIS research projects are discussed in this chapter. Virtual environments provide, in addition, the ground for innovative user interfaces in spatial exploration: bridging miniature with virtual representations of territories; direct data querying; use of sound, time, and space sliders; and logging. These proposals and their relevant geographical applications are also reviewed.
1 INTRODUCTION A virtual environment (VE) is a broad term that has its roots in notions such as cyberspace, artificial reality, and virtual reality. The notion of cyberspace was introduced by William Gibson in Neuromancer, while artificial reality and virtual reality were proposed by their pioneers Myron Krueger and Jaron Lanier, respectively. In virtual environments, the user is inside a digital world, where he or she can explore and transform objects. The feeling of immersion is achieved by feeding the user’s senses with (often 3-dimensional) images and sounds generated in real time. When immersed in VEs, the user can easily scale, rotate, and translate objects and the viewpoint. Virtual environments are thus an appropriate platform for spatial exploration. Indeed, digital terrain models draped with textures are an essential component of many VEs. The digital terrain models are represented, as usual, by regular or hierarchical meshes, or triangulated irregular networks (TINs: see De Floriani and Magillo, Chapter 39; Hutchinson and Gallant, Chapter 9). The textures are derived from aerial photographs, satellite images, or more abstract GIS layers (e.g. soil use, wind, vegetation, aspect). Thus raster geographical data are well-suited for integration into virtual environments, as manifest in
the many civil and military virtual reality applications. Vector data are harder to integrate into virtual environments, particularly when the vectors have to be superimposed onto pre-existing terrain models. However there are reasonably efficient techniques to automate this process. In section 2, a detailed review of virtual environments is presented, which focuses on object representation, on interfacing within VEs, and also on technical issues relevant to interfacing with the sensory channels. In section 3 the integration of VEs and GIS is analysed in a discussion focusing on representational, performance, design, and interface issues. Section 3 also provides pointers to several projects connecting VEs to GIS, and a short discussion of current technological developments and future research directions.
2 VIRTUAL ENVIRONMENTS Virtual environments or virtual worlds are those that result from the interaction between the cognitive level of the human being, usually designated as mental maps, and the visual and audible images produced by the computer. A virtual world is a space deliberately designed by humans, to represent real or abstract spaces in which exist objects, which are
557
J N Neves and A Câmara
governed by rules specified for the worlds they inhabit (Jacobson 1994). Virtual worlds can be used to organise, represent, and manipulate data with multi-dimensional characterisitcs. They can be seen as planar images, 2.5-dimensional models in a conventional monitor, or as a true 3-dimensional space in an immersive environment. Virtual worlds can also include information with more than three dimensions, including the temporal dimension (Jacobson 1994). The use of virtual reality (VR) techniques allows high-fidelity spatio-temporal representations, because the decision-maker is able to interact directly with the elements which form the basis of the user’s decision. This ability to feel, as opposed to qualify, the results of an action makes the understanding clearer and universal. Virtual environments facilitate human–computer interaction by the use of a 3-dimensional representation and direct manipulation of virtual objects (Burdea and Coiffet 1994). In traditional VEs the user is immersed in a 3-dimensional world generated by a computer using a head-mounted display, and position and orientation sensors.
2.1 Defining terms Several concepts are associated with VEs, and a detailed introduction to the subject must necessarily begin with their identification. The field of VE has been strongly influenced by the pre-existing fields of teleoperation and simulation. After the emergence of VE, a new field with a lot of similarities with VE appeared, called augmented reality. In teleoperation systems a real environment is sensed by special-purpose sensors capable of giving visual and audible records of the environment. This information is sensed by a robot, which is called a telerobot because it is being manipulated by a human being. The human operator has access to the information sent by the robot using a specially-designed human–machine interface which conveys such information in multi-sensory display devices. The human takes actions in the form of motor actions that, being sensed by the interface, are transformed into signals to control the telerobot. The degree of control that the human operator has on the telerobot varies. When the telerobot is completely autonomous it is called simply a robot. The purpose of teleoperation
558
is to extend the sensorimotor system of the human organism (Durlach and Mavor 1994), making the human operator more able to sense an environment remotely or locally. VEs are directed not to sense a real environment but to interface with a simulated environment. The human operator is called a user, who can interface with a computer using a human–computer interface in order to solve some kind of problem. What makes VEs unique is that this interface immerses the user in a digital environment by the use of multi-sensory displays and controls: displays that impress a multitude of senses, and controls that react to inputs coming from multiple human language constructs (speech, body language). Virtual worlds are populated by 3-dimensional objects (with locations and orientations in 3-dimensional space) that have encapsulated behaviours capable of enriching the human experience. The user can move independently of these objects, manipulating them in real time. Special input/output devices give the user a way to interact with the digital environment using a variety of motor output channels, directly connected to the senses. This multi-sensory environment serves vividly to convey the feeling of presence in the simulated environment, whether realistic or abstract. VEs are used to present and interact with information stored in a computer. There is a transfer of information from the computer to the human such that the human’s knowledge, both physical and psychological, is increased. This makes VEs especially attractive for education and training and for scientific visualisation. Virtual environment systems are also being used in the areas of medicine, marketing, telecommunication, information visualisation, product design, manufacturing, and entertainment. In augmented-reality (AR) systems virtual and real environments are combined to form a unique environment which is shown to the user. Usually it consists of a see-through display where the information from the real world (coming from video cameras) and from the digital world (coming from the computer) are overlaid upon one another. The human–machine interface is very important to all of these systems (teleoperation, VEs, and AR) because it strongly affects the performance and subjective experience of the human operator in the real or virtual environment. The interaction must be transparent, that is, the electronic mediation must be perceptually neutral. This is particularly important
Virtual environments and GIS
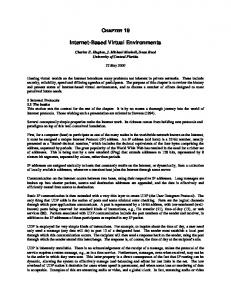
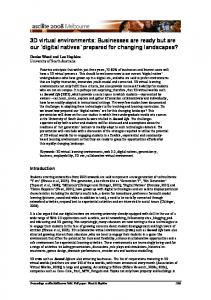
for the subjective sense of presence experienced by the user. The sense of virtual presence is dependent on the amount of stimulation coming from the immediate environment and also on the variety and simplicity of the interaction. VEs are unique mainly because of their multisensory, immersive, interactive, and 3-dimensional nature. VEs are computer objects with behaviours and appearance resembling real-world objects, and the user’s interaction with them has strong similarities with interaction in the real world. This is the reason why VE interfaces are known as ‘no metaphor’ interfaces. In recent years the senses most researched have been, in descending order, vision, audition, and haptics. Olfactory and gustatory displays are not common. The basic piece of technology used to display visual and auditory displays is the headmounted display (HMD: see Figure 1); gloves are used to display haptic signals. HMDs always involve the tracking of the user’s head position and orientation, giving the computer the parameters to render the visual and auditory signals in real time. Gloves measure hand position and finger joint angles. Feedback is usually presented by a virtual hand, although this arrangement does not give haptic sensory feedback. Devices capable of giving force and tactile feedback, or texture and temperature displays, are still not available commercially.
2.2 Sensory channels As noted above, the most-used channels in the field of VE are the visual, the auditory and the haptic. The
other channels are rarely used and are not as suitable for the spatial information systems considered here. Since the projects reviewed in this survey do not use the haptic channel, only the visual and auditory channels will be reviewed in this chapter. 2.2.1 Visual channel
The field of VE has always been associated with HMDs. These displays include the capacity to present 3-dimensional images and sounds, through the use of tiny screens close to the human eye, with additional optics to make these images perceptible; earphones to convey audio; and tracking systems to measure head position and orientation in order to generate such displays. These displays still have strong limitations in the resolution and field of view of the visual images, in addition to certain ergonomic problems. A different type of display, intended to deal with the limitations of HMDs, is called an ‘off the head’ display (OHD). A good example is the Virtual Environment Theatre (VET) described below. The Boom from Fake Space Labs, lightweight stereographic glasses, and desktop stereo display screens are other kinds of display systems currently available. See-through displays are basically HMD where digital and environmental images (from video) are mixed and presented to the user in the same display. They still suffer from registration problems (arising out of misalignment of digital and environmental images), which have been the subject of extensive research (State et al 1996). 2.2.2 Auditory channel
Fig 1. User wearing a head mounted display (HMD) in a typical immersive VE system.
There are two approaches to the presentation of auditory signals to the user: earphones, which are usually built into the HMD, and loudspeakers. Loudspeakers are preferable if the goal is to generate loud sounds and also to provide a physical impression. Earphones are more suited to individual experiences, where the information is presented to a single user or multiple users inhabiting the same virtual world but receiving different signals. The measurement of head-related transfer functions (HRTF) and their incorporation into 3-dimensional audio-processing boards are still inadequate, particularly in the simulation of sounds located in front of or behind the user. Moreover, recording and playback of sounds requires large amounts of disk storage, and also the real-time generation of sounds still does not include
559
J N Neves and A Câmara
environmental sounds. Only methods to generate music and speech exist, and their application in VE remains limited. The use of auditory signals for sensory substitution or to present information in parallel with the visual signals is an important field of study, mainly in the design of effective user interfaces for VEs.
2.3 Objects and operations Objects that can be incorporated in VE have a hierarchical structure: nodes group several objects, objects group several polygons, and polygons group several points or vertices (usually three). The atomic element is a vertex with three coordinates x,y,z that represent its location in 3-dimensional space. Objects in VE can be realistic or abstract. They can have a 1:1 relation with their physical counterparts (when they represent real-world objects), or may be scaled in time or space. In the case of abstract objects they can represent a different sensory modality (sound icons, for instance) or they can be represented through a visual metaphor (Stuart 1996). The objects that populate a VE can be produced by keying the vertices’ and polygons’ definitions directly into a text editor, using a 3-dimensional modelling package or directly from real objects using a 3-dimensional digitising system. They can also be produced in real-time in the virtual environment as a result of user modelling or as an output of a simulation process (Stuart 1996). Objects have several attributes that characterise them or that make explicit their links to multimedia information: position and orientation, scale, colour, feel, texture and shape, visibility, interaction with other objects, attached sound, weight, and inertia. Each of these attributes can be changed, thus defining the set of operations available on objects. Intelligent behaviour, like that of robots, is a further characteristic of objects that is being studied extensively.
2.4 Interacting with VEs The most basic interaction mode in VE is navigation: walking (terrain following) or flying over the virtual space. Other possibilities include (Stuart 1996, following Mine 1995): ● ● ● ●
selection; manipulation; scaling; menu and widget interaction.
560
These interaction modes are related to our usual modes of interaction with real-world objects like touching, grabbing, and moving. Touching objects can also activate some kind of simulated behaviour, such as the effects of gravity, or a pre-recorded animation, such as opening a door. The approach used to represent the interactions with these objects also can vary, and may entail (Stuart 1996, following Mine 1995): ●
●
●
direct manipulation (body tracking and gesture recognition); use of physical controls (buttons, joysticks, and other haptic devices); use of virtual controls, such as controls that resemble physical controls or that follow the WIMP (windows, icons, menus, pointer) model.
Virtual space- and time-sliders, along with the possibility of taking notes (logging), can increase the usability of the virtual environment. When users are exploring virtual spaces they often need to have information about a particular location, whether static or dynamic (resulting from a simulation process). Details on this subject can be found in the work of Dias et al (1995). Spatial sound and generation of non-spoken audio are critical areas of research in virtual environments, as they can dramatically increase their level of realism. Buxton et al (1993) present the main questions and the answers currently available. The generation of non-spoken audio assumes that the audible world is composed of a set of acoustic objects. Features such as tone, intensity, and rhythm may specify the identity of objects and render significant events or actions in the virtual world. These features may be manipulated systematically, creating a sound symbology extending from common sounds to the more abstract mapping of statistical data into sound parameters (Buxton et al 1993). The nature of sound makes it the best choice to complement the role of images in portraying views of the state of the system. Sound has strengths that seem to solve some of the problems inherent in the visual representation of scientific data (Shepherd 1994): ●
●
●
it can be used to interpret multi-dimensional data because many parameters can be used to denote change; it can be used to represent parameters that change over time; sound is omni-directional and is not affected to the same extent as light by physical barriers.
Virtual environments and GIS
Above all, sound is very useful because it works in parallel with vision and so does not overload the user with information.
3 VIRTUAL GIS The current generation of GIS have graphical user interfaces (GUIs) with numerous pull-down menus and widgets, following the WIMP model (see Egenhofer and Kuhn, Chapter 28). In such systems interaction is predominantly with the mouse in a point-and-click fashion. Additionally, working with geographical information means working with several layers of information simultaneously, which is a task inappropriate to common GUIs. VEs provide a very natural way of interacting with and visualising data, and can be used effectively to interpret multi-layer data and to analyse the interactions between layers (Faust 1995). Immersion (total or partial) within geographical databases facilitiates very intuitive means of navigation; it can also give the user new opportunities to understand the spatial relationships between GIS variables, and allow the user to perform vertical or horizontal analysis (Faust 1995) while visualising data. Simulation models could be integrated into the same exploration-based interface (Neves et al 1995), making results directly perceptible. The way-finding metaphor provided by VEs can be considered a human–problem interaction metaphor instead of a human–computer interface metaphor (Edwards 1992). As Edwards points out, the formation of contextual mental models of problems is only possible if the human has experienced the problem first-hand. Virtual environments provide a rich environment to position the user in the space and time of the problem, making possible the formation of mental maps which are already rich in contextual information.
3.1 Bridging VE and GIS Two opposite approaches have been used in the past to integrate GIS and VE: ●
●
develop a GIS inside a VE, in order to implement GIS functions; or integrate both the GIS and the VE, allowing them to exchange objects.
The first approach was until recently the only one available because commercial GIS designs did not follow object-oriented principles (see Worboys, Chapter 26). With the advent of object orientation in GIS the second alternative has become more feasible, and some projects have already followed this approach (Neves et al 1995). The continuing decrease of price/performance ratios in personal computers, making computers with several processors relatively inexpensive, will make the second alternative even more attractive. Strong market pressures are leading GIS vendors in the direction of open object formats, making the development of GIS functionality much easier than before. The leading GIS vendors are already following this path.
3.2 Level of detail management In order to explore large terrains, level of detail management algorithms (LODs) are essential for realtime rendering. The goal is to maximise image quality while maintaining a sufficiently rapid frame rate for an immersive walk-through, knowing that triangle size (in TINs) and texture resolution should vary inversely with the distance to the viewpoint. LODs are often based on quadtree representations for both the terrain and the textures. The different levels of detail may be pre-computed and stored on disk, or may be dynamically computed using a wavelet decomposition of the information (images and terrain). This enables not only the storage of different levels of detail but also its update on a local and multi-resolution basis. Implementations using several levels of detail for terrain data fall in two categories. The first aims to represent data with high resolution but covering relatively small areas, while the second aims to represent data defined on the sphere (i.e. a simplified Earth’s surface). In the former category the original data are generally arranged in an elevation matrix and a hierarchical tree is built subdividing the space in rectangular patches (Hughes 1993; Lindstrom et al 1996; see Plate 37). The area covered is relatively small so the function domain can be considered to be a plane region. Otherwise, the data need to be mapped to the sphere using parameterisation. However, mapping errors always occur since there is no globally smooth parameterisation for the sphere. The second category starts on a base shape of triangles, resulting in several trees, each one subdividing a triangle of the base shape recursively (Fekete 1990). This way, each triangle can have a corrected parameterisation.
561
J N Neves and A Câmara
The triangulations used on both categories are generally regular triangulations. As wisely stated by Scarlatos and Pavlidis (1992), terrains form continuous linear patterns which generate critical lines like ridges or channels. A regular triangulation generates edges that do not conform with these features. For this reason, when using a regular tessellation, a large number of triangles must be used to create a consistent approximation. But irregular triangulations can be built according to terrain features and can be arranged hierarchically, in order to provide different levels of detail across space. However, they cannot be updated at multiple resolutions. Scarlatos and Pavlidis (1992) describe such a representation, but it is rather complex since it considers several triangle-split strategies at the same time (see also De Floriani and Magillo, Chapter 38; Hutchinson and Gallant, Chapter 9). The real-time rendering of terrains with their level of detail defined on a local basis involves the correct determination of the minimum level of detail to use for each area. Lindstrom et al (1996) present rules for this purpose, by reducing topography and texture data based on both distance and orientation.
3.3 Multi-resolution representation Multi-scale simulation and visualisation has the advantage of being more efficient, because detail is used only when and where needed. The resolution can be increased or decreased because the detail information allows changing scales. However, none of the representations cited above allows multi-resolution updates. Recently, Lounsbery at al (1994) presented a multi-resolution representation for surfaces of arbitrary topological type. The base shape used is an octahedron (eight faces). However, classical wavelets are used, which are defined for the real line or the plane. Hence, the method relies on parameterisation and consequently it is not the actual data that are represented but an approximation of them. This problem has been overcome by Schröder and Sweldens (1995), who describe a representation that uses second-generation wavelets defined on the sphere. In the representation used by Muchaxo et al (1996) the terrain data are considered to be planar. Multiple resolution is achieved using wavelets defined on the Haar basis, which was chosen because it has compact support and is fast to compute. Other wavelet bases can be used but have inferior performance. In order for wavelets to be used, the size of each data matrix must be a power of two in
562
both dimensions; however it is not required that the powers be equal. A previous implementation was recently presented that does not impose this restriction, but does not use multiple resolutions (Muchaxo 1995). In order to represent information pertaining to an extensive terrain in several levels of detail, the terrain could be recursively subdivided using a quadtree and several levels of detail computed and saved. However, redundant information would exist among the several levels of detail and the update of data would be nearly impossible to perform. To avoid this, the quadtree must be created in multi-resolution form: a low resolution version of the data should be used for the root of the quadtree, and detail coefficients should be organised at increasing resolutions in the hierarchy. However, to arrange the quadtree according to level of detail, the detail coefficients need also to be organised according to their spatial influence. A method to accomplish this is presented by Muchaxo et al (1996). A continuous resolution increase across the terrain requires a level-of-detail management in terms of data points. While this is appropriate for multi-resolution painting of images, it is not appropriate for 3-dimensional systems since the rendering is done on a polygon basis and the texture assigned to it is considered to have a homogeneous resolution. Hence the levels of detail are stored and managed on a quad cell basis using small sub-matrices. The size of these is chosen based on the Haar system described by Muchaxo et al (1996). Most raster geographical data can be converted to multi-resolution form by the process described by Muchaxo et al (1996). No distinction is made between different data types when creating the quadtree, except for the number of independent components of each. As an example, an aerial photograph may have three independent colour components, while topographic data have only one component. A quadtree is built for each component. Subtitles can also be used to map the values of the layer components to colours shown to the user. Since the Haar wavelet transformation averages values to obtain a lower resolution, only layer types for which the interpolation of values makes sense can be considered. Since all the updates performed in real time on the layer components are considered to be linear operations, other kinds of operation are not possible.
Virtual environments and GIS
3.4 Design of virtual geographical systems The purpose of designing virtual geographical information systems (VGIS) is to provide environments in which efficiency in the interaction with spatial problems is maximised. Performance in VEs is influenced by several factors that are related to the characteristics of the task, the user, and the medium (Stanney 1995). Bennett et al (1993) suggest that 3-dimensional displays should be used in tasks that require integration of information and that tasks requiring focused attention should use 2-dimensional displays. It has also been found (Stanney 1995) that texturing virtual objects can be effective to represent additional data dimensions. User characteristics also affect efficiency in exploring VEs and should be considered when designing VGIS. The level of experience of the user influences the design of human–computer interfaces (Stanney 1995) and technical aptitudes like spatial visualisation and orientation are important issues to consider, particularly in VGIS interface design. Empirical observation shows that the great majority of users get lost in large VEs, so interfaces should be designed to assist users in maintaining spatial orientation within virtual worlds (Stanney 1995). The integration of multi-modal interaction is also an important issue in the design of virtual worlds. Studies indicate that sensory redundancy improves performance in VE (Burdea and Coiffet 1994; Larijani 1994). This sensory integration can be addressed by two different approaches (Stanney 1995): ●
●
command coordination, with the input being unimodal and the output multi-modal; sensory transposition or sensory substitution, used in particular when there is no way to display sensory information in the channel being substituted (Massimino and Sheridan 1993).
The implications of the factors described above in the design of VGIS interfaces should be the object of further study, as the acceptance of such systems on a day-to-day basis depends on it. The related area of intelligent user interfaces has produced good results which should be incorporated in the design of VGIS.
3.5 Interfaces The previous section presented issues that should be considered in designing VGIS interfaces. Several
previous interface designs have introduced interesting concepts that could be applied to VGIS interfaces. The Worlds In Miniature concept (WIM) (Pausch and Burnette 1995; Stoakley et al 1995) is one such interesting development. In it, interface navigation and object manipulation in the VE were integrated in the same interface using a tablet and a hand-held trackball. The tablet presented a miniature representation of the simulated environment, and whenever the user wanted to manipulate or scale an object the operation was performed in that miniature world. Also any change in viewpoint was achieved by manipulating an object that represented the user in the WIM. In the Virtual GIS Room project described below (Neves et al 1995) a similar approach is followed. The user has a virtual camera (i.e. a position- and orientation-tracked small object resembling a camera) in one hand, a wireless pen in the other hand, and a sensing tablet. The tablet is the WIM of the VGIS. Visual and audible display is presented in the computer monitor and speakers and in the HMD. Usually navigation and interaction do not coexist: the user has two different modes of interaction and changes between them by touching a button on a 3-dimensional mouse or joystick. In these types of system large-scale navigation or large-scale object manipulation is performed by pointing to the destination. The user then has the option to choose from an instantaneous position-orientation transformation, or to draw a path between the initial and the destination point. Additional fish-eye views give some cues to avoid the user becoming lost in the virtual world (Koller et al 1995). In VGISs the information that usually resides in a GIS is reachable directly because the physical objects have a 3-dimensional representation in the virtual world. So actions such as touching, grabbing, and moving can always display information about the object being manipulated, in the form of 2dimensional or 3-dimensional text or in the form of sound. GISs have always had visually-dominated interfaces, and this fact has influenced the design of VGISs. No VGIS is known that uses speech processing for querying data. Usually sound is used only as an output modality and not as an input modality. The ability to make voice annotations would dramatically improve the efficiency of VGISs mainly in their educational component (see Forer and Unwin, Chapter 54; Longley et al, Chapter72).
563
J N Neves and A Câmara
3.6 Applications Systems allowing real-time visualisation of terrain datasets have been the object of attention in the past few years. NASA’s Virtual Planetary Exploration Project (Hitchner 1992), the Terra Vision System (T-Vision Project, http://www.artcom.de/projects/terra; Leclerc and Lau 1994), and the MAGIC project (http://www.magic.net) are three good examples of implemented systems that fall into this category. Another system, the NPSNET (Macedonia and Zyda 1994) is a large-scale distributed virtual environment for military simulation and training. It is one of the first systems to implement distributed virtual environments with large datasets. The Virtual GIS project (Koller et al 1995; Lindstrom et al 1996) is an integrated real-time 3-dimensional GIS. It is truly immersive, allowing the user to navigate and understand complex and dynamic terrain databases. The interface to the GIS data is based on the direct manipulation metaphor in both the window-based version and the virtualreality version. The emphasis is on the high-resolution rendering of geographical features based on fast access to large databases on remote servers. Very efficient rendering algorithms (using LOD) and tightly-coupled distributed systems with high-speed processing units for parallel computation and input/output, together with a specialised graphics system for real-time rendering and interaction, provide the means to make such systems possible (Plate 38). The work of Worldesign (Jacobson 1994) is one of the few examples of a company that is actually selling the idea of joining virtual worlds to GIS. This company has developed the VET which is an immersive projected environment, consisting of a set of screens surrounding the users (270 degree field of view) where images are projected. Worldesign has built a strong lead in the application of VE to planning and environmental impact assessment (EIA), and has made available tools to convert data from GIS to VE systems. AEPD-3D is a software engine that automatically converts output from AEPD, a GIS-like module for the planning and management of electric power networks, into a 3-dimensional virtual world.
564
The work being conducted by Jonathan Raper at Birkbeck College in London (Raper et al 1993; and see Raper, Chapter 5) has contributed to the issues of interfacing GIS with virtual reality technology. Work at Delft University in the Netherlands (Kraak et al 1995) is oriented to the use of immersive virtual worlds to access GIS databases and perform GIS queries. The authors and their colleagues at the New University of Lisbon are developing the Virtual GIS Room project (Neves et al 1995). Extensive work has been done on LOD algorithms (Muchaxo 1995), and extensions to dynamic LOD by the use of wavelets (Muchaxo et al 1996; Figure 4). The user interface issues have recently been the object of detailed study in the context of the above project (Figure 5).
4 CONCLUSIONS AND FUTURE DEVELOPMENTS This chapter has discussed the advantages to the field of creating virtual GIS, in terms of the consequences to the interaction of GIS users with geographical data. New VE interfaces dealing specifically with geographical problems have been presented, and been reviewed, with emphasis on concepts relevant to VGIS applications. The future success of VGIS will depend on the commercial adoption of interoperability standards such as CORBA (Common Object Request Broker Architecture) and OLE (Object Linking and Embedding). Interoperable environments will, in addition, allow VGIS to run spatial simulation and other analytical tools uncommon in commercial GIS (Sondheim et al, Chapter 24). The ‘moving worlds’ specification from Silicon Graphics established the Virtual Reality Markup Language (VRML) 2.0 format, adding some features that made VRML effectively a good option to deliver geographical information on the WWW (Coleman, Chapter 22). This specification is supposed to evolve to integrate multiple users, making collaborative work on the Web a reality. Will the interoperable objects wave reach the Web? If so, will GIS vendors then follow that path, and how quickly will that happen? The evolution of these trends will determine the way GIS will be used in the future. Immersive sessions of experts on the Web could make human–expert–problem communication a reality.
Virtual environments and GIS
References Bennett K B, Toms M L, Woods D D 1993 Emergent features and graphical elements: designing more effective configurational displays. Human Factors 35: 71–97 Burdea G, Coiffet P 1994 Virtual reality technology. New York, John Wiley & Sons Inc. Buxton W, Gaver W, Bly S 1993 Auditory interfaces: the use of non-speech audio at the interface. Cambridge (UK), Cambridge University Press
Lounsbery M, DeRose T, Warren J 1994 Multiresolution analysis for surfaces of arbitrary topological type. Technical Report. Department of Computer Science and Engineering, University of Washington. ftp://cs.washington.edu/pub/graphics/TR931005b.ps.Z Macedonia M R, Zyda M J 1994 NPSNET: a network software architecture for large scale virtual environments. PRESENCE: Teleoperators and Virtual Environments 3: 265–87 MAGIC project, MAGIC Consortium. http://www.magic.net/
Dias A E, Silva J P, Câmara A S 1995 BITS: browsing in time and space. Conference Companion CHI 1995: 248–9
Massimino M J, Sheridan T B 1993 Sensory substitution for force feedback in teleoperation. PRESENCE: Teleoperators and Virtual Environments 2: 145–57
Durlach N, Mavor A S (eds) 1994 Virtual reality: scientific and technological challenges. National Research Council, National Academy Press
Mine M 1995 Virtual environment interaction techniques. Technical Report TR95-018. Department of Computer Science, University of North Carolina, Chapel Hill
Edwards T M 1992 Virtual worlds technology as a means for human interaction with spatial problems. Proceedings of GIS/LIS San José, 10–12 November: 208–20
Muchaxo J 1995 Multi-scale representation for large territories. Proceedings First Conference on Spatial Multimedia and Virtual Reality, Lisbon, Portugal, 18–20 October
Faust N L 1995 The virtual reality of GIS. Environment and Planning B: Planning and Design 22: 257–68 Fekete G 1990 Rendering and managing spherical data with sphere quadtrees. Proceedings of Visualisation 90 (First IEEE conference on visualisation, San Francisco, 23–26 October 1990). Los Alamitos, IEEE Computer Society Press. Gonçalves P, Diogo P 1994 Geographic information systems and cellular automata: a new approach to forest fire simulation. Proceedings, European Conference on Geographical Information Systems, Paris Hitchner L E 1992 Virtual planetary exploration: a very large virtual environment. Proceedings SIGGRAPH – tutorial on implementing immersive virtual environments Hughes P 1993 Terrain renderer for Mars Navigator. In Wolff R S, Yaeger L (eds) Visualization of natural phenomena. Santa Clara, TELOS – The Electronic Library of Science Jacobson R 1994 Virtual worlds capture spatial reality. GIS World (December): 36–9 Koller D, Lindstrom P, Ribarsky W, Hodges L F, Faust N, Turner G 1995 Virtual GIS: a real-time 3D interface for geographical information system. Georgia Institute of Technology technical report. ftp://ftp.gvu.gatech.edu/pub/gvu/tech-reports/95–14.ps.Z Kraak M-J, Smets G, Sidjanin P 1995 Virtual reality, the new 3-dimensional interface for geographical information systems. Presented at First Conference on Spatial Multimedia and Virtual Reality, Lisbon, Portugal, 18–20 October Larijani L C 1994 The virtual reality primer. New York, McGraw-Hill Leclerc Y G, Lau S Q Jr 1994 TerraVision: a terrain visualization system. SRI International 540 (April) Lindstrom P, Koller D, Ribarsky W, Hodges L F, Faust N, Turner G 1996 Real-time, continuous level of detail rendering of height fields. Proceedings of SIGGRAPH, New Orleans, 4–9 August: 109–18
Muchaxo J, Neves J N, Câmara A 1996 Wavelets and level- ofdetail management: real time and multiresolution for geographical data. Internal report Neves J N, Gonçalves P, Muchaxo J, Jordão L, Silva J P 1995 Virtual GIS Room: interfacing spatial information in virtual environments. Proceedings, First Conference on Spatial Multimedia and Virtual Reality, Lisbon, Portugal, 18–20 October Pausch R, Burnette T 1995 Navigation and locomotion in virtual worlds via flight into hand-held miniatures. Proceedings SIGGRAPH 1995, Los Angeles: 399–400 Raper J F, McCarthy T, Livingstone D 1993 Interfacing GIS with virtual reality technology. Proceedings Association for Geographic Information Conference Birmingham, 16–18 November 3: 1–4 Scarlatos L, Pavlidis T 1992 Hierarchical triangulation using cartographic coherence. CVGIP: Graphical Models and Image Processing 54: 147–61 Schröder P, Sweldens W 1995 Spherical wavelets: efficiently representing functions on the sphere. Proceedings SIGGRAPH 1995 6–11 August, Los Angeles Shepherd I 1994 Multi-sensory GIS : mapping out the research frontier. Proceedings of SDH94 Edinburgh: 356–90 Stanney K 1995 Realizing the full potential of virtual reality: human factors issues that could stand in the way. Proceedings VRAIS 1995 Research Triangle Park, North Carolina, 11–15 March State A, Hirota G, Chen D T, Garret W F, Livingston M A 1996 Superior augmented reality registration by integrating landmark tracking and magnetic tracking. Proceedings SIGGRAPH 1996 New Orleans, 4–9 August: 429–38 Stoakley R, Conway M, Pausch R 1995 Virtual reality on a WIM: interactive worlds in miniature. Proceedings CHI 1995 Denver: 265–72 Stuart R 1996 The design of virtual environments. New York, McGraw-Hill: 175–80
565