Oct 12, 2012 - tectural viewpoints framing the concerns about service automation. These .... vances for automation in the field of system management.
Accepted Manuscript Title: 3D Architecture Viewpoints on Service Automation Authors: Qing GuPlease confirm that given names and surnames have been identified correctly.–>, F´elix Cuadrado, Patricia Lago, Juan C. Due nas PII: DOI: Reference:
S0164-1212(12)00344-5 doi:10.1016/j.jss.2012.12.035 JSS 9084
To appear in: Received date: Revised date: Accepted date:
22-2-2010 10-12-2012 10-12-2012
Please cite this article as: Gu, Q., Cuadrado, F.e., Lago, P., Due nas, J.C., 3D Architecture Viewpoints on Service Automation, The Journal of Systems & Software (2010), doi:10.1016/j.jss.2012.12.035. This is a PDF file of an unedited manuscript that has been accepted for publication. As a service to our customers we are providing this early version of the manuscript. The manuscript will undergo copyediting, typesetting, and review of the resulting proof before it is published in its final form. Please note that during the production process errors may be discovered which could affect the content, and all legal disclaimers that apply to the journal pertain.
*Manuscript
3D Architecture Viewpoints on Service Automation
ip t
Qing Gua , F´elix Cuadradob , Patricia Lagoa , Juan C. Due˜ nasc a
Department of Computer Science, VU University Amsterdam, The Netherlands School of Electronic Engineering and Computer Science, Queen Mary University of London, United Kingdom c Dept. de Ingenier´ıa de Sistemas Telem´ aticos, Universidad Polit´ecnica de Madrid, Madrid, Spain
us
cr
b
an
Abstract
Ac ce p
te
d
M
Service-oriented Architecture is an emerging paradigm for the execution of business-oriented as well as technical infrastructure processes by means of services. Automating the execution of services is of paramount importance in order to fulfill the needs of companies. However we have found that automation -although important- is seldom addressed explicitly as a concern when stating requirements or designing the software architecture of the service-based applications (SBAs). In this paper we define three architectural viewpoints framing the concerns about service automation. These three viewpoints, called 3D (Decisions, Degree, Data), respectively: express architectural decisions about automation; help identifying the level (degree) of automation required, and represent the specific data required to support automation in services. They have been applied to three industrial case studies and one academic experiment. Results show that they successfully support both technical and non-technical stakeholders in understanding how, and communicating upon, their concerns related to service automation have been addressed. The application of the 3D service automation viewpoints to different domains exhibits promising reusability. Keywords: Architecture viewpoint, Service-oriented Architecture, Service-based Application, Automation 1. Introduction New generation business models impose additional requirements on the IT support of business processes [1]. In particular, quickly responding to
Preprint submitted to Journal of Systems and Software
December 9, 2012
Page 1 of 44
Ac ce p
te
d
M
an
us
cr
ip t
new business requirements, continuously reducing IT cost and dynamically integrating new business partners and customers are highly demanded [2]. The Service-oriented Architecture (SOA) [3] as an architectural style has been widely adopted in industry thanks to its ability of providing seamless integration among software services. SOA implementations (i.e. servicebased applications or SBAs) are expected to be autonomous, discoverable and composable, and thereby coordinately deliver business functionalities [4] in a possibly automated way. Automation is defined as “the execution by a machine agent (usually a computer) of a function that was previously carried out by a human.” [5]. Service automation can be defined as the degree to which the service can be executed automatically without human intervention. On the one hand, fully automating services would bring obvious benefits to companies [6]. Automation of service execution cuts down human resource costs as less human effort is required; it minimizes personnel skill requirements and training time as part of technical decisions are taken by services; and it prevents faults caused by human mistakes (e.g. typos). More importantly, the execution of automated SBAs (defined as SBAs where every service is automated) is independent from human performance or availability. On the other hand, fully automating services is in practice not always technically possible or is often restricted by some domain-specific factors. For instance, the automation of service negotiation is extremely difficult as quality requirements must be quantified and formalized as processable information. On top of that, services are often distributed among multiple business partners and thereby not fully controlled by one specific organization. This way, the quality of a SBA depends on the quality of its composing services. Automating service negotiation would mean any malfunctions caused by a service from untrusted service provider would potentially lower the reliability and security of the SBA. As a result, the degree of service automation often depends on the criticality of specific domains and the need of human control. Although service automation is specifically important for SBAs to maximize their capability of dynamically adapting to business changes, stakeholders’ concerns related to service automation are often poorly addressed in the architecture description of SBAs. For automated services, service developers are often concerned with the policies and guidelines regulating their automation; for services that cannot be automated, human actors are often concerned with their participation in the execution of services and their 2
Page 2 of 44
Ac ce p
te
d
M
an
us
cr
ip t
responsibilities. Architects are concerned with communicating their design decisions about service automation with these and other stakeholders (e.g. managers). The lack of explicitly addressing service automation in architecture descriptions becomes evident in the study presented in this paper on the service deployment and configuration architecture (SDCA). The SDCA offers a set of services aiming at automatically deploying new or updated business services of SBAs. The SDCA has been applied to two industrial domains, an enterprise banking domain (called BankFutura) and a personal digital home domain (called HomeFutura). Each service in the SDCA service flow can be configured in terms of the degree of automation to fulfill different requirements of different domains. Despite that service automation is clearly a concern, design decisions on which services can (or cannot) be automated and the rationale behind these decisions are completely missing in the architecture description of the SDCA and its two industrial cases. This lack leads to incomplete architecture description, hurdling sharing and reusing architectural knowledge (AK) [7]. In this work, we take a viewpoint approach [8] for framing a basic set of concerns relating to service automation and providing a set of models, methods and notations to illustrate the way in which the concerns are addressed in architecture design. With this purpose, we followed a typical action research cycle [9, 10] with three iterations, each of which was carried out with one industry partner as a case study. The results of the action research are three service automation viewpoints, which are called 3D service automation viewpoints (for better readability we use abbreviation 3D VP’s in the rest of the paper). The defined viewpoints are focused on capturing service automation concerns. Therefore, aspects such as detailed modeling of service compositions are out of the scope of our work. They can be provided by already existing, complementary viewpoints. Further, validation has been carried out in the evaluating phase of the three action research cycles, thanks to three different case studies. The 3D VP’s consist of three distinct yet inter-related viewpoints, each dealing with one perspective of service automation. The viewpoint ‘Decision on service automation’ deals with the decisions that have been made on the degree of service automation, including the rationale behind them and the link to domain-specific factors. The viewpoint ‘Degree of service automation’ deals with the overall degree of service automation that has been designed within a service flow. And the viewpoint ‘Data relating to service automation’ 3
Page 3 of 44
M
an
us
cr
ip t
focuses on the data that enables different degrees of automation of each service. To further evaluate the applicability of the 3D VP’s, we carried out an university experiment in a service-oriented design Master course asking 11 groups of students to apply the viewpoints to illustrate the service automation aspect of their design of a e-Health system. Within academic limitation, the success of this experiment further confirms the applicability of the 3D VP’s to SBAs in general. The remainder of the paper is organized as follows. In Section 2 we introduce service automation as a service aspect and motivate the need for service automation viewpoints in Section 3. Our research approach is described in Section 4. In Section 5 we document the description of the 3D VP’s developed in this work. We then discuss in Section 6 the visual support that the 3D VP’s provide as well as the applicability of the 3D VP’s. Section 7 concludes the paper summarizing our work. 2. An introduction to automation
Ac ce p
te
d
2.1. Automation and human interaction There are many aspects of a system which can potentially be automated, and multiple possible levels of automation. In [11] a framework is presented for classifying automation aspects depending on the type of human functions being automated (sensory processing, analysis, decision making, action execution) and the level of automation adopted by the system (from identifying the potential options, to suggesting one of them or automatically taking the decision). Decision making and analysis are frequently the kinds of activities where the decision about the level of automation remains more open, and the balance between human and computer is usually decided for each specific system [12]. The emergence of autonomic computing signified one of the latest advances for automation in the field of system management. This paradigm was defined by IBM in 2004 in an attempt to cope with the ever increasing complexity of managing current systems [13]. The intent is to enable the creation of systems which manage themselves in a completely automated way, analogous to biological systems. In the recent years, this proposal has gained consensus from both industry and academia as the preferred approach for obtaining complete system automation (without human intervention).
4
Page 4 of 44
an
us
cr
ip t
A common way to implement autonomic behavior is through the definition of policies [14], reasoning about the available information and deciding how to react to the current state of the system in order to address specific concerns. Policies are central elements behind automated decision making. Sloman [15] defines policies as the “rules governing the choices in behavior of a system”. They represent the goals and the operational constraints of a system, enabling the automation of decisions about aspects such as security management (authorization and access control) or network management (network routing) [16]. Policies can be specified by different policy definition languages, ranging from high level ones that are readable by human-beings (e.g., PONDER and RBAS) to low level ones that are only meant to be processed by software systems (e.g. PCIM and CORS-PR PIB) [17].
Ac ce p
te
d
M
2.2. Automation in service-based applications SBAs often consist of two types of services, business services and management services. Business services implement some business functions, such as hotel booking, care renting or payment. To improve the flexibility and dynamism of SBAs, the management activities supporting the execution of SBAs can also be implemented as services, called management services. Some examples are secure service discovery service in [18], a multi-agent automated negotiation service in [19], an automatic deployment service [20] and a monitoring service in [21]. Maximizing the automation capability of both of these two types of services enables highly dynamic SBAs. However, in practice automating the execution of services and delivering dynamic and reliable SBAs is not always technically possible or even desirable. SBAs introduce additional concerns when compared to traditional software systems [22], that further complicating. As an example, trust concerns heavily influence automation decisions when the SBA relies on externally developed services. These factors and rationale for decisions on service automation should be explicitly documented to improve the quality of architecture description. In Sec. 3.1 we further elaborate this need using a study on automation of service management and deployment. 3. The need for service automation viewpoints In this section we illustrate why the currently available documentation mechanisms are not sufficient for capturing all the aspects related to automation, using a specific example. We first introduce a study we carried 5
Page 5 of 44
ip t
out on the automation of service management and deployment. Further on, we analyze the existing alternatives for capturing that knowledge about the design of the system.
Ac ce p
te
d
M
an
us
cr
3.1. A study on automation of service management and deployment Deployment and configuration of SBAs are key management activities which need to be as automated as possible in order to foster their dynamicity. Automation is addressed by the system analyzed in this work, the SDCA (Service Deployment and Configuration Architecture); a ServiceBased Application which provides a deployment and configuration service for distributed applications and services [23]. The deployment functionality is offered by eight loosely coupled services which collaborate to obtain a distributed deployment plan (containing a set of changes that will be applied to the runtime environment), starting from an initial objective. The composing services perform activities such as connecting to the instrumentation agents for retrieving the runtime information, accessing software repositories, deciding which compatible version of a service to use or choosing where each deployable artifact should be physically located. The architecture has been designed with flexibility in mind as regards all the decisions taken during the process. This way, they can either be completely automated though the definition of policies or be manually controlled by requiring human input for decision making. Over its lifespan, the SDCA has been applied in two different domains: the delivery of services to a Digital Home (HomeFutura) and the support for deploying banking deployment processes (BankFutura). These fields of application have very different concerns: the banking domain imposes hard requirements of reliability, security and stability of the system, while these aspects are not as critical for the end users which consume the services offered at HomeFutura. Additional factors, such as the technical background of the users of the SDCA (IT administrators versus end users), or the specific characteristics in each domain of the runtime infrastructure and the deployed services also present important differences in both cases. These differences caused variation in the degree of automation of the services of one domain when compared to the other, which was made possible by the flexibility of the architecture. As an example of that, for HomeFutura the selection of which runtime node will host each service is automated by using a load balancer policy. In this scenario, the decision is not relevant for the end user, who does not have a technical background and just wants 6
Page 6 of 44
Ac ce p
te
d
M
an
us
cr
ip t
to start consuming the service as soon as possible. On the other hand, in BankFutura the same service is manually controlled by IT administration, with a deep knowledge of the runtime domain and an understating of the criticality of the service. Because of the same factors, deployment plans are instantly executed in HomeFutura, while they must be scheduled by the administrator in the banking organization, in order to provoke as less impact to the running services as possible. Clearly, the developed solutions for both domains did take into account all those specific concerns in order to decide upon the automation of the execution flow. However, neither the concerns, nor the rationale or decisions about it were made explicit in the complete documentation of the system. This information is vital to understand the design decisions which were taken over the process, inform system actors about its intended participation and guide the potential evolution of the SDCA from its current state. For instance, the question of which services can be executed in any application domain without any human intervention from the SOA manager of the SDCA is not answered in the documentation. Instead, the documentation only points out that the SDCA supports automatic service deployment, which could be interpreted as no human actors are required at all during the service deployment process, which is not the case. If we go to the domain-specific implementations, the SOA architect of the banking domain cannot find an answer for the question of which quality attributes have an impact on the degree of automation of the deployment process, as the link between quality attributes and service automation is missing from the documentation. Those documentation problems are common to most developments. In practice, the usefulness of architecture description is hardly recognized by stakeholders (or readers) because architecture description becomes easily outdated, inconsistent, contains either far too much information or too abstract to understand [24]. The software design is often documented due to organizational policies, without having in mind the expectation of readers. Whether the readers can understand and retrieve useful information from the documentation is often neglected. A potential solution to these problems is proposed in [25]; this work suggests to adopt expressive mechanisms to convey information to stakeholders, and apply them to document the information that is relevant to each stakeholder. This way, stakeholders are more motivated to read the architecture description, ultimately improving the usefulness of architecture description.
7
Page 7 of 44
Ac ce p
te
d
M
an
us
cr
ip t
3.2. Documenting software architecture Software systems must address the concerns raised by multiple stakeholders (e.g. architect, project manager and developer). These concerns must be supported and documented by the software architecture. A popular approach for documenting these concerns consists of following the separation of concerns principle, defining multiple architecture views [26]. Each view focuses on specific aspects of the system architecture, such as its structure [27], or the component data flow [28], and is used only by the relevant stakeholders. Architecture viewpoints provide the means to define and reuse views among multiple systems. Some well-known view models from industry include: Kruchten’s “4+1” View Model [29], Hofmeister’s view model [30], Software Engineering Institute (SEI) set of views [31], ISO Reference Model of Open Distributed Processing (RM-ODP) [32], Zachman Framework for enterprise architecture [33] and the viewpoint catalog collected by Eeles and Cripps [34]. Existing viewpoints address concerns that often appear in traditional software architectures. Recent software architecture styles (like SOA), bring additional specific concerns that challenge the reusability of the existing viewpoints. The lack of available views make practitioners face difficulties to find an effective way to illustrate any new characteristics introduced by these architecture styles. As a result, viewpoints enabling the illustration of specific concerns introduced by modern software architecture styles like SOA are needed. To our knowledge, none of the available viewpoints capture the concerns about service automation, leaving a gap to be filled. The usage of service automation viewpoints is twofold. On the one hand, the viewpoints frame a basic set of concerns that are commonly related to service automation. The identification of these concerns saves effort from architects and avoids the danger of overlooking them. On the other hand, service automation viewpoints comprise a set of conventions that facilitate the creation of architecture views illustrating all the information needed to address service automation related concerns. 4. Research approach With the aim of defining a set of viewpoints framing concerns commonly relevant to service automation, we followed an action research approach. Action research is an iterative research approach where the researcher actively 8
Page 8 of 44
Ac ce p
te
d
M
an
us
cr
ip t
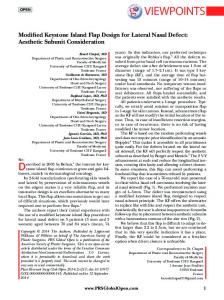
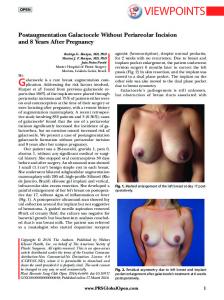
participates in the case studies that he/she performs [9]. The motivation for carrying out such an approach complies with what has been defined by Avison et al. [10], which is “try out a theory with practitioners in real situations, gain feedback from these experiences, modify the theory as a result of this theory and try it again”. In the context of this work, the theory is made of a set of viewpoints on service automation; the real situations refer to the industrial case studies that we carried out; and the result of the theory refers to a set of views on service automation that can be used for architecture description. Susman and Evered [9] described the action research process as a five phase, cyclical process. These five phases (see Figure 1) include: 1) diagnosing, 2) action planning, 3) action taking, 4) evaluating, and 5) specifying learning. Diagnosing refers to the identification of the primary problems. Action planning specifies actions that should be undertaken to solve these problems. These actions are then implemented in the action taking phase. The outcomes of the actions are evaluated in the evaluating phase. Lastly the knowledge gained in previous phases is collected in the specifying learning phase, which may serve as valuable input to the next cycle. We have followed the action research approach above with the goal of defining a set of reusable service automation viewpoints. We carried out three case studies (described in the following) in three associated action research cycles (see Figure 1): each cycle produced a set of views and viewpoints, which have been both challenged in the subsequent case study, and evaluated and refined to cross-check for consistency with the previous case study. The first case study was carried out with the UPM (Universidad Polit´ecnica de Madrid) team, which designed and implemented the SDCA. In Phase 1: Diagnosing, we studied the documentation of the SDCA and identified their needs for explicitly addressing concerns about service automation. In Phase 2: action planning, we identified a list of stakeholders that might have concerns relating to service automation and planned interview questions. In addition, we designed a view-driven approach for developing viewpoints, deriving them from diagrams that are confirmed by stakeholders. The main work has been carried out in Phase 3: action taking. There we first conducted interviews with the stakeholders of the SDCA with the aim of eliciting their concerns regarding service automation. From this set of concerns, we identified what information should be depicted in the diagrams to address these concerns. As some concerns might require the same type of information, analyzing this information helped us in reducing the number of 9
Page 9 of 44
5. Specifying learning
1. Diagnosing
Iteration 1 (SDCA)
Iteration 2 (BankFutura)
2. Action planning
4. Evaluating
4. Evaluating
3. Action taking
2. Action planning
3. Action taking
4. Evaluating
us
Forward
Iteration 3 (HomeFutura)
3. Action taking
1. Diagnosing
Feedback
an
Action research phase Legend
5. Specifying learning
1. Diagnosing
ip t
2. Action planning
5. Specifying learning
cr
1. Diagnosing
Figure 1: The research approach
Ac ce p
te
d
M
necessary diagrams. After we established what information should belong to each diagram, we created them, with special attention to stakeholder understandability. We then generalized the diagrams in an initial set of viewpoints on service automation (which is the theory of the action research approach). Using this initial set of viewpoints, we created a set of views for the SDCA. We brought back these views to the stakeholders with the question of whether these views were correct (content-wise) and aiding understanding of how the concerns relating to service automation had been addressed in the design. The feedback that we received from the stakeholders and domain experts enabled us to refine the views and viewpoints in Phase 4: evaluating to improve their expressiveness and completeness. After several iterations of interviews and refinements, we obtained a final set of viewpoints framing all the concerns that we have elicited. This set of viewpoints as well as the lessons that we learned in this action research cycle were valuable inputs for the next action research cycle. Our next case study (see Iteration 2 in Figure 1) was carried out with BankFutura, which applied the SDCA to their service configuration management. The phases that we took in this cycle were similar to the ones in the SDCA case study. The only difference was that at the end of the cycle of the BankFutura case study, we revisited the cycle of the SDCA case study to ensure that the viewpoints created in the BankFutura cycle could be successfully applied to the SDCA as well. The same applied to the third case 10
Page 10 of 44
ip t
study carried out with HomeFutura (Iteration 3). The viewpoints created in the HomeFutura case study were evaluated and refined again to fulfill the needs of both SDCA and BankFutura.
cr
5. 3D service automation viewpoints
Ac ce p
te
d
M
an
us
5.1. An overview of 3D service automation viewpoints To illustrate the aspects that are relevant to service automation in architecture design, we developed three service automation viewpoints. The ‘Degree of service automation’ viewpoint addresses the concerns about the achieved and potential degree of automation for each service. The ‘Decision on service automation’ viewpoint documents the reasoning behind the decided degrees of automation. The ‘Data relating to service automation’ viewpoint illustrates what information and actors are involved in the degrees of service automation. The 3D viewpoints are complementary, being relevant to different types of stakeholders and documenting different concerns [35, 36]. The degree viewpoint identifies what services form the SBA, and what is the degree of automation for each of them. This information is of great interest to all the stakeholders and thereby is exposed to the “public”. The remaining two viewpoints build upon that general information. The data viewpoint documents the data and actors that intervene over service execution automation. The decision viewpoint his information is enhanced by the remaining two views. Finally, the decision viewpoint provides to the “internal” design team (e.g.architects) the means for documenting and reusing the knowledge on automation decision making. The rationale for this viewpoint is influenced by the actors and policies from the data viewpoint and refers to the services and degrees illustrated by the degree viewpoint. 5.2. Documenting architecture viewpoints In the literature, there are multiple proposals for documenting viewpoints. Among them the template proposed by Hilliard [37] is in our opinion the most comprehensive one and, most importantly, reflects the requirements on viewpoints specified in ISO/IEC 42010) [38]. Therefore, we chose to use this template to document the 3D VP’s developed in this work. Table A.9 presents and describes the required items of the template. In the following, we shall present the description of the viewpoint ‘Decision on service automation’ (Sec. 5.4), ‘Degree of service automation (Sec. 5.5), 11
Page 11 of 44
ip t cr
Table 1: Summary of Hilliard’s template for documenting architecture viewpoints
Description Name of the viewpoint, and accepted synonyms. Brief overview of the viewpoints. The typical audience for views prepared using this viewpoint. List of the architecture-related concerns framed by this viewpoint. (op- Kinds of issues this viewpoint is not appropriate for.
an
M
d
Each type of model used by the viewpoint. Vocabulary used for constructing the view. The conceptual entities, their attributes and the relationships that comprise the vocabulary of a type of model. An existing notation or model language to be used for the model. The viewpoint may specify model correspondence rules. Methods which may be applied to views and their models. Examples for the reader. Any additional information. The sources for this viewpoint, if any, including author, history, literature references, prior art, etc.
te
Anti-Concerns tional) Model types Model languages Viewpoint metamodels (optional)
us
Template item Viewpoint Name Overview Typical stakeholders (optional) Concerns
Ac ce p
Conforming notation
Model correspondence rules Operations on views Examples Notes Sources
12
Page 12 of 44
cr
ip t
and ‘Data relating to service automation’ (Sec. 5.6) using the items of the template in Table A.9. For each of these viewpoints, we explain in detail its metamodel and conforming notation, which are the key elements to be used to create views, as well as an example view. To illustrate the application of the 3D VP’s, we take a fragment of the SDCA service flow as a running scenario, introduced in the following section. A formal definition of the elements introduced in the 3D VP’s is provided in Appendix A.
Resolve Unit
Obtain Possible Mappings
d
Select Unit
M
an
us
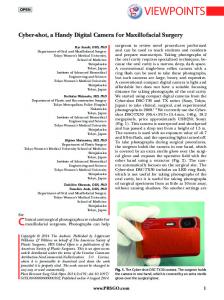
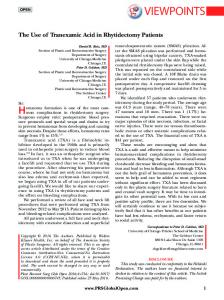
5.3. A fragment of the SDCA service flow - running scenario With the purpose of 1) showing how to construct views by applying the proposed 3D VP’s and 2) illustrating how the constructed views address the concerns framed by the 3D VP’s, we created three service automation views as examples based on a subset of the BankFutura SDCA service flow (introduced in Sec. 3.1). The subset of the SDCA service flow is presented in Figure 2 and shortly described as follows.
te
service
sequence
Map Units To Nodes
service
Ac ce p
Legend
Figure 2: A subset of the SDCA service flow
The deployment service Select Unit selects one unit among the available ones to be deployed in the environment. The selection criteria should be provided to the service as an external input. After that, the deployment service Resolve Unit is invoked, where the logical requirements of the deployment unit containing the service are analyzed, in order to find a closed set of units satisfying all their dependencies. There might be multiple candidate units satisfying one dependency (e.g. multiple units with minor, compatible versions) and for those cases a unit satisfaction criteria should be provided as an external input. Once the complete set of units that will participate in the operation has been identified, the deployment service Obtain Possible Mappings evaluates the available resources from the runtime containers (e.g. 13
Page 13 of 44
us
cr
ip t
application servers), and returns for each unit the potential nodes of the environment where those can be deployed. Having these nodes, the deployment service Map Units To Nodes decides on the final destination for each involved unit, according to external distribution criteria. The views created based on this scenario are used as examples in the description of the 3D VP’s. For a detailed description of the 3D service automation views, please refer to [39] where we report on the views created for the complete service flow for both BankFurtura and HomeFutura.
M
an
5.4. Viewpoint ‘Decision on service automation’ (Decision Viewpoint) SOA architects are often concerned with the justification of decisions on the degree of automation. The rationale behind the decisions as well as the decisions themselves are architectural knowledge valuable for organizations. A good representation of such knowledge aids the SOA architects in analyzing the design space and making optimized decisions [40]. It also enables the SOA architects to communicate their decision with the other stakeholders. The viewpoint ‘Decision on service automation’ is defined to serve this purpose. The description of the Decision Viewpoint is presented in Table 2.
Ac ce p
te
d
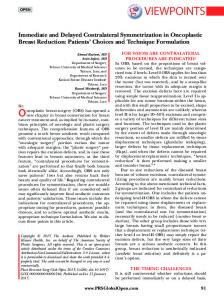
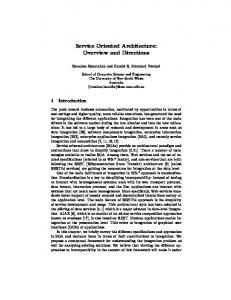
The metamodel of the Decision Viewpoint. The metamodel presented in Figure 3 illustrates the conceptual relationship between the constructs of the decision model, which includes services with a decided degree of automation, domain-specific factors and justifications for decisions. Each Service (see Figure 3) has a name and is designed to support a certain Degree of automation. The Degree of automation can be either Domain dependent or Domain independent, meaning that the degree of automation of a particular service differs when the service is applied in different application domains. Next to classifying degrees from the perspective of domain dependency, this viewpoint defines five degrees of automation from the perspective of human intervention): when a service does not require additional input during its execution, it is Fully automated as no human intervention is needed at all; when a service does require additional input and this input can only be provided by a human actor, it Has to be semi-automated and if it can only be provided by a policy, it Has to be policy-driven automated; when the service flexibility allows the input to be provided by a human actor or policies, the service is Either semi-automated or policy-driven automated; if the input is decided to be provided by a human actor, a service is Opt to be
14
Page 14 of 44
Table 2: Viewpoint ‘decision on service automation’ (Decision Viewpoint)
Viewpoint metamodels Conforming notation Model correspondence rules
ip t
cr
Ac ce p
te
d
Operations on views
us
Model types Model languages
an
Typical stakeholders Concerns
Description Decision on service automation viewpoint (Decision Viewpoint) The viewpoint deals with the links between domain-specific factors and the degree of automation that can be applied to each atomic service in a business process. SOA architects Justification of decisions on the degree of service automation SOA architects are concerned with what are the most appropriate decisions on the degree of service automation. Reconfigurability in terms of automation. SOA architects are concerned with what are the possible alternatives on the degree of service automation when requirements or constraints change. Service automation decision model (Decision model) This model is expressed in terms of these constructs: services, and domain-specific factors that influence or lead to the decisions on service automation, decisions that are relevant to service automation, and rationale for the decisions. The decision model can be illustrated by the graphical notation proposed below. See Figure 3 See Figure 4 All the services in the degree of service automation view should appear in this view. The decision on the degree of service automation of each service in this view should be correspondent to the degree of service automation of each service in the degree view. Creation methods: To create a decision view, first identify which domain-specific factors have an impact on the degrees of automation of the services and then link the architecture constraints with the services with the corresponding rationale. The rationale explains how each factor leads to a decision on the degree of service automation. Interpretive methods: In the decision view, the decision on automation is rendered by two attributes: domain-dependency and re-configurability. In particular, the border of ovals shows the domain dependency of the decision (a dashed line suggests that it is domain dependent, while a straight line suggests that it is domain independent). When applying the services to another application domain, this attribute highlights that domain independent services may keep the same degree of automation whereas domain dependent services have to be justified against the new domain-specific factors. Furthermore, the shadow of ellipses points out if an alternative degree of automation is possible and thereby the service can be re-configured if needed. Analysis methods: Model correspondence rules can help the SOA architects assess consistency with other views. The information presented in the decision view not only shows the current degree of automation but also guides future reconfigurations in the degree of automation. This is supported by two aspects of the view. First, the shadow reflects open degrees of automation with the current constraints. Second, the model provides traceability between the constraints and the affected services; hence the impact of those changes in the SBA will be clearly identified easing its analysis. See Figure 5 In principle, the rationale for fully automated services should explain why they do not need external inputs during their execution. The rationale for other degrees of services must motivate why external inputs are needed, why human actors have to provide it or why it is possible to define policies to assist the execution of services. If the degree of service automation is domain dependent, at least one domain constraint has to be linked to the service. -
M
Viewpoint item Viewpoint Name Overview
Examples Notes
Sources
15
Page 15 of 44
Fully automated Service
ip t
Name
Semi-automated Domain independent
executes with Degree of automation
Domain dependent
influences
Either semiautomated or policydriven automated
us
justifies
Scope
cr
Policy-driven automated
Rationale for a decision on automation
Opt for policydriven automated
based on
an
0..*
Opt for semiautomated
M
Domain specific factor
Figure 3: The metamodel of the Decision Viewpoint (in UML)
Ac ce p
te
d
semi-automated, whereas if the input is decided to be provided by a policy, a service is Opt to be policy-automated. The decision on the degree of automation is heavily influenced by Domainspecific factors, including non-functional requirements, business goals, architecture constraints, characteristics of the infrastructure, skills of the human actors, etc. These factors lead to a set of Rationale that justifies the decisions on automation for services. In addition, when a factor impacts a set of services, its rationale is linked to a Scope encasing all the services, and influences the decision on each affected service. Note that although services that Have to be semi-automated (or Have to be policy-driven automated) and Opt to be semi-automated (or Opt to be policydriven automated) are designed with the same degree of service automation, they are different from a decision making perspective. The former type of decision is a “has-to” decision in that only human actors (or policies) can provide the additional inputs and thereby no other choice can be made. The latter is an “opt for” decision in that both human actors and policies can provide the additional inputs and thereby the architect can make a selection between them based on the domain-specific factors of the system of interest. One could argue that the reasoning behind “has-to” or “opt-to” is often
16
Page 16 of 44
us
cr
ip t
embraced in the rationale and wonder why they are regarded as two different degrees of automation. Indeed, the rationale for decisions on service automation should explain what are the alternatives and what are the decisions and why. However, this explanation is usually descriptive and embedded in the text. By explicitly differentiating these two types of decisions and modeling them as first class entities, the expressiveness of the decision model is enhanced and directly facilitates (potential) future re-configuration and SBA evolution.
Ac ce p
te
d
M
an
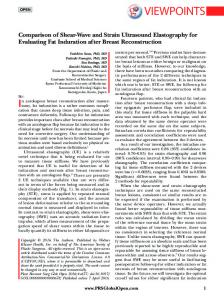
Conforming notation of the Decision Viewpoint. Figure 4 illustrates the graphical notation designed for creating decision models. Services are represented by ellipses; the three ones at left most of the figure represent three different degrees of service automation that have been decided. Moreover, they also imply that alternative degrees of service automation are not feasible or reasonable. The notations in the second column of the figure represent that a selection has been made or left open among alternative degrees of service automation. These services can be re-configured to an alternative degree of service automation if necessary. The two notations in the third column denote the dependency between a degree of service automation and a specific domain. The notations in the last column are used to illustrate the relation between decisions, domainspecific factors, and associated rationale, as well as the scope of services where architecture constraints may have an impact on. Has to be semiautomated
Has to be policydriven automated
Fully automated
Opt for semiautomated
Domain dependent
Opt for policy-driven automated
Domain independent
justifies Rationale leads to Domain specific factors
Either semiautomated or policydriven automated
Scope
Figure 4: Conforming notation of the Decision Viewpoint
An example of decision view. An example of the decision view created for BankFutura (based on the service flow described in Sec. 5.3) is presented 17
Page 17 of 44
Ac ce p
te
d
M
an
us
cr
ip t
in Figure 5. This example documents the decisions taken on the degree of service automation. In the following, we shall explain how this decision view addresses the concerns (see Table 2) framed by the Decision Viewpoint. The concern about justification of decisions on the degree of automation is addressed by modeling the rationale in the decision view, explaining whether external inputs are required during the execution of services and (if so) motivating whether such inputs can be obtained automatically or need to be given by human actors. For instance, as shown in Figure 5 service Obtain Possible Mappings does not require any additional decisions or parameters during its execution and thereby is fully automated. In turn, service Map Units To Nodes requires distribution criteria as an external input during its execution. As explained by the attached rationale, Map Units To Nodes is decided to be semi-automated since control of distribution criteria is more feasible if manually performed by a deployer in BankFutura. Moreover, justification of decisions on the degree of automation is also addressed by domain-specific factors. For instance, in Figure 5 the quality attribute “security” (at bottom left corner of the figure) impacts all services, as indicated by its link through the rationale to the scope (the big rectangle in Figure 5), implying that critical activities should be manually controlled if possible (explained by the attached rationale). Next to security, human actor is another domain-specific factor that has an impact on the degree of service automation. In BankFutura, as a banking deployer handling deployment tasks is available and has the ability to manually control certain critical activities, it is possible to dedicate some critical deployment tasks to this human actor if needed. Another concern framed by the Decision Viewpoint is reconfigurability in terms of automation. This concern is addressed by “opt to be” services, identified in the view with the shadows of the ovals, as it is shown in Figure 5. For these services, the decisions on their degrees of automation could change if the domain-specific factors change. For instance, since Select Unit carries out critical activities and any mistakes would lead to unstable deployment configurations, BankFutura opts for semi-automating this service. However, suppose the quality requirements were not stability and criticality but agility or flexibility, the architect could decide to automate Select Unit by means of policies rather than requiring a human actor to make the selection.
18
Page 18 of 44
ip t Quality attributes
Banking deployer
Security
Stability Criticality
Ac ce p
Scope
te
Human actor
Quality attributes
Banking services are developed and provided internally according to internal regulations. Since the dependency resolution activity is simpler and predictible, unit satisfaction criteria can be formalized as policies and hence it is decided to automate this service.
Domain dependent service, decided to be semi-automated
Service
Name: Credit concession service Developed by: IT department internal to BankFutura
Legend
Rationale
Map Units to Nodes
The mapping activity must take into account the specific objectives and guidelines behind the definition of the environment topology. Although such objectives as distribution criteria could be derived and defined in formal models, there is a significant cost in capturing that knowledge, as well as a big impact for any divergence between the original guidelines and the formalized knowledge. Therefore, it is decided that the banking deployer should control the mapping process.
Environment Topology: Pre-defined
Domain dependent service, decided to be policy-driven automated
Domain independent service, fully automated
justifies
justifies
leads to
This service analyzes the elements from the logical graph and the runtime nodes and identifies all the possible physical mappings for the participating services. There is no decision or additional parameter required, thus it is completely automated.
an
Automatic unit selection implies allowing the deployment system dynamically reacts on changes, which may result in unexpected errors and unstable configuration. Although section criteria can be technically formalized , it is decided that the selection is made by a human actor .
M
The human actors are familiar with the domain knowledge and have technical expertise. Therefore, they are capable of making technical decisions over the deployment process, and critical activities can be manually controlled
d
The system has a restricted access for each type of operation. It is required that the operations that take place at each step can be traced and responsibility can be assigned to staff members. Therefore, critical activities should be manually controlled.
Obtain Possible Mappings
cr
Resolve Unit
Select Unit
us
Scope
Quality attributes
Rationale
leads to
Quality attributes
Figure 5: An example of decision view
19
Page 19 of 44
us
cr
ip t
5.5. Viewpoint ‘Degree of service automation’ (Degree Viewpoint) Since services are the building blocks of SBAs, the degrees of automation of individual services directly determine the degree of automation of the whole SBA. An overview of the extent to which each service of a SBA can be executed without human-intervention is not only of great interest to managers who are responsible for resource allocation and planning but also for human actors who participate during the execution of services. The Degree Viewpoint is developed to address concerns of these two types of stakeholders. The description of the Degree Viewpoint is presented in Table 3.
0..1
Service
Ac ce p
Name
te
executes after
d
M
an
The metamodel of the Degree Viewpoint. The relationship between the constructs of the decision on service automation model is presented in Figure 6. Each Service has a name and is designed with a Degree of automation. There are three basic degrees of service automation: Fully automated (i.e. no Additional input is required), Semi-automated (i.e., a Human actor provides the Additional input required by services), and Policy-driven automated (i.e., services retrieve required Additional input from Policies). A hybrid degree reflects that the service is Either semi-automated or policy-driven automated. Each service can be linked to another service with an execution sequence.
executes with Degree of automation
Additional input
Fully automated
requires
Either semi-automated or policy-driven automated Semi automated Policy-driven automated
requires
provides
provides
Human actor
Policy
requires
Figure 6: The metamodel of the Degree Viewpoint (in UML)
The conforming notation of the Degree Viewpoint. As denoted by the graphical notation presented in Figure 7, the degrees of automation are graphically rendered by the darkness of the color assigned to each service: the darker the 20
Page 20 of 44
Table 3: Viewpoint ‘Degree of service automation’ (Degree Viewpoint)
Viewpoint metamodels Conforming notation Model correspondence rules
ip t
cr
Ac ce p
te
d
Operations on views
us
Model types Model languages
an
Typical stakeholders Concerns
Description Degree of service automation viewpoint (Degree Viewpoint) The viewpoint shows the degrees of automation services are designed for and whether each service can be automated or not. If human intervention is required, the Degree Viewpoint highlights which actors should participate during the execution of services. Human actors and managers Degree of service automation Managers are concerned with the degree of automation that the services are expected to achieve. Accountability Human actors are concerned with which services can be executed automatically and which services require intervention from human actors. Accountability. Managers are concerned with the trace of responsibility of human actors for providing input to services that are not fully automated. Degree of service automation model (Degree model) The degree of service automation model is expressed in terms of these constructs: services with different degrees of automation, human actors that are required during the execution of services. This model can be illustrated by the graphical notation proposed below. See Figure 6 See Figure 7 Services as well as their degrees of automation should be correspondent to the data model of the data view and the automation decision view. Human actors should be correspondent to the data model of the data view. Creation methods: a degree view can be created by retrieving the decided degrees of automation for services (from the decision view) and adding that information to the sequence of participating services. Interpretive methods: the degree of automation is illustrated by means of the darkness of the color. The darker the color, the higher degree of automation it represents. The reader of this view may capture how many levels of automation the services are designed for. The sequence between the services highlights the interaction between services and the variation in the degrees of automation, which can point to bottlenecks in the complete service execution flow. Analysis methods: model correspondence rules can help the SOA architects assess consistency with other views. The degree model not only provides a holistic overview on the degree of service automation designed for each service, but also provides guidance on detecting possible bottlenecks during the service execution flow. In principle, each semi-automated service could introduce a bottleneck when the corresponding human actor does not provide required information in time. Implementation methods: services with different degrees of automation should be provided with different interfaces dealing with different types of input/output sources. See Figure 8 The degree view is meant to show the designed degree of automation of services, whether a service has to be or opt to certain degree of automation is irrelevant to the stakeholders that are interested in this view. A service in the decision view that either has to be semi-automated and opt to be semi-automated requires inputs directly from human actors, and therefore correspondent to semi-automated services. The same applies for policy-driven automated services. The Degree Viewpoint is derived both from UML use case diagrams and Business Possess Modeling Notation (BPMN), both of which describe a set of actions carried out by a list of actors. Similar with use case diagrams, horizontal ellipses are used in the Degree Viewpoint to represent atomic services and actors are directly linked to services. Similar with BPMN, arrow lines are used to denote sequences between two services. On top of that, we add colors to ellipses to represent services with different degrees of automation. This visualization technique helps (in particular) non-technical stakeholders in capturing the degree of automation designed for the services.
M
Viewpoint item Viewpoint Name Overview
Examples Notes
Sources
21
Page 21 of 44
us
cr
ip t
color, the higher the degree of automation. In addition, human actors can be associated to semi-automated services with the purpose of highlighting who are expected to provide input to which services (see association provides input to). The sequence between services indicates the order in which the deployment services are invoked (see association executes after). With this additional information, the period during which human intervention is (and is not) required becomes explicit. By illustrating that external inputs are expected to be provided by whom and when, this view also addresses the accountability concern. Either semiautomated or policydriven automated
an
Human Actor
provides input to
Policy-driven automated service
M
Semi-automated service sequence
d
Fully automated service
te
Figure 7: The conforming notation of the Degree Viewpoint
Ac ce p
An example of degree view. An example of the degree view created for BankFutura (based on the service flow described in Sec. 5.3) is presented in Figure 8. Corresponding to the example of decision view (presented in Figure 5), this example shows the decided degree of automation for each service. In the following, we shall explain how this degree view addresses the concerns (see Table 3) framed by the Degree Viewpoint. The concern about degree of service automation is directly reflected at the metamodel, and is graphically depicted by different shades of color blue. By looking at Figure 5, one can easily understand that three different degrees of automation have been designed for the four services, among which two services require human intervention. Furthermore, the vertical positioning of the services depending on their degree of automation improves its graphical expressiveness, simplifying its comprehension. The concern about accountability is addressed mainly by the association of the human actor with the semi-automated services. More specifically, services Select Unit and Map Units To Nodes are directly linked to a banking 22
Page 22 of 44
Semiautomated service
Select Unit
Map Units To Nodes
Human actor provides input to
sequence
Obtain Possible Mappings
sequence
us
Legend
Fully automated service
cr
Policy-driven automated service
Resolve Unit
ip t
Banking deployer
Figure 8: An example of degree view
M
an
deployer, indicating that this human actor should provide required information during their execution. For the banking deployer, it is obvious to see when he or she should be available to perform certain tasks and which services are particularly relevant to them in the service flow. For the manager, the degree view facilitates service management in that potential bottlenecks (e.g. waiting for human inputs) can be detected.
Ac ce p
te
d
5.6. Viewpoint ’Data relating to service automation’ (Data Viewpoint) Whenever the execution of a service cannot be completely automated, during execution it requires certain data, which must be provided by external sources. In order to facilitate the execution of the service, it is important to know what kind of data is missing and how to provide such data. These questions are often the concerns of human actors (e.g. when to input what data to which services), architects (e.g. how to ensure the input data is understood by services) and managers (e.g. the alignment between input data with organizational regulations or goals). The Data Viewpoint is developed to frame these concerns and its description is presented in Table 4.
The metamodel of the Data Viewpoint. The relationship between the constructs of the data flow model and policy model is presented in Figure 9. Each Service designed to support a certain Degree of automation has a name and can be linked to another service with a sequence flow. Services that are Either semi-automated or policy-driven automated require Additional input: a Policy-driven automated service requires Policy input while a Semiautomated service requires Human input provided by a Human actor. These additional inputs are guided by associated Policies: policies guiding Human 23
Page 23 of 44
Table 4: Viewpoint ’Data relating to service automation’ (Data Viewpoint)
Viewpoint metamodels Conforming notation Model correspondence rules
an
M
Ac ce p
Operations on views
d
Model languages
te
Model types
us
cr
Typical stakeholders Concerns
Description Data relating to service automation viewpoint (Data Viewpoint) The Data Viewpoint focuses on the generation, retrieval, processing, and organizing of data that are relevant to the support of different degrees of service automation. Human actors, SOA architects, and managers The specification of policies SOA architects are concerned with the format in which policies should be defined so that human actors can easily understand them and services can automatically process them. Managers are concerned with what policies have to be in place before the services are ready in execution and who controls them. Compliance with organizational regulations Managers are concerned with whether the external inputs provided to non-completely automated services comply with organizational regulations or goals. Human participation. Human actors are concerned with what information needs to be provided to the services, how to provide correctly the information and when it should be provided. Automation-related policy model (policy model) captures the organizational-level policies that are required during the execution of services. Automation-related data flow model (data flow model) captures the policies and human input that the services will require during their execution. In addition, it captures how the services will enforce those policies and how human input interacts with the services. Policy model: policies can be described in terms of their name, description, the associated service and their format. These elements can be captured in a table. Data flow model: it is expressed in terms of these constructs: policies, human input, actors and services. The data flow model can be illustrated by graphical notation proposed below. See Figure 9; For data flow model see Figure 10; for policy model see Table 5 Services as well as their degrees of automation should be correspondent to the data model of the data view and the automation decision view. Human actors should be correspondent to the data model of the data view. Creation methods: Create a data flow model before a policy model. To create a data flow model, first analyze what external information requires each noncompletely automated service. Next, decide which policies are required for guiding human actors and assisting policy-driven automated services. To create a policy model, first record all the policies in the data flow model. Then define each policy in terms of its name, description, controller and format. Interpretive methods: In the data flow model, the graphical color scheme applied to the degree of automation is also applied to the corresponding polices. Policies illustrated in dark color directly assist the execution of policy-driven automated services; while policies illustrated in light color guide the human actors to provide information to the semi-automated services. In the policy model, the reader may obtain an overview of each system policy related to automation. Analysis methods: Model correspondence rules can help the SOA architects assess consistency with other views. As services that are not fully automated require additional information during their execution, it is important that this additional information is illustrated in this view. Implementation methods: The policy model describes important information about the policies, such as the format of definition, which can guide the implementation of the policy-driven automated services. In a similar way, defining the required information for semi-automated services, and identifying the participating actors for each one, will also guide their implementation. For data flow model see Figure 11; for policy model see Table 6
ip t
Viewpoint item Viewpoint Name Overview
Examples Notes Sources
24
Page 24 of 44
executes after
0..1
Service
Policy-driven automated
requires
Either semiautomated or policy-driven automated
Degree of automation Semiautomated
provides
Additional input
M
executes with
Policy input
an
Name
us
cr
ip t
inputs are often Guidelines or rules that are less structured; whereas Policies accessed directly by services have to be machine readable and thereby documented in a more structured way (Formalized policy). Each Policy has an ID, a name and a description. It is associated to a service that is either Semi-automated or Policy-driven automated with the purpose of assisting their execution. The assigned Human actor controls the Policy, ensuring that its content complies with organizational or architectural goal and that its format is aligned with the requirements of the architect. Each policy is specified in a certain format, defined by the architect.
requires
Policy Name ID Description
Guideline or rule
Human input
controlled by
guides provides
Human actor
te
d
Fully automated
Formalized policy
Ac ce p
Figure 9: The metamodel for the automation-related data flow model (in UML)
Conforming notation of the Data Viewpoint. The data flow model can be constructed using the graphical notation presented in Figure 10. Besides the notation for the three basic degrees of service automation, we distinguish the guidelines/rules from formalized policies. While both guidelines/rules and formalized policies are relevant to service automation, the former are used by the human actors to drive the decision and the latter are directly accessed by deployment services to achieve policy-driven automation. The leftmost side of Figure 10 shows the graphical notation denoting the relationships between the elements related to policy-driven automated services. A formalized policy directly assists the execution of a policy-driven automated service by providing the data that it needs. The middle part of Figure 10 shows the graphical notation denoting the relationships between the elements related to semi-automated services. More specifically, a human actor is responsible for providing a type of information that is required by 25
Page 25 of 44
provides
guides
Policy input
Human Input
Fully automated service Additional input Human actor provides
cr
Guidelines or rules
Either semiautomated or policydriven automated
us
Formalized policy
ip t
a semi-automated service. For this purpose, the human actor is guided by certain guidelines or rules.
assist the execution of assist the execution of
Semi-automated service
an
sequence
Policy-driven automated service
M
Figure 10: The notation for the data relating to service automation model
Ac ce p
te
d
Given these details on the relationships between policies, human actors, and services, the human actors can tell which services are expecting what information from them. Moreover, it explicitly points out which organizational guidelines or rules should this information comply with. This way, the deployment actors can be prepared to transform this organizational knowledge to their input to services, hence facilitating human participation. The policy model can be constructed in terms of a table, listing the policies that are relevant to service automation. The template for such a table is shown in Table 5. This table aids the specification of policies in presenting all the information relevant to the policies in a structured manner. As such, this table also aids the preparation of the policies. Table 5: The template for automation-related policy table
Policy ID
Policy name
Policy Description
Associated service
Controlled by
Type of format
Model correspondence rules. Each policy in the automation-related policy model should be linked to a service, which should appear in each of the other views. Each policy in the automation-related data flow model should be linked to the policies specified in the automation-related policies model. 26
Page 26 of 44
Identification of the desired service
Unit distribution policy: optimize performance, ensure reliability
Unit selection policy: latest version
Selection among the possible candidate units
Identification of satisfactory units
guides
Human Input
provides
assist the execution of
Formalized policy Human actor
provides
Additional input
Policy input
assist the execution of
Semiautomated service sequence
te
d
Banking deployer
Select Unit
Guidelines or rules
M
System Requirements
an
us
cr
ip t
An example of data view. A data view consists of two models, a data model and a policy model. An example of the former is presented in Figure 11 and the latter in Table 6. In the following, we shall explain how this data view addresses the concerns (see Table 4) framed by the Data Viewpoint. The concern about human participation is mainly addressed by the data model. Corresponding to the degree view (presented in Figure 8), the data model shows in detail that the two semi-automated services Select Unit and Map Units To Nodes require information about Identification of the desired service and Selection among the possible candidate units respectively during their execution. The bank deployer can see from the data model that he or she is required to provide these two pieces of information; and to do so he or she is guided by System Requirements and Unit distribution policy.
Map Units To Nodes
Policy-driven automated service sequence
Resolve Unit
Ac ce p
Obtain Possible Mappings
Legend
Fully automated service
Figure 11: An example of data model
An example of the policy model is shown in Table 6, listing all the policies appearing in the data model given in Figure 11. This model mainly addresses the concern about the specification of policies. For instance, since System Requirements and Unit distribution policy are used by a human actor, they are constructed in textual documents. Whereas Unit selection policy is directly accessed by the policy-driven automated service Resolve Unit, thereby it is created under machine readable formats. The concern about compliance with organizational regulations is addressed by both the data model and policy model. In the data model, each required external input is linked to a policy implying that such input should conform 27
Page 27 of 44
Table 6: An example of policy model System requirements
Describes the business processes that must be supported by the environment Selects the unit with the most recent version among the potential candidates Defines the rationale behind the environment definition and the quality levels to be sustained by the deployed services
Unit selection policy: Latest version
PB03
Unit distribution policy
Controlled by Managers
Resolve Unit
SOA tects
Map Units To Nodes
SOA tect
Archi-
Type of format Textual ment
Docu-
Formal/SQL Sorting Query
Archi-
Textual Environment design / SLA Document
an
PB02
Associated service Select Unit
ip t
Policy Description
cr
Policy name
us
Policy ID PB01
Ac ce p
te
d
M
to the policy. In particular, when the external inputs are given by human actors (like identification of the desired service provided by the banking deployer as shown in Figure 11), it is of critical important to the manager to have certain control over these inputs. Since the links between external inputs and policies become explicit in the data model, the manager of BankFutura understands better which policies will be used for providing the required inputs. Complementarily, the policy model (presented in Table 6) shows the specification of the policies in detail. In particular, it shows the stakeholders who are responsible for maintaining the policies. The manager could use this information to govern the validity of the policies. 5.7. Summary In summary, the degree view can be regarded as the core of the three service automation views, which can serve as a “central view”. The basic elements of the degree view, a set of services with different degree of automation (ellipses marked with different colors), are also part of the other two service automation views. Thereby, we can see the decision view and data view as two views with different levels of abstraction. More specifically, the decision view is a refinement of the degree view by adding rationale for the decision on the degree of automation; and the data view is also a refinement of the degree view in that it adds information about policies and human inputs that assist the execution of services. As such, the three views have vertical relations, meaning they relate at different levels of abstraction.
28
Page 28 of 44
6. Discussion
Ac ce p
te
d
M
an
us
cr
ip t
6.1. The visual support of the 3D service automation viewpoints In [41], David Harel reflects on his early work on Statecharts, and observed: “One of the most interesting aspects of this story is the fact that the work was not done in an academic tower, inventing something and trying to push it down the throats of real-world engineers. It was done by going into the lions den, working with the people in industry. [. . . ] If what you come up with does not jibe with how they think, they will not use it. Its that simple.” Our approach is similar. We worked together with architects to identify their visualization requirements for architectural views. Architects use views for two main purposes [42], reasoning and communication with other stakeholders. In both cases, one fundamental factor for the usefulness of a certain viewpoint is in providing the right visual notation to present the needed information. Visualization is a common technique to convey abstract information in intuitive ways [43]. Representing information in terms of (a set of) graphics often more easily draws readers’ attention and improves understandability, as compared to pieces of text [44]. From our experience, the range of stakeholders involved in services engineering includes a broader range of expertise’s than in the development of traditional applications, which further reinforces the need to achieve an effective communication between the stakeholders through the usage of visualization techniques. Software architecture practitioners have developed several well-accepted diagram notations for documenting the systems, such as the UML (Unified Modeling Language) [45] or the BPMN (Business Process Modeling Notation) [46]. Although they do not capture exactly the information involved in the automation concerns, they do provide a way of representing concepts such as service execution flow, or representing the actors which interact with the system. However, these existing diagrams can be difficult to understand, limiting their usefulness for reasoning with non-technical stakeholders (such as end users or business managers), and for effective communication. Therefore, these well-accepted notations can constitute the base of the proposed viewpoints, but should be adapted to intuitively represent all the elements surrounding these concerns and their relationships, using a notation easily understandable for non-technical readers. Visual support of viewpoints has been identified in Sec. 3.2 as a fundamental characteristic for their usefulness. In this section we describe how 29
Page 29 of 44
Ac ce p
te
d
M
an
us
cr
ip t
we have consciously designed the graphical notation of the 3D VP’s to make the corresponding views intuitively understandable and to hold readers attention steady. To this aim, we followed some well-known design principles in information- and software visualization [44, 43]. First of all, we used color tones in the graphical notation, with different shades of color blue, for representing the different degrees of service automation. The motivation behind this scheme is that according to human perception, dark colored objects often feel heavier in weight (tending to sink), whereas light colored objects feel lighter (tending to float). This way, the color tone renders graphically the degree of automation of each service: the darker the color, the higher the degree of automation. This representation resembles an iceberg immersed in the sea, with the human actors looking at the surface: only the top (white is the lightest color) is visible (i.e. human actor gets access to the service and manually participates in its execution), while the deeper the iceberg is sunk in water, the lesser accessible it becomes (i.e. increasingly automated). The graphical notation for policies inherits the same color scheme. As shown in Figure 10, policies guiding human actors are light colored; whereas policies assisting the execution of policy-driven automated services are dark colored. In this way, just from the color of the policies the reader can perceive the correspondence between the degree of service automation and policies. These visualization techniques should enable the views becoming selfexplaining. Second, in addition to color selection, we also carefully chose the shapes of the graphical notation. In service automation views, services are the core objects whereas other elements such as policies or human actors are auxiliary information. Moreover, services most likely appear in other views than 3D service automation views as well. For these reasons, we see the need to graphically differentiate services from the other elements. We used ellipses to denote services (as in SoaML [47]), and boxes to represent other elements. Third, to help the reader focus on the main message that a 3D view intends to convey, we positioned the elements supporting such main message in the center of the view. For instance, when looking at a decision view like Figure 5, the reader’s attention is naturally brought to the layer of rationale that justifies service automation decisions. In the data view (see Fig 11), since the data required during the execution of services is positioned in the middle, the reader naturally pays attention to data-related issues, such as which service requires such data and where the service can obtain this data, 30
Page 30 of 44
M
an
us
cr
ip t
helping the main purpose of this view. Finally, to make the conforming views easy to understand and self-explaining, we reused known notations and concepts from UML and BPMN to represent common concepts in the architecture description. For instance, we used a person symbol to represent a human actor, and a document symbol to represent a policy. Relationships also use a familiar notation: for instance, a line with arrow denotes the invocation sequence between to services, and a line connecting a human actor and a service denotes the interaction between them. In summary, the graphical notation defined in the 3D VP’s has been carefully designed in order to maximize the expressiveness of the conforming views. The notation’s ease of understanding simplifies both the creation and interpretation of conforming views. As such, the 3D VP’s facilitate the communication between stakeholders, especially the ones lacking technical expertise.
Ac ce p
te
d
6.2. The applicability of the 3D VP’s To validate our goal of supporting reusability and applicability of the 3D VP’s across different domains, we carried out a fourth study in a totally different context, namely an education environment. In a SOA design Master course given in our university, 11 groups of 3 Master students each were asked to design a SOA e-Health system (its functional and non-functional requirements are described in [48]) using the 3D VP’s in their architecture descriptions. As the e-Health system consisted of many business processes, the students were allowed to select one process to illustrate its automation aspect. Some examples of the selected process are diagnosis, medical device reservation, and pharmacy management. During this course, we asked the students to first identify concerns related to service automation in the e-Health system, and then use the 3D VP’s to illustrate these concerns. In this way, we could possibly obtain some concerns that we might have overlooked in our case studies but should be framed because of their relevance. The results show that the concerns identified by the students were either specific to E-health system or domain-independent. In both cases, we could successfully map them to the set of concerns already framed in 3D VP’s in a straightforward way. In summary, in spite of the clearly different application domain of the e-Health system (as compared to the SDCA), the students could directly apply the 3D VP’s to illustrate the service automation aspects in their design. 31
Page 31 of 44
ip t
Moreover, the students provided very positive feedback on the use of the 3D VP’s and their expressiveness. Although not conclusive, these results provide us with further positive indication of the applicability of the 3D VP’s to SBAs in general.
cr
7. Conclusion
Ac ce p
te
d
M
an
us
SOA has been widely adopted in industry. One of the reasons for this adoption is its ability to dynamically respond to business changes. To maximize this ability, SBAs should have a certain degree of automation and minimize the intervention of human actors. As SBA consist of services that are distributed and owned by different business parties, the lack of control over services poses additional concerns in service-oriented design. In this work, we identify service automation as a service aspect that is specifically relevant to SBAs and thereby should be explicitly documented in architecture description. The 3D viewpoints contribute to address the top three SOSE challenges reported in [49]: quality, service and data. The decision view addressed quality-based decision making, as it illustrates the trade-off between the degree of automation services can achieve and other quality requirements such as reliability, security, agility, and flexibility. Second, the 3D viewpoints focus on service autonomy, therefore contributing to also contribute to the support of one property of “good” services. Finally, the data view frames some data provenance concerns of SBAs. More specifically, it illustrates the creation, processing, and management of the data relevant to service automation (including policy guidelines and programmatic policies). The study of the SDCA and its two industrial applications motivated us to develop viewpoints to address service automation concerns. This study also provided us with a source from where we could elicit concerns, model corresponding designs and verify the correctness and expressiveness of the models. Using the action research approach, we developed the 3D VP’s presented here, framing the concerns relating to automating the execution of services for coordinately accomplishing a specific (business or engineering) task. So far, the 3D VP’s have been used to illustrate the service automation aspect of the SDCA and its two industrial applications, as well as the e-Health system designed by the Master students. During these studies, we noticed that the decisions on service automation were influenced by a common set 32
Page 32 of 44
cr
ip t
of domain-specific factors, including quality attributes, human actors, characteristics of services or infrastructure. In our future work, we plan to gain more insight into the link between these factors and the degree of service automation. As such, this link could serve as a list of guidelines for service automation decision making. Acknowledgments
Ac ce p
te
d
M
an
us
We would like to thank the Editors for their invaluable support during the whole review process. Special thanks go to Femke van Raamsdonk (Theoretical Computer Science at the VU University Amsterdam) for her help in revising the formal specification of the 3D Viewpoints).
33
Page 33 of 44
Appendix A. Formal definitions of the 3D Viewpoint elements
d
M
an
us
cr
ip t
This appendix provides a formal definition of the elements from the three automation viewpoints using set theory and first order logic expressions. The three viewpoints on service automation capture complementary information related to a specific automation context AC of the SBA. AC is defined as a tuple that contains five sets of elements relevant for the automation of an SBA: AC =< Service, F actor, Input, P rovider, Rationale >. Set Service contains the service executions that participate in the specific SBA scenario. F actor is the set of domain-specific factors that are relevant for the decision on the degrees of automation of the automation context services. Set Input contains the additional input elements that are required by the services to execute correctly. Those input elements are provided by the members of set P rovider, which includes the elements external to the services that can provide additional input. Finally, the elements from set Rationale capture the rationale on each specific decision about the degree of automation of each service from the AC. The following gives further details about the elements from these sets and their relations. We also include a reference table for each viewpoint that summarizes the metamodel elements and the corresponding definitions.
Ac ce p
te
Appendix A.1. Definitions related to Degree AC captures the automation information about a SBA scenario. On the elements in Service we defined a partial binary relation, denoted executesAf ter, which gives the order in which services are sequentially executed. If s2 executesAf ter s1 then s2 is executed after s1. It is possible that two services are not related via executesAf ter. In this case, s3 might be executed after s1 without having an executesAf ter relation between s2 and s3. This means that it is irrelevant for the SBA which service between s2 and s3 is executed after. The automation context also contains a set of domain-specific factors f ∈ F actor. A domain-specific factor f represents a characteristic of the context that is relevant for automation. The function DomainSpecif ic : AC → Boolean represents whether the degrees of automation of the AC services depend or not on domain-specific factors. The function is evaluated as follows: DomainSpecif ic(ac) = true, if |F actor| > 0. This means that if the context has some domain-specific characteristics then it is domainspecific, too. 34
Page 34 of 44
M
an
us
cr
ip t
A service executes with a degree of automation extracted from the following set Degree = {F ully, P olicyDriven, Semi}. The Fully automated degree is a completely automated execution without any need for external intervention. A PolicyDriven automated execution requires external input that can be provided beforehand, and Semi-automated execution requires the intervention of an external actor. Each service s, depending on its technical characteristics, can potentially execute with multiple degrees of automation. The potential range of degrees of automation for each individual service s is defined by function options : Service → ℘(Degree), where ℘ denotes the superset of a set. The automation possibilities for each service depend on its nature and the underlying design, with the restriction that |options(s)| ≥ 1. Each service s can have a decision on its degree of automation execution. The services that have a decided degree are represented by the subset decided = {s ∈ Service, |options(s)| = 1 ∨ DomainSpecif ic(AC)}. The decisions are represented by the partial function decision : decided → Degree. A decision for a service s is one among the set of possible options for that service, i.e. the decision corresponds to the decided option.
Ac ce p
te
d
Appendix A.2. Definitions related to the Data viewpoint Set Input from the AC contains all the additional input elements that are required by the services to execute correctly. Depending on the origin of the additional input, this set can be partitioned into two subsets, HumanInput and PolicyInput. Elements of HumanInput are provided by human actors, while elements of PolicyInput are generated by an automated policy. Several services from the AC require additional input to perform their execution. They are identified by subset depServices = {s ∈ Service|decision(s) ∈ {Semi, P olicyDriven}}. The partial function inputF or : depServices → Input maps the services that require additional input with the Input elements. The value of function inputFor satisfies the following: • if decision(s) = Semi, then inputF or(s) ∈ HumanInput; • if decision(s) = P olicyDriven, then inputF or(s) ∈ P olicyInput.
AC also contains the set of elements that provide additional information p ∈ P rovider. This set is partitioned into two subsets depending on the nature of the provider, HumanActor and Policy. Elements from subset HumanActor are human stakeholders that participate in the AC, while elements 35
Page 35 of 44
cr
ip t
from Policy are documents and artifacts that provide automation information. Policy is further partitioned into subsets FormalPolicy and Guideline. Elements of FormalPolicy provide additional input to a service execution. To this aim, they are defined in policy languages that are interpretable automatically by the services. Elements of Guideline are documents that guide a human actor in the process of providing the required additional input to a service. The function providerF or : Input → P rovider satisfies the following:
us
• if hi ∈ HumanInput, then providerF or(hi) ∈ HumanActor; • if pi ∈ P olicyInput, thenproviderF or(pi) ∈ F ormalP olicy.
d
M
an
The only elements from set Provider that do not directly provide input are element of Guideline. Their role is to guide human actors on providing the additional Input to semi-automated services. These actors are identified as follows: humanP roviders = {ha ∈ HumanActors|∃s ∈ decided : decision(s) = Semi ∧ providerF or(inputF or(s)) = ha}. Finally, each Policy element is maintained by a human actor. The function responsibleF or : P olicy → HumanActor provides a reference to the human actor that maintains the Policy element.
Ac ce p
te
Appendix A.3. Definitions related to the Decision viewpoint The final set of elements that constitute the automation context is the Rationale. Each element r ∈ Rationale contains the argumentation for a decision on the degree of automation of a service. The partial function basedOn : Rationale → ℘(F actor) provides the basis for each Rationale. The predicate function domainSpecific on set Rationale evaluates to true if r belongs to the domain of definition of basedOn. This reflects whether or not the rationale for a decision is influenced by domain-specific factors. Set Rationale is partitioned into two sets depending on the scope of their influence on the automation decisions: individualRationale and globalRationale. Elements of individualRationale affect the decision for specific services, whereas elements of globalRationale affect every automation decision. This is expressed by the following function: justif ies : Rationale → Service ∪ {Service}, with: • justif ies(r) = s ∈ Service if r ∈ individualRationale • justif ies(r) = Service if r ∈ globalRationale 36
Page 36 of 44
M
an
us
cr
ip t
Table A.7: Degree Viewpoint metamodel equivalences Metamodel element Equivalent Definition s instance of Service s ∈ Service i instance of Additional Input i ∈ Input h instance of Human Actor h ∈ HumanActor p instance of Policy p ∈ P olicy Service s1 executes after s2 executesAfter(s1,s2) relation Service s executes with Degree of automation d d = decision(s) Service s executes Fully automated decision(s) = Fully Service s executes either semiautomated or policy- options(s) = {Semi, P olicyDriven} ∧ driven decision(s) is not defined Service s requires Additional Input i i = inputFor(s) Service s executes Semi-automated decision(s) = Semi Human actor h provides Additional input i h=providerFor(i) Semi-automated Service s requires Human Actor h i = inputF or(s) ∧ h = providerF or(i) Service s executes Policy-driven automated decision(s) = PolicyDriven Policy p provides AdditionalInput i p = providerFor(i) Service s requires Policy p i = inputF or(s) ∧ providerF or(i) = p
Ac ce p
te
d
Table A.8: Data Viewpoint metamodel equivalences Metamodel element Equivalent Definition s instance of Service s ∈ Service hi instance of Human input hi ∈ HumanInput pi instance of Policy input pi ∈ P olicyInput h instance of Human actor h ∈ HumanActor p instance of Policy p ∈ P olicy fp instance of Formalized policy f p ∈ F ormalizedP olicy g instance of Guideline g ∈ Guideline Service s1 executes after s2 executesAfter(s1,s2) relation Service s executes with Degree of automation d d = decision(s) Service s executes Fully automated decision(s) = Fully Service s executes Either semiautomated or policy- options(s) = {Semi, P olicyDriven} driven ∧ decision(s) is not defined Service s executes Semi-automated decision(s) = Semi Semi automated service s requires Human Input hi hi = inputFor(s) Human actor h provides Human input hi h = providerF or(hi) Guideline g guides Human actor h h = guidedBy(g) Service s executes Policy-driven automated decision(s) = PolicyDriven Policy-driven Service s requires Policy input pi pi = inputF or(s) Formalized policy fp provides Policy input pi f p = providerF or(pi) Policy p is controlled by Human actor ha ha = responsibleFor(p)
37
Page 37 of 44
ip t cr us
Ac ce p
te
d
M
an
Table A.9: Decision Viewpoint metamodel equivalences Metamodel element Equivalent Definition Scope Service s instance of Service s ∈ Service r instance of Rationale r ∈ Rationale d instance of Domain specific factor d ∈ F actor Service s executes with Degree of au- d = decision(s) tomation d Domain independent Service s decision(s) is not defined ∨ |options(s)| = 1 Domain dependent Service s decision(s) is defined ∧ |options(s)| > 1 Service s executes Fully automated decision(s) = F ully ∧ |options(s) = 1| Service s executes Either semi auto- options(s) = {Semi, P olicyDriven} ∧ mated or policy-driven decision(s) is not defined Service s opts for semi automated decision(s) = Semi ∧ |options(s)| > 1 Service s opts for policy-driven auto- decision(s) = P olicyDriven ∧ |options(s)| > 1 mated Service s executes Semi-automated decision(s) = Semi ∧ |options(s) = 1| Service s executes Policy-driven auto- decision(s) = P olicyDriven ∧ |options(s) = 1| mated Rationale r justifies degree of Service s s = justif ies(r), r ∈ individualRationale Rationale r influences {s1..sn} ∈ {s1..sn} = justif ies(r), r ∈ globalRationale Service Rationale r based on Factor[f1..fn] {f1 ..fn } = basedOn(r)
38
Page 38 of 44
ip t
[1] M. Rehfeldt, K. Turowski, Business models for coordinating next generation enterprises, in: Proceedings of the Academia/Industry Working Conference on Research Challenges, IEEE Computer Society, Washington, DC, USA, 2000, p. 163.
cr
[2] M. Chen, A. N. K. Chen, B. B. M. Shao, The implications and impacts of Web Services to electronic commerce research and practices, J. Electron. Commerce Res. 4 (4) (2003) 128–139.
us
[3] T. Erl, Service-Oriented Architecture: Concepts, Technology, and Design, Prentice Hall, 2005.
an
[4] M. Papazoglou, D. Georgakopoulos, Service-oriented computing, Commun. ACM 46 (10) (2003) 25–28.
M
[5] R. Parasuraman, V. Riley, Humans and automation: Use, misuse, disuse, abuse, Human Factors 39 (2) (1997) 230–253.
d
[6] C. H. Crawford, G. P. Bate, L. Cherbakov, K. Holley, C. Tsocanos, Toward an on demand service-oriented architecture, IBM Systems 44 (1) (2005) 81–107.
Ac ce p
te
[7] A. Jansen, P. Avgeriou, J. S. van der Ven, Enriching software architecture documentation, Journal of Systems and Software 82 (8) (2009) 1232 – 1248. [8] ISO/IEC/IEEE, ISO/IEC/IEEE 42010 systems and software engineering - architecture description (2012). URL www.iso-architecture.org/ieee-1471/ [9] G. I. Susman, R. D. Evered, An assessment of the scientific merits of action research, Administrative Science Quarterly 23 (1978) 582–603.
[10] D. Avison, F. Lau, M. Myers, P. A. Nielsen, Action research, Communications of the ACM 42 (1) (1999) 94–97. [11] R. Parasuraman, T. Sheridan, C. Wickens, A model for types and levels of human interaction with automation, IEEE Transactions on Systems, Man, and Cybernetics, Part A: Systems and Humans 30 (3) (2000) 286– 297.
39
Page 39 of 44
ip t
[12] F. Nachreiner, P. Nickel, I. Meyer, Human factors in process control systems: The design of human - machine interfaces, Safety Science 44 (1) (2006) 5–26.
cr
[13] J. Kephart, D. Chess, The vision of autonomic computing, IEEE Computer 36 (1) (2003) 41–50.
us
[14] D. Agrawal, K. Lee, J. Lobo, Policy-based management of networked computing systems, IEEE Communications 43 (10) (2005) 69–75. [15] M. Sloman, Policy driven management for distributed systems, Journal of network and Systems Management 2 (4) (1994) 333–360.
an
[16] A. Bandara, N. Damianou, E. Lupu, M. Sloman, N. Dulay, Handbook of Network and Systems Administration, Elsevier, 2007, Ch. Policy-Based Management, pp. 507–563.
d
M
[17] A. Guerrero, V. A. Villagra, J. E. L. de Vergara, Including management behavior defined with SWRL rules in an ontology-based management framework, in: 12th Annual Workshop of HP Openview University Association, 2005, p. 13.
Ac ce p
te
[18] S. E. Czerwinski, B. Y. Zhao, T. D. Hodes, A. D. Joseph, R. H. Katz, An architecture for a secure service discovery service, in: MobiCom ’99: Proceedings of the 5th annual ACM/IEEE international conference on Mobile computing and networking, ACM, New York, NY, USA, 1999, pp. 24–35. [19] M. kun Cao, R. Chi, Y. Liu, Developing a multi-agent automated negotiation service based on service-oriented architecture, Service Science 1 (1). [20] G. Kecskemeti, Y. Zetuny, T. Kiss, G. Sipos, P. Kacsuk, G. Terstyanszky, S. Winter, Automatic deployment of interoperable legacy code services, in: UK e-Science All Hands Meeting, 2005, pp. 729–736. [21] G. Wang, C. Wang, A. Chen, H. Wang, C. K. Fung, S. A. Uczekaj, Y.-L. Chen, W. Guthmiller, J. Lee, Service level management using QoS monitoring, diagnostics, and adaptation for networked enterprise systems, in: Proceedings of the Ninth IEEE International Enterprise Computing Conference, IEEE Computer Society, 2005, pp. 239–250. 40
Page 40 of 44
ip t
[22] Q. Gu, P. Lago, On service-oriented architectural concerns and viewpoints, in: 8th Working IEEE/IFIP Conference on Software Architecture, IEEE, Cambridge, UK, 2009, pp. 289–292.
cr
[23] J. Ruiz, J. Due˜ nas, F. Cuadrado, Model-based context-aware deployment of distributed systems, IEEE Communications Magazine 47 (6) (2009) 164–171.
us
[24] T. C. Lethbridge, J. Singer, A. Forward, How software engineers use documentation: The state of the practice, IEEE Software 20 (6) (2003) 35–39.
an
[25] P. Clements, D. Garlan, R. Little, R. Nord, J. Stafford, Documenting Software Architectures: Views and Beyond, Addison-Wesley, 2002.
M
[26] L. Bass, P. Clements, R. Kazman, Software Architecture in Practice, 2nd Edition, Addison-Wesley, 2003. [27] P. Selonen, J. Xu, Validating UML models against architectural profiles, SIGSOFT Software Engineering Notes 28 (5) (2003) 58–67.
te
d
[28] N. Liu, D. Zheng, F. Gao, Y. Xiong, Research on the application of UML in software architecture modeling, in: 10th IEEE International Conference on High Performance Computing and Communications, IEEE Computer Society, Los Alamitos, CA, USA, 2008, pp. 762–766.
Ac ce p
[29] P. Kruchten, The 4+1 view model of architecture, IEEE Software 12 (6) (1995) 42–50. [30] C. Hofmeister, P. Kruchten, R. L. Nord, Generalizing a model of software architecture design from five industrial approaches, in: the 5th Working IEEE/IFIP Conference on Software Architecture, 2005, pp. 77–86. [31] P. Clements, F. Bachmann, L. Bass, D. Garlan, J. Ivers, R. Little, R. Nord, J. Stafford, A practical method for documenting software architectures (2002). URL www-2.cs.cmu.edu/afs/cs/project/able/ftp/icse03-dsa/submitted.pdf [32] D. Norris, The ISO reference model for open distributed processing: An introduction, Journal of Computer Networks and ISDN Systems 27 (8) (1995) 1215–1229. 41
Page 41 of 44
ip t
[33] J. Zachman, A framework for information systems architecture, IBM Systems Journal 26 (3) (1987) 276–292. [34] P. Eeles, P. Cripps, The Process of Software Architecting, AddisonWesley Professional, July 2009.
us
cr
[35] R. M. Dijkman, D. A. Quartel, L. F. Pires, M. J. van Sinderen, An approach to relate viewpoints and modeling languages, in: Proceedings of the 7th IEEE Enterprise Distributed Object Computing Conference, IEEE Computer Society, Los Alamitos, CA, USA, 2003, pp. 14–27.
an
[36] N. Bouck´e, D. Weyns, R. Hilliard, T. Holvoet, A. Helleboogh, Characterizing relations between architectural views, in: Proceedings of the 2nd European conference on Software Architecture, Springer-Verlag, Berlin, Heidelberg, 2008, pp. 66–81.
M
[37] R. Hilliard, The trust viewpoint (2009). URL www.iso-architecture.org/viewpoints/docs/hilliard-TrustVP-r1.pdf
te
d
[38] D. Emery, R. Hilliard, Updating IEEE 1471: architecture frameworks and other topics, in: Proceedings of the Seventh Working IEEE/IFIP Conference on Software Architecture, IEEE Computer Society, 2008, pp. 303–306.
Ac ce p
[39] Q. Gu, F. Cuadrado, P. Lago, J. C. Duenas, Service Research Challenges and Solutions for the Future Internet: S-Cube - Towards Engineering, Managing and Adapting Service-Based Systems, Vol. LNCS 6500 of Services Science Subline, Springer-Verlag, 2010, Ch. Architecture Views illustrating the Service Automation Aspect of SOA, pp. 339–372. doi:10.1007/978-3-642-17599-2. [40] M. A. Babar, P. Lago, Design decisions and design rationale in software architecture, Journal of Systems and Software 82 (8) (2009) 1195–1197. [41] D. Harel, Statecharts in the making: A personal account, Communications of the ACM 52 (2009) 67–75. [42] P. Kruchten, Controversy corner: What do software architects really do?, Journal of Systems and Software 81 (12) (2008) 2413–2416.
42
Page 42 of 44
ip t
[43] C. Chen, Information visualization: Beyond the horizon, SpringerVerlag New York, Inc., 2004.
cr
[44] S. K. Card, J. Mackinlay, B. Shneiderman, Readings in Information Visualization: Using Vision to Think (Interactive Technologies), 1st Edition, Morgan Kaufmann, 1999.
us
[45] A. Evans, R. France, K. Lano, B. Rumpe, The uml as a formal modeling notation, in: J. B´ezivin, P.-A. Muller (Eds.), The Unified Modeling Language. UML”98: Beyond the Notation, Vol. 1618 of Lecture Notes in Computer Science, Springer, 2004, pp. 514–514.
M
an
[46] C. Ouyang, M. Dumas, A. H. M. ter Hofstede, W. M. P. van der Aalst, From BPMN process models to BPEL web services, in: Proceedings of the IEEE International Conference on Web Services, IEEE Computer Society, Washington, DC, USA, 2006, pp. 285–292.
d
[47] OMG, Service oriented architecture modeling language (SoaML) - specification for the UML profile and metamodel for services (UPMS) - revised submission (2008-11-01) (2008). URL www.omg.org/cgi-bin/doc?ad/08-08-04.pdf
Ac ce p
te
[48] E. D. Nitto, V. Mazza, A. Mocci, Collection of industrial best practices, scenarios and business cases, Deliverable CD-IA-2.2.2, S-Cube Consortium, www.s-cube-network.eu (2009). [49] Q. Gu, P. Lago, Exploring service-oriented system engineering challenges: A systematic literature review, Service Oriented Computing and Application 3 (3) (2009) 171–188.
43
Page 43 of 44
Ac ce p
te
d
M
an
us
cr
ip t
The highlights are changed to: - We identify concerns relating to automating the execution of software services. - We provide definitions of the 3D service automation viewpoints. - We design graphical notations maximizing the expressiveness of the conforming
Page 44 of 44