P UBLISHED BY IOP P UBLISHING FOR SISSA R ECEIVED: September 16, 2009 ACCEPTED: October 12, 2009 P UBLISHED: October 29, 2009
1st I NTERNATIONAL C ONFERENCE ON M ICRO PATTERN G ASEOUS D ETECTORS , J UNE 12-15, 2009 KOLYMPARI , C RETE , G REECE
N. Majumdar,1 S. Mukhopadhyay and S. Bhattacharya INO Section, Saha Institute of Nuclear Physics, 1/AF Bidhannagar, Kolkata - 700064, India
E-mail:
[email protected] A BSTRACT: A numerical study on three dimensional field configuration of a structure based on the concept of Gaseous Electron Multiplier (GEM), namely THick GEM (THGEM) has been carried out using nearly exact Boundary Element Method (neBEM) solver. Various designs of this multiplier device have been studied to examine the effect of the geometrical and electrical properties of the structure on its field configuration. K EYWORDS : Gaseous detectors; Detector modelling and simulations II (electric fields, charge transport, multiplication and induction, pulse formation, electron emission, etc); Micropattern gaseous detectors (MSGC, GEM, THGEM, RETHGEM, MICROMEGAS, InGrid, etc)
1 Corresponding
author.
c 2009 IOP Publishing Ltd and SISSA °
doi:10.1088/1748-0221/4/10/P10013
2009 JINST 4 P10013
3D field simulation in GEM-type structures
Contents 1
2 The neBEM
2
3 Numerical model
2
4 Numerical tests
3
5 Results
4
6 Computational resources
9
7 Conclusion
9
1 Introduction The intensive research and development on gaseous detector in alliance to the recent advent in micro-lithographic techniques has introduced a new genre of detection devices, commonly termed as micro-pattern gaseous detector (MPGD). The MPGD’s, owing to their minuscule design, are able to provide spatial resolution of the order of few tens of micro-meters and function in extremely luminous environment of present day accelerators. The advantages of high rate capability, reasonably good space, time and energy resolution, high gain, granular readout in addition to radiation hardness and low material budget make these detectors useful in almost all the modern experiments where identification, tracking and imaging of particles are required. Within the broad family of MPGD’s, Gaseous Electron Multiplier (GEM) can be classified as one of the major inventions. It is a novel concept of multiplying primary electrons by making them pass through a potential difference of a few hundreds of volt applied across a thin sieve of tens of micro-meter thickness [1]. The device is basically a thin polymer foil coated with metal on both sides and etched chemically to make a two dimensional array of holes. By application of suitable voltages on the conducting sides, a strong dipole electric field is generated inside these holes. The electrons released by the primary ionization on one side of the foil drift towards it under suitable electrostatic condition and undergo avalanche inside the channels before emerging on the other side. The design of the GEM with its simplicity and robustness has been advantageous in many ways. It can focus primary electrons into the hole efficiently and transmit the secondary ones resulting from multiplication inside the hole. As a result, it can be used as a separate amplification stage in single or cascaded mode depending upon the requirement to boost the detector gain. It, thus, allows for optimization of the readout electrode according to the necessity of the application.
–1–
2009 JINST 4 P10013
1 Introduction
2 The neBEM The Boundary Element Method (BEM) is one of the moderately popular numerical methods that can be used to solve for various properties of a physical system governed by partial differential equations, such as the Poisson’s equation. It may be noted here that possibly the most popular method in this regard is the Finite Element Method (FEM). In electrostatics, the BEM estimates potential, field and other properties of interest in a device by superimposing the influence of the charge density distributed over the boundaries of the device. The charge densities are solved for by satisfying the Dirichlet/Neumann type boundary conditions for the given device through the implementation of a suitable Green’s function formulation. The neBEM solver uses a closed form expressions of the potential and the field obtained from the symbolic integration of the Green’s function of a uniform charge density distributed over flat triangular or rectangular boundary element. The elegant analytic formulation of the method enables it to yield very precise estimation of the potential and electric field with remarkable near-field as well as far-field accuracy. A detailed discussion on the advantages of the neBEM compared to numerical methods like standard BEM and FEM while simulating the field configuration particularly in gaseous detectors may be found in [6–8]
3 Numerical model The THGEM device considered for calculation has been modeled by using a periodic replication of a single module. A typical THGEM module is made from a standard PCB of G-10 type (relative dielectric constant 4.5). The thickness of the board is 0.4 mm, metalized on each side with a copper coating. The thickness of the copper layer which can vary from 5 − 17 µ m is taken to be 5 µ m. The diameter of the hole that is mechanically drilled on the PCB is 0.3 mm. To avoid the edge discharge, the copper along the periphery of the hole is chemically etched to remove sharp conducting edges. This has been found to result in higher gain in THGEM device. The width of the
–2–
2009 JINST 4 P10013
Recently, a device known as THick GEM (THGEM), has been developed using similar concept of amplification [2]. With dimension magnified by a factor of 5-50 in comparison to GEM it can be manufactured economically by mechanical drilling of holes with diameter and pitch of a few hundreds of micro-meters on a Printed Circuit Board (PCB) of similar thickness. With the same operation principle, it can offer better collection efficiency due to its larger dimension of the hole in comparison to the transverse diffusion range of the electron. Owing to its properties of efficient electron transmission and collection, the THGEM can be used in cascaded mode like GEM in a device which leads the device to achieve higher gain with lower bias voltage per THGEM stage and thus a better operation stability. A detailed numerical study of electrostatic field configuration of a THGEM has been reported in this paper. This has been carried out in order to understand the dependence of the field configuration of a device on its physical features. The effect of varying each of these features on the electrostatic configuration has been studied individually. This kind of study may be useful in optimizing the design of a new device as well as interpreting the performance of an existing one. The computations have been carried out by using a field solver, namely the nearly exact Boundary Element Method (neBEM) [3–5] based on a novel formulation of the Boundary Element Method (BEM).
Z (mm)
-0.4
-0.3 -0.2
-0.1 0 X (mm) 0.1 0.2
0.2
-0.1 -0.2 -0.3 0.3 0.4 -0.4
0
0.3
0.4
0.1 Y (mm)
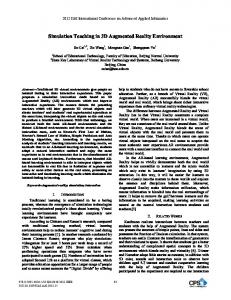
Figure 1. A representative module of THGEM as considered in the calculation with segmentation of its surfaces. The discretization into right angled triangular primitives are shown for a few cases.
dielectric rim surrounding the hole is 0.1 mm. A potential difference of 2.0 kV is applied across the electrodes of the module. A representative module of the THGEM as considered in the calculation is depicted in figure 1 which also shows the segmentation scheme adopted while modeling the geometry in the pre-processing stage of the solver. It may be noted here that, in neBEM, any three-dimensional device is assumed to be composed of a number of flat surfaces called primitives. These surfaces can be right-triangular or rectangular. Thus, in the pre-processing stage, the device of interest needs to be segmented into right triangles or rectangles. The circular hole of the THGEM has been represented by a polygon of 16 sides. The conductor and dielectric surfaces have been segmented into right-triangular or rectangular primitives depending upon the shape of their preliminary sections. The segmentation scheme for the triangular primitives is illustrated (using dashed line) for a few representative cases on the top and bottom electrodes and rims, respectively. Further discretization of the primitives has been done using a scheme of 9 × 9 elements in general for all the rectangular and triangular primitives. The total number of the elements in the module thus has reached 13200. Finally a periodicity of 5 has been used with a pitch of 0.7 mm to generate a matrix array of 11 × 11 of such THGEM modules.
4 Numerical tests The accuracy of the result is of serious concern in the numerical methods which can not offer exact solution like analytic ones. Apart from the inherent formulation of the method concerned, the choice of parameters in geometrical modeling is crucial in this regard. This should be done judiciously to optimize computational expenses while maintaining necessary accuracy. In the present work, several numerical tests have been conducted to validate the parameters that have been used in the modeling of the THGEM case.
–3–
2009 JINST 4 P10013
0.25 0.2 0.15 0.1 0.05 0 -0.05 -0.1 -0.15 -0.2 -0.25
0.25 0.2 0.15 0.1 0.05 0 -0.05 -0.1 -0.15 -0.2 -0.25
35 Large module
30
EZ (kV/cm)
25 20 15 Hole length
10
0 -5 -0.3
-0.2
-0.1
0
0.1
0.2
0.3
Z (mm)
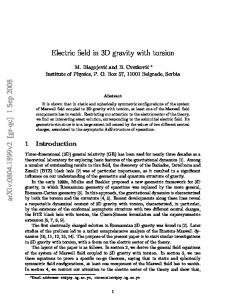
Figure 2. Electric field along the axis of the hole of the central THGEM unit for different periodicity (i).
A periodicity of 5 in both the X and Y -directions has been implemented here to model a THGEM device. It is important to verify whether the periodicity is sufficient for canceling the device edge effect. A series of field calculation has been performed in this regard for periodicity ranging from 0 (single module) to 7. Figure 2 shows that the use of periodicity of 5 is justified as the field values for different periodicity, i, converge well within this limit. This also leads to a comfortable compromise between the accuracy and the amount of computation. It has been examined whether an alternative simplified geometry with large aspect ratio to the THGEM hole can be used to represent the field distribution of the same. For this purpose, a field calculation has been carried out for a large THGEM module with all of its dimension unaltered, except the electrodes that have been extended by 10 fold. This makes the module size comparable to a THGEM device with hole periodicity 5. The calculation is indicated separately in the figure 2. When compared to the result of periodicity of 0 where the contribution of the device edge should be large, this proves that a large module may be sufficient to cancel the edge effect. However, although it leads to substantially small computation, use of such an artificially large module fails to represent the actual field configuration obtained by using a periodic structure. As can be seen from the figure 2, it actually overestimates the field. This happens because of the over-simplification of the geometry which now tends towards a parallel plate structure. Representation of a hole is another important aspect from the viewpoint of accuracy related to the geometrical modeling. Figure 3 shows the electric field calculation for several polygons used to represent the THGEM hole. Since the result for 16 and 32 are quite close, the former one has been opted for the present calculation without compromising the accuracy. A substantial reduction in computation could be achieved by the choice reducing the matrix dimension from 28688 to 13200 for a single THGEM module.
5 Results The computation of the potential and electric field for the THGEM devices described below has been carried out with modeling parameters like periodicity and polygon sides determined by the
–4–
2009 JINST 4 P10013
i=0 i=2 i=5 i=7
5
35
30
EZ (kV/cm)
25
20 Hole length 15
5 -0.3
-0.2
-0.1
0
0.1
0.2
0.3
Z (mm)
Figure 3. Electric field along the axis of the hole of the central THGEM module for different polygon sides (s). 1.1
1 0.8
Rim width
1
0.6 0.4
0.9 Φ (kV)
Φ (kV)
0.2 0.8
0 -0.2
Hole dia
0.7
-0.4 -0.6
0.6
-0.8 0.5 -0.4
Hole length
-1 -0.3
-0.2
-0.1
0 X (mm)
0.1
0.2
0.3
0.4
(a) On the top surface
-0.4
-0.2
0 Z (mm)
0.2
0.4
(b) Along the hole axis
Figure 4. Potential distribution in THGEM module.
numerical tests described above. The potential distribution across the bottom surface (along Xdirection) and along the axis of the hole (along Z-direction) of the central THGEM module are shown in figure 4. It shows the obvious trend of attaining minimum at the centre of the hole and gradual increase in the value as the electrodes are approached. Figure 5 shows the estimated electric field along the axis of the THGEM module at its centre. It shows an extension of the field well out of the hole into the adjacent volumes. The field calculation using MAXWELL, an FEM solver, for the same design is plotted in the figure as reported in [9]. The difference between the two results may occur primarily due to the numerical methods used for estimating the field distribution. A relevant discussion on the reasons for disagreement between the field calculations following the FEM and BEM may be found in [6, 7, 10]. A few more possible reasons are the geometrical modeling and the boundary conditions used in the respective calculations. The modeling used in case of the neBEM calculation with justification of their choice has been discussed in the previous section. However, those used in [9] has not be explicitly mentioned and may be different from that used here. In addition to that, no boundary condition has been imposed in the present geometry in terms of other external electrodes like drift or collection ones
–5–
2009 JINST 4 P10013
s = 08 s = 16 s = 32
10
50
No drift/collection With drift/collection C. Shalem et al.[9]
40
EZ (kV/cm)
30
20 Hole length 10
-10 -1
-0.5
0
0.5
1
Z (mm)
Figure 5. Electric field along the axis of the hole of the central THGEM module. The calculation of the same reported in [9] is included.
EZ (kV/cm)
36 34 32 30 28 26 24 22 20 18
36 34 32 30 28 26 24 22 20 18 -0.15
-0.1
-0.05 X (mm)
0
0.05
-0.05 -0.1 -0.15 0.1 0.15 -0.2
0
0.2 0.15 0.1 0.05 Z (mm)
Figure 6. 3D electric field in the XZ-plane inside the THGEM hole.
except for the result presented in figure 5. The calculation has been carried out for a stand-alone THGEM stage which can be used in a single or cascaded mode in a gaseous device. On the other hand, the FEM calculation like MAXWELL needs to specify device boundaries and electric field therein as the boundary conditions to perform the calculation. The result of including a collection electrode with a voltage of 4.0 kV at 1.0 cm below the bottom electrode of the THGEM in the neBEM changes the field in the collection volume as is evident from the figure 5. However, the presence of a drift electrode at a potential of −1.1 kV at 1.0 cm above the top electrode does not affect the distribution in the drift region. The three dimensional surface plot of the electric field in the XZ-plane inside the THGEM hole is illustrated in figure 6. It shows a saddle shaped distribution within the hole which implies a greater electron multiplication towards the edges of the hole for a given potential configuration. An investigation on the design parameters has been carried out systematically to understand
–6–
2009 JINST 4 P10013
0
40
45
at centre at half distance from centre at 10 µm away from side
35 30
40 EZ (kV/cm)
EZ (kV/cm)
25 20 15
Hole length
10
d = 0.10 mm d = 0.20 mm d = 0.25 mm d = 0.30 mm d = 0.40 mm
5 0
30
-5 -0.4
-0.2
0
35
0.2
25 0.05
0.4
0.1
0.15
0.2
0.25
0.3
0.35
0.4
0.45
d (mm)
(a) Electric field along the hole axis.
(b) Electric field across the hole.
Figure 7. Electric field inside the THGEM hole as a function of hole diameter, d.
their role in the electrostatic field configuration of the device. The results of the study are presented below. 1. Hole diameter: A systematic study has been conducted to observe the effect of the change in the diameter of the THGEM hole on the electric field inside the same. Keeping the other parameters unaltered, the diameter has been changed over a range from 0.1 mm to 0.4 mm. In figure 7, the field values along the hole axis and across the hole are illustrated as a function of diameter, d. Figure 7(a) shows a decrease as well as spreading in the field distribution as the hole diameter increases. This implies that the electron multiplication typically extends out of the hole as the diameter increases. In figure 7(b), three different lines represent the variation of the field at the centre of the hole, at locations halfway between the centre and the edge and lastly10 µ m away from the edge of the hole, respectively. This indicates the shape of the electric field distribution across the hole within its length. It shows a falling trend of the electric field at all the locations as the hole diameter increases, however, with a faster rate at the centre in comparison to that near the edge. So at larger diameter, chances of electron multiplication near the edge increases in comparison to that at the centre. However, the overall multiplication factor reduces due to a reduction in the field values. 2. Rim width: The electric field variation with the change in the rim width, w, is depicted in figure 8. The variation of the electric field distribution along the axis of the hole is illustrated in figure 8(a) which shows a drop in the field as the rim width increases. It can be noticed from comparing the figure 8(a) to the figure 7(a) that the effective change in the field value is the same for a change in either of the hole diameter or rim width. It indicates that it is the diameter of the hole on the electrode, including both the hole diameter and the rim width, that influences the field value within the hole. Figure 8(b) shows the field values at the same three locations across the hole at its centre. Here it is evident that the falling trend in the field with the increase in the rim width is almost similar everywhere. So, the increase in the rim width does not affect the shape of the field distribution significantly in contrast to what observed in case of hole diameter. Thus, it may be said that the shape of the cross-sectional field distribution is affected by the hole diameter alone while the field value at the centre depends on the resultant of both the hole diameter and rim width. It can also be noticed
–7–
2009 JINST 4 P10013
Z (mm)
40
40
35
at centre at half distance from centre at 10 µm away from side
38
30 36 EZ (kV/cm)
EZ (kV/cm)
25 20 15
Hole length
10
w = 0.05 mm w = 0.10 mm w = 0.15 mm
5
34 32 30 28
0 -5
26 -0.4
-0.2
0
0.2
0.4
0.06
0.08
0.1
0.12
0.14
0.16
w (mm)
(a) Electric field along the hole axis.
(b) Electric field across the hole.
Figure 8. Electric field inside the THGEM hole as a function of the width of the rim, w. 35
38
30
37 36
25
35
20 15
Hole length
10
t = 0.35 mm t = 0.40 mm t = 0.45 mm
EZ (kV/cm)
EZ (kV/cm)
at centre at half distance from centre at 10 µm away from side
34 33 32
5
31
0
30
-5 -0.4
-0.2
0 Z (mm)
0.2
29 0.34
0.4
(a) Electric field along the hole axis.
0.36
0.38
0.4 t (mm)
0.42
0.44
0.46
(b) Electric field across the hole.
Figure 9. Electric field inside the THGEM hole as a function of the thickness of the PCB, t.
that a change of about 20% in the field value may be obtained at the centre of the hole for a change of 200 µ m in the hole diameter on the conductor. 3. PCB thickness: A study has also been carried out for observing the effect of change in PCB thickness. In figure 9, the variation of the field along the axis of the THGEM hole and across the hole due to a change in the PCB thickness are plotted. The electric field distribution along the hole axis for different thickness of the PCB, t, is illustrated in figure 9(a) while that across the hole is in figure 9(b). Here, an opposite trend in the field distribution can be noticed in comparison to what has been observed in case of hole diameter. Here, the field towards the edge falls at a faster rate in comparison to that at the centre while the thickness is increased. It indicates a decrease in the depth of the saddle shaped distribution within the hole. Hence, with the increase in the dielectric thickness, less electron multiplication towards the edge is implied. 4. Potential: The change in the potential applied on two electrodes of a THGEM module can affect the electric field in a way as shown in figure 10(a). The field distribution along the axis of the hole for several potential difference, Φ, is illustrated which shows a dip in the field as the difference is decreased. The trend of the cross-sectional field distribution can be obtained from the figure 10(b) where the field values at the three said locations across the hole are plotted as a function of the applied potential, Φ. Both the figures show the obvious
–8–
2009 JINST 4 P10013
Z (mm)
50
50
at centre at half distance from centre at 10 µm away from side
45
40
40 EZ (kV/cm)
EZ (kV/cm)
30
20
10
Φ = 1.0 kV Φ = 1.5 kV Φ = 2.0 kV Φ = 2.5 kV Φ = 3.0 kV
0
35 30 25 20 15
-10
10 -0.4
-0.2
0
0.2
0.4
0.8
1
1.2
1.4
1.6
1.8
2
2.2
2.4
2.6
(a) Electric field along the hole axis.
(b) Electric field across the hole.
Figure 10. Electric field inside the THGEM hole as a function of the applied potential, Φ.
increase in the field value as the potential is raised. An increase in the electron multiplication towards the edge of the hole is implied from the figure 10(b) with increasing potential.
6 Computational resources The computation of electric potential and field of various cases for the THGEM module has been carried in a blade server housed in HP C3000 enclosure. These blades belong to the product category ProLiant DL463c G1. There are five blades each having two quad core intel Xeon with clock speed 2.3 GHz, 16/32 GB RAM, running RHEL 5.2.
7 Conclusion The 3D electric field distribution for a THGEM module has been estimated using the neBEM solver which yields very precise potential and field estimates for any given geometry. The parameters of the present geometry model has been determined by performing several numerical tests. A periodicity of 5 and a close representation of hole with a 16-sided polygon have been found to be reasonably accurate without being prohibitively expensive computationally. The effect of the variation of different geometrical parameters have been closely studied. The details of the change in the axial field distributions along axial and radial directions have been discussed in the light of the results provided by the neBEM. THGEM being a micro-pattern device with complex micro-structures and having a substantial amount of dielectric material in its structure, necessitates a thorough study on its electrostatic field configuration. A numerical solver like the neBEM is expected to be very effective in the design and interpretation of such devices.
References [1] F. Sauli, GEM: a new concept for electron amplification in gas detectors, Nucl. Instrum. Meth. A 386 (1997) 531. [2] A. Breskin et al., A concise review on THGEM detectors, Nucl. Instrum. Meth. A 598 (2009) 107. [3] S. Mukhopadhyay et al., Computation of 3D MEMS electrostatics using a nearly exact BEM solver, Engg. Anal. Bound. Elem. 30 (2006) 687.
–9–
2009 JINST 4 P10013
Φ (kV)
Z (mm)
[4] S. Mukhopadhyay et al., A study of three-dimensional edge and corner problems using the neBEM solver, Engg. Anal. Bound. Elem. 33 (2009) 105. [5] http://neBEM.cern.ch/neBEM. [6] N. Majumdar and S. Mukhopadhyay, Simulation of three dimensional electrostatic field configuration in wire chambers: a novel approach, Nucl. Instrum. Meth. A 566 (2006) 489. [7] N. Majumdar and S. Mukhopadhyay, Simulation of 3D electrostatic configuration in gaseous detectors, 2007 JINST 2 P09006.
[9] C. Shalem, R. Chechik, A. Breskin and K. Michaeli, Advances in thick GEM-like gaseous electron multipliers. I: atmospheric pressure operation, Nucl. Instrum. Meth. A 558 (2006) 475. [10] S. Mukhopadhyay et al., Effect of finite dimension on the electric field configuration of cylindrical proportional counters, IEEE Trans. Nucl. Sci. 53 (2006) 539.
– 10 –
2009 JINST 4 P10013
[8] N. Majumdar, S. Mukhopadhyay and S. Bhattacharya, Computation of 3D electrostatic weighting field in Resistive Plate Chambers, Nucl. Instrum. Meth. A 595 (2008) 346.