3D PHYSICAL MODEL TESTING OF THE LOWERING OF A CAISSON INTO WATER AT THE TANGIER MED 2 DEVELOPING PROJECT PEDRO LOMONACO (1), ANDRES MENDOZA (2), ALVARO ALVAREZ (3), EMMANUEL BERGER (4) & MELANIE MAZET (5) (1) Head
of the Hydraulic, Coastal and Ocean Lab, Environmental Hydraulics Institute, University of Cantabria, Isabel Torres 15, PCTCAN, Santander, 39011, Spain.
[email protected]
(2)
(3)
(4)
Research Engineer, Environmental Hydraulics Institute, University of Cantabria, Isabel Torres 15, PCTCAN, Santander, 39011, Spain.
[email protected]
Instrumentation and Electronics Engineer, Environmental Hydraulics Institute, University of Cantabria, Isabel Torres 15, PCTCAN, Santander, 39011, Spain.
[email protected]
Marine Works Methods, SAIPEM SA, 1/7, Avenue San Fernando, Montigny-le-Bretonneux, 78884 Saint Quentin Yvelines Cedex, France.
[email protected] (5)
Marine Studies, Tanger Mediterranée BouYges Saipem TMBYS, B.P. 1213 – 9000, Tanger, Maroc.
[email protected]
Abstract A 3D physical model study has been conducted to investigate and measure the forces exerted by a caisson, as it is being lowered into water, on the strands of a bridge crane which supports it in the procedure. The lowering facility belongs to the Tangier Med 2 Developing Project. Forces were also measured on the fenders installed in the pool where the caisson is being lowered. Damage to the ballast rock layer, underneath the caisson, has also been assessed. The study was carried out in the 28 m long by 8.6 m wide by 1.2 m high directional wave basin, located in IH Cantabria’s Hydraulic, Coastal and Ocean Laboratory at the University of Cantabria, Santander, Spain. A 1:20 scale physical model of a caisson, the lowering facility, quay, pool and rock revetment were constructed for this study. Measured forces and observed motions indicates that the lowering of a caisson should be avoided for any incident significant wave height exceeding 0.5 m and a corresponding peak wave period of 15 s, while the operation should be avoided for wave heights exceeding 0.75 m and a corresponding wave period of 12 s. care should be taken on the use of mooring lines, since they help significantly in reducing the motions of the caisson. The study has provided useful information to the designer of the lowering facility as well as the operations team for lowering planning.
1.
Introduction
Tangier Med 2 developing project is located westwards from the existing port of Tangier Med, in Morocco. The general layout, seen in Figure 1, consists of a 2600 m long main breakwater and a 900 m long secondary breakwater. The breakwaters of the new port of Tangier Med 2 are made of two types: rubble mound at shallower waters, and caissons at the deepest portions of the breakwater. The caisson breakwaters are composed of 106 quadrilobe caissons in total.
Figure 1. General layout of Port de Tanger Mediterranée II. The breakwater parallel to shore is made of quadrilobe caissons. The caisson pre-casting and lowering facility is located at the southern part of the inner basin.
Within the port, a caisson pre-casting and lowering into water facility have been constructed at the southern part of the inner basin. Quadrilobe caissons are manufactured in two parts. The first part is built on a precast line on land, and then the caisson is lowered into water within a 32 m long by 34 m wide pool, partly open to the sheltered waters in the port. The handling of the caissons is made with a bridge crane, which lifts the matured concrete caisson 0.3 m from the longitudinal beams at the end of the precast line, and then is skidded up to its correct position above the pool. A render image of the lowering facility, including the bridge crane, a quadrilobe caisson and the pool, is shown in Figure 2, while the actual lowering facility with the first pre-casted quadrilobe caisson as it is being launched and lowered into water is presented in Figure 3.
Figure 2. 3D render image of the system for lowering the caisson into water.
Figure 3. Photograph of the prototype lowering facility launching the first precast quadrilobe caisson.
The bottom elevation at the pool is -6 m ZH (ZH is the local chart datum), while outside the pool the bathymetry can be considered to be at a constant elevation of -8 m ZH. A transition slope connects the pool with the port bottom bathymetry. The bottom layer of the pool is made of 0.5 m of 40/60 mm ballast material. The handling of the caissons is made with a bridge crane, sliding on top of a structure made of reinforced concrete. Two heavy lift jacks are fixed to each truss, and each jack is composed of 33 strands. While the caisson is being lowered and/or ballasted with water, as well as when the caisson is laid on the bottom of the pool, it is subject to the action of waves diffracted around the rubble mound main breakwater. While the caisson is being lowered, its motion will be controlled (if necessary) with mooring lines. Also, fenders are located along the three sides of the pool to protect the caisson from damage. Physical model studies remain the best approach to verify forces due to motions of large floating bodies in narrow and semi-enclosed areas. A well-conceived and well-executed physical model investigation is the only way to accurately simulate the complex interaction of waves with large restrained floating bodies in relatively shallow waters. This paper describes the physical model studies conducted to evaluate the vertical and horizontal forces sustained by the caisson lowering facility in Tangier Med II developing project, under incident wave conditions. The objectives of the physical model tests were: 1. To measure the overall vertical stress applied on the caisson by the incoming waves. This will enable the bridge crane supplier to check the design of the steel structure. 2. To measure the horizontal stress applied on the caisson by the incoming waves in order to dimension the lateral fenders to be installed in the pool. The study also included the assessment of damage on the ballast bed, as well as the observation of any other relevant phenomena such as the stability of the rubble mound protecting the pool, as well as wave overtopping at the lowering facility. The study was conducted at a scale of 1:20 in the Directional Wave Basin (TOD), located at the Ocean &
Coastal Laboratory of the University of Cantabria, in Spain. 1:20 scale physical models of a caisson, pool and bridge crane were constructed for this study. The model was fitted with six wave gauges, eight axial load cells for the strands, six underwater load cells for the fenders, and two digital still and video cameras. Five cases, corresponding to different ballasting and/or lowering conditions of the caisson have been tested under unidirectional, long-crested sea-states, ranging significant wave heights from 0.5 m to up to 1.2 m, and peak wave periods from 7 s to 15 s. Overall, 66 tests have been carried out, producing a reliable and useful database for designing and managing the lowering procedure, where the maximum wave height and wave period for safe lowering was established. Maximum strand forces as well as fender loads have been measured and the caisson motion was recorded where large displacements, sloshing and impact forces were monitored and counteracted with scaled mooring lines.
2.
Model design, construction and instrumentation
2.1 Model facility As indicated previously, the 3D model study on the lowering of a quadrilobe caisson into water for the Tangier Med 2 development project was conducted in Directional Wave Basin (TOD), operated by the Environmental Hydraulics Institute, University of Cantabria (IH Cantabria). The basin is 28 m long, 8.6 m wide and 1.2 m deep, equipped with a multi-board electric-drive piston wave maker. The wave machine is made of 10 independent paddles and fitted with a sophisticated control system for generation of long- and short-crested directional waves, with full 3D active wave absorption. The basin’s floor and walls are made of concrete, and a sump is located underneath replicating the basin volume, served with two pumps for fast filling and draining. The original basin floor is flat and horizontal and the testing section is approximately 8.6 m wide and 14 m long. The basin is served by a 5000 kg bridge crane and fitted with a 6 m long passive wave absorber made of expanded steel plates. 2.2 Scaling relationships Choosing the best scale factor for a model study generally boils down to striking a compromise between working at a large scale in order to minimize scale effects, and working within the constraints of a facility (basin dimensions, wave generation limits, and so on). Generally speaking, larger models provide more accurate simulations of wave structure interactions and therefore yield more reliable results. Hence, it is normally best to maximize the model scale as much as possible. The Tangier Med 2 lowering facility model structures were studied at 1:20 scale, which implies that all lengths in the physical model are 20 times smaller than at full scale. Froude scaling provides a set of scaling laws that dictate the proper relationship between quantities measured in a model, such as wave height and wave period, and the same quantities at full scale. These scaling relationships are derived from similitude of the Froude number (Fr), which represents the relative magnitude of gravitational and inertial forces. Since wave motion and wave – structure interactions are governed by a balance between the gravitational and inertial forces acting on water particles, similitude of the Froude number in the model and at full scale, together with geometric similitude, ensures that the model provides a realistic simulation of these processes.
nted w ave m achine
2.3 Model layout A portion of the precast line and the pool, where caissons are lowered into water, were constructed within the TOD of IH Cantabria. In Figure 4 the model structure layout of the precast line, pool and adjacent rubble mound structure is shown at a scale of 1:20. The proposed orientation of the basin corresponds to the expected West-North-westerly wave direction, where irregular long-crested waves were generated to study the wave penetration. An estimate of the incoming waves, based on standard wave reflection analysis, and the fact that the bottom of the basin remains flat and horizontal, can be performed in presence of the structures.
Lateral
Dissipa
tion zon
e
Segme
WG04 WG05 WG06
wave a bsorbe rs
Figure 4. Layout of the lowering facility 1:20 physical model in the Directional Wave Basin. The segmented wave machine is located at the left of the image and the passive wave absorbers at the opposite side. A portion of the lowering facility is located near the absorbers.
2.4 Model construction The model structures of the precast line were constructed with masonry, plywood, and PVC pipes according to the design drawings. Rubble mound sea-walls were constructed with small stones replicating the prototype geometry, including the pool bottom layer of ballast stones. A steel structure was fabricated reproducing the geometry of the bridge crane, and a model of the caisson, made of an epoxy resin, was constructed reproducing the geometry as well as the distribution of masses (inertias) of the prototype. The caisson was supported by the model bridge crane by a set of 8 braided cables; equivalent in section and location to the 16 bunches of strands of the prototype. The set of cables were replaced, stretched or detached from the caisson in order to be able to simulate the different test cases. Figure 5 presents a series of photographs with the various stages of the quay, pool, rock revetment and ballast layer construction and installation. Figure 5 also includes images of the model quadrilobe caisson, supported by the bridge crane and strands over the ballast layer. No model bathymetry was required for these studies, as the seabed at the site can be well represented by a level floor. The averaged elevation of the basin floor was set to correspond to the prescribed average still water depth, i.e. -8 m ZH.
Figure 5. Construction and installation of the lowering facility physical model. Overview quay, pool, ballast layer, bridge crane, quadrilobe caisson and supporting strands.
2.5 Instrumentation Vertical fluctuations of the free surface (waves) were measured with resistive type wave probes. These gauges were re-calibrated several times (typically on a daily basis) throughout the test program. During the tests, 6 wave gauges were installed. Three wave gauges (WG01 to WG03 in Figure 4) were placed between the model structures and the wave machine to determine the incident and reflected wave energy by applying the Mansard & Funke standard wave separation procedure (Mansard and Funke, 1980). Another three wave gauges (WG04 to WG06 in Figure 4) were located 10 m (prototype scale) in front of the pool, parallel to the quay alignment. These wave gauges were used to measure the agitation and radiation of waves in front of the caisson itself. Axial forces on strands were measured making use of 8 miniature lad cells. The load cells were calibrated before the tests and verified on a regular basis. Each strand in the model was fitted with a load cell, so a complete and simultaneous force time series was obtained for every strand. Axial forces on fenders were measured with a submersible load cell, also calibrated before the tests and verified regularly. Six submersible load cells were used to measure the forces exerted by the caisson displacements onto the quay, so each cell replicates the behaviour of a series of five fenders.
3.
Caisson response tests
3.1 Wave conditions The wave conditions in the model were generated using the segmented wave machine of the TOD, depicted in Figure 4. Long-crested waves have been generated throughout the study. The duration of each was set to 40 minuted model scale (equivalent to 10,733 seconds prototype scale) providing statistically representative wave conditions. A summary of the wave conditions tested, with the corresponding generation parameters, are shown in Table 1. Table 1. Wave conditions tested during the study program.
WAVE
HEIGHT (M)
SIGNIFICANT
PEAK WAVE PERIOD (S)
7
10
12
15
0.50
X
X
X
X
0.75
X
X
X
X
1.00
X
X
X
X
1.20
X
X
X
X
Irregular waves with a Jonswap wave spectra and a peak enhancement factor of 3.3
3.2 Test program Once the model was installed and instruments were calibrated, tests can be performed according to a number of combinations of significant wave height and peak period, as indicated in Table 1. Overall, five different cases of the lowering of the caisson into water have been studied: • Case 1. The caisson is floating without ballast, immersed 4.76m in the water and connected to the strand jack; • Case 2. The caisson is suspended to the strand jacks without ballast and immersed 0.5m in the water; • Case 3. The caisson is suspended to the strand jacks, with a liquid ballasting weight of 2382 Ton and immersed 7.7m in the water; • Case 4. The caisson is floating but not connected to the bridge crane, without ballast, and immersed 4.76m in the water. The caisson also was moored to 4 bollards with mooring lines; • Case 5. The caisson is floating but not connected to the bridge crane, with 1,964 Ton weight ballast and moored to 4 bollards with mooring lines. A total of 66 tests were executed, corresponding to a number of different sea states, with individual time of 40 minutes (model scale). Along each test, the general response of the caisson was observed, paying particular attention to possible excessive motions, lateral hits to the fender system, sloshing, vibrations on the bridge crane, snap loads on the strands and scour at the ballast layer. At the end of each test, the post-processing and analysis of the recorded signals included the estimation of the incident wave height, as well as standard time-domain and frequencydomain analysis statistical methods were applied. As a result, standard parameters have been obtained, including: • Wave conditions: spectral estimate of the significant wave height, Hm0; peak wave period, Tp; significant wave height, H1/3; maximum wave height, Hmax; number of waves, NW;
Forces on strands: maximum force on strand, Smax; average peak force of the largest onethird of peaks on strand, S1/3; average peak force of the largest one-thousand of peaks on strand, S1/1000; average number of peak loads on strand, NS; • Forces on fenders: maximum force on fender, Fmax; average peak force of the largest onethird of peaks on strand, F1/3; average peak force of the largest one-thousand of peaks on fender, F1/1000; average number of loads on fender, NF; • Damage and scour on rock protection and ballast layer: measured by visual observations on the rock revetment, and by standard surveying on the ballast layer. Force values measured on the strand and the fenders have been transformed taking into consideration that each strand in the model represents 66 strands in the prototype (2 bunches of 33 strands), while each fender in the model represents 5 fenders in the prototype. Forces have been also scaled considering the use of fresh water in the model.
•
4.
Results and discussion
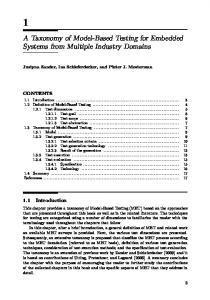
The measured incident wave conditions and the corresponding force on strands as well as the peak forces on the fenders provides a reliable data base for assessing the design loads of the structural elements of the lowering facility. Moreover, the performed tests yield the wave conditions where lowering manoeuvres can be performed safely. For Cases 3 and 5, damage and scour on the ballast layer has also been assessed. 4.1 Strand forces Figure 6 summarises the results of the maximum forces in the strands, separating each test and case by colour and symbol. Figure 6 indicate under which conditions the strands will exceed the service condition, as well as whether there is a condition where the strand may exceed its yielding or breaking loads. 350
Breaking load standard strand
300
Breaking load compact strand
Yield comp strand Yield std strand
FMAX(KN)
250
200
150
100
Service load
50
0 0.4
0.6
0.8
1
1.2
1.4
1.6
Hm0 (m)
Figure 6. Measured maximum strand forces for Cases 1, 2 and 3 relative to the incident significant wave height and peak wave period. Blue lines: Case 1, Dark lines: Case 2, Light green lines: Case 3.
Generally speaking, it can be said that the first case (caisson is floating with no ballast, connected to the strand jack) is the most restrictive, where service loads are exceeded for almost any wave height with peak wave periods longer than 12 s, for waves larger than 80 cm with peak wave periods of 10 s and the forces are not exceeded for waves with peak periods lower than 7 s. Once the lowering condition of Case 1 has been completed, the service loads on the strands are not exceeded for any of the considered conditions. 4.2 Fender loads Figure 7 presents a summary of the measured maximum hit forces on the fenders for all tests. In contrast with the maximum strand forces, maximum fender forces often exceed the service condition. Only during Case 3 and peak wave periods shorter than 7 s, the measurements satisfy the service conditions. Fenders are subject to high impact forces, thus restrictions to lowering operations are higher than for strand forces. Mooring lines have been applied in Cases 3 and 4. Hence, regardless of the test case, service loads are exceeded for almost any situation with waves longer than 10 s.
4000 3500 3000
FMAX (KN)
2500 2000 1500
Break load
1000
Service load
500 0 0.4
0.6
0.8
1
1.2
1.4
1.6
Hm0 (m)
Figure 7. Measured maximum fender loads for Cases 1, 3 and 4 relative to the incident significant wave height and peak wave period. Blue lines: Case 1, Green lines: Case 3, Dark lines: Case 4.
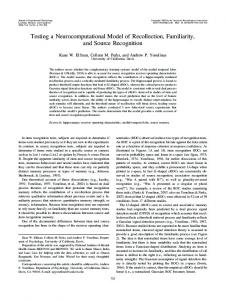
4.3 Damage and scour on rock protection and ballast layer Relative light damage and scour has been observed at the ballast rock layer, produced while the caisson is about to be laid at the bottom. Damage has been inflicted by the motions of the caisson, even while it has been restricted by the mooring lines. The damage consisted in the formation of a ridge around the footprint of the caisson, while scour has been observed underneath the caisson. The ridge is higher along the Eastern side (down-wave), and particularly wide at the Northeast corner. The average height of the ridge is 0.5 m, relative to the initial bed level, along the Western side, and about 1.0 m along the Eastern side. According to the observed results, the ridge is formed outside the caisson footprint, and scour is formed in localised places. Therefore, displacement of the ballast material seems not to
interfere with the levelling of the caisson, while it is lowered and rests at the bottom. Figure 8 presents an image of the ballast rock material at the end of Case 3. In Figure 8, the major scour features are indicated, as well as the different elevations of the bed. No damage to the rock revetment was observed during the test cases.
-5.50 Accretion
Accretion
-6 m Zh contour line Erosion Accretion
Erosion
Accretion
Accretion
Erosion Erosion
-6.74 -6 m Zh contour line
Accretion
Figure 8. Damage assessment of the ballast rock layer at the end of Case 3. Scour (erosion) is seen underneath the caisson, while a ridge (accretion) is mainly found outside the caisson footprint.
4.4 Other observations Occasional overtopping of the quay has been observed in large waves (exceeding 1m), observed along the quay inside the pool as well as at the rock revetment. Sloshing was also observed in the most energetic sea-states. Sloshing and strand snap-loads were observed as consecutive events, where air was trapped under the caisson slab produced by the complex behaviour of the free-surface within the pool.
5.
Conclusions
This study has provided useful information to the designer of the facility as well as the operation team, giving an indication under which conditions the caisson can be lowered safely. Currently, several quadrilobe caissons have been lowered and placed successfully at the Tangier Med 2 Developing Project.
References Mansard, E. and Funke E., 1980. ‘The measurement of incident and reflected spectra using least square method’. Proc. 17th International Conference on Coastal Engineering, Sydney, Australia.