Vol.3, No.10, 837-854 (2011)
Natural Science
doi:10.4236/ns.2011.310109
Groundwater evolution in the Voltaian Basin, Ghana —an application of multivariate statistical analyses to hydrochemical data Sandow Mark Yidana1*, Gerald B. Yiran2, Patrick Asamoah Sakyi1, Prosper M. Nude1, Bruce Banoeng-Yakubo1 1
Department of Earth Science, University of Ghana, Legon, Accra; Corresponding Author:
[email protected],
[email protected] 2 Department of Geography and Resource Development, University of Ghana, Legon, Accra;
[email protected] *
Received 9 September 2011; revised 10 October 2011; accepted 18 October 2011.
ABSTRACT Multivariate statistical methods were applied to hydrochemical data obtained from various field sampling campaigns in order to highlight the major groundwater types and the evolution of groundwater from recharge areas to discharge areas in the groundwater flow regime. Q-mode hierarchical cluster analysis distinguished four major hydrochemical types: Ca-HCO3 low salinity fresh groundwater in the south of the basin, through Na-HCO3 fresh low to intermediate salinity groundwater types, to saline-brackish NaCl groundwater types in the north of the basin. The concentrations of the major hydrochemical parameters also increase from south to north, suggesting that groundwater evolves from apparent recharge areas in the south to salinebrackish Na-Cl groundwater types in the north. On the basis of the observed variation in the hydrochemical data, this study hypothesizes that the southern parts of the basin are the major recharge areas in the basin, whereas the northern sections are discharge locations in the groundwater flow regime. R-mode factor analysis was then applied to the data to differentiate the various factors responsible for the observed hydrochemical variations. Four factors were distinguished: dissolution of chlorides of the major ions, silicate mineral weathering and organic matter oxidation, dissolution of kieserite group of minerals, and anthropogenic contamination. Of all these factors, silicate mineral weathering is the most pervasive throughout the study area. This is apparently due to the presence of silicate minerals almost everywhere in the terrain. This analysis was determined by Copyright © 2011 SciRes.
means of factor scores computed from the factor loadings and the standardized dataset through regression. The resulting refined factor scores were then interpolated by ordinary kriging. The dissolution of the chlorides and kieserite group of minerals are limited to locations where such minerals are present in the lithology. Anthropogenic contamination of the aquifers occurs almost everywhere within the basin but the effects are generally low. Keywords: Hierarchical Cluster Analysis; Factor Analysis; Voltaian Basin; Silicate Weathering
1. INTRODUCTION The processes influencing groundwater hydrochemistry are multivariate in nature and have the potential to vary widely in space and/or time. Therefore studies of these processes necessarily require the application of methodologies which are equally multivariate in nature. This is one of the reasons why multivariate statistical analyses have gained familiarity in hydrogeology and hydrogeochemistry during the past decade. Most multivariate statistical methods are used in a similar fashion as the familiar graphical techniques such as Piper diagrams [1] but with an added advantage of including parameters which are usually not included in the regular Piper diagrams. Multivariate statistical techniques have been used in the literature to facilitate the resolution of geo-environmental problems. The techniques have been used successfully to assist in the understanding of groundwater flow systems [2], and processes influencing groundwater hydrochemistry at the basin and larger regional scales [3-6]. Multivariate statistical methods have also been used to identify major hydrochemical types in regional groundwater systems and to identify and highlight Openly accessible at http://www.scirp.org/journal/NS/
838
S. M. Yidana et al. / Natural Science 3 (2011) 837-854
the major sources of anthropogenic effects on groundwater and surface water quality [7-9]. Cluster and factor analyses are the most commonly used multivariate statistical methods in the geosciences and have proven to be worthy tools in unraveling hidden phenomena in Earth Systems. Both cluster and factor analyses owe their versatility to their inherent ability to place parameters into associations based on similarities and/or dissimilarities in the field. Although statistical associations do not necessarily connote cause-and-effect relationships, they provide clues from which such associations can be derived. Therefore, statistical analyses on their own have little value unless they are used and interpreted in the light of an in-depth knowledge of the system or phenomenon under investigation. The literature is rich in the various innovative applications of cluster and factor analyses in tandem with graphical [2,7] and mass balance techniques [10-12] to resolve hydrochemical phenomena. In this study, R-mode factor analysis and Q-mode hierarchical cluster analysis (HCA) are jointly applied to hydrochemical data from the northern and southern parts of the Voltaian Sedimentary aquifers in Ghana. The objective is to highlight the evolution of groundwater within the basin on a regional scale. Previous studies have been limited to subsections of the basin and have resulted in useful conclusions [12]. This research collates existing hydrochemical data from different sampling regimes on the Voltaian Basin in Ghana to characterize the entire basin’s hydrochemical evolution in space. Factor analysis is used to unveil the hidden structure in the hydrochemical data and enhance the interpretability of the dataset [5,13,14]. It is a data reduction method which derives a subset of uncorrelated factors from the original dataset, to assist in resolving the sources of variation in the dataset. Factor analysis further ranks the hidden sources of variance in the dataset in order of significance such that the first factor represents the most important/significant process(es). The total number of factors derived from a given dataset on a set of variables reflects the possible number of sources of variation in the dataset. Technically, the complete factor model contains as many factors as there are variables. However, such a complete factor model is too clumsy as some of the factors may not actually represent unique sources of variation in the dataset. Cluster analysis is similar in essence and objective to factor analysis. It groups a set of data on variables into associations based on perceived relationships in the field. There are hierarchical and non-hierarchical clustering methods commonly in use. In the hierarchical clustering methods, the final result is a graphical product which shows the genealogical relationship among the variables Copyright © 2011 SciRes.
or cases (samples) [10]. The non-hierarchical methods on the other hand result in similarity matrices through iterative processes. Hierarchical cluster analysis is the most commonly used clustering method and enables a clear differentiation of sample or parameter groups in the dataset into hierarchical associations. In Q-mode HCA, the samples are clustered rather than the parameters; the converse is true for R-mode HCA. Q-mode HCA is the preferred procedure because it provides an avenue for the spatial classification of the samples and thus provides the necessary clues to basin-wide hydrochemical evolution. R-mode factor analysis is then applied to highlight the causes of variation and the spatial variations in the intensities of the various factors responsible for hydrochemical evolution the basin.
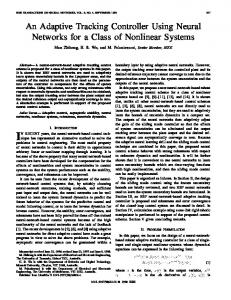
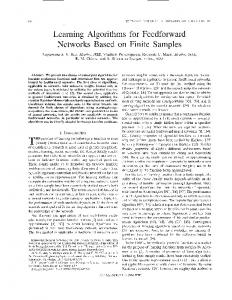
2. THE VOLTAIAN BASIN Almost one third of Ghana is covered by sediments of the inland Voltaian Supergroup which covers an area of about 103,600 km2. The Voltaian strata are nearly horizontal beds of sandstones, shales, mudstones and conglomerates thought to be of Late Precambrian to Paleozoic age [15]. In most places, the flat lying Voltaian strata overlie the Birimian rocks with a marked angular unconformity. Junner and Hirst [16] subdivided the Voltaian sediments on the basis of lithology and field relationships into Lower (Kwahu-Bombouaka Group), Middle (Oti-Pendjari Group) and Upper (Obosum Group) units. The Lower Voltaian sediments (Kwahu—Bombouaka Group) represent a marine transgression-regression cycle on the craton, whereas the Middle Voltaian records a glacial event followed by prolonged marine incursion and subsidence of the basin. In the eastern part of the basin, the adjacent Togo Belt crops out. The Upper Voltaian is thickest and coarsest in the southeast. The conglomerates contain pebbles of granite and other igneous rocks, as well as quartzite fragments. Sedimentary structures show the direction of transport to have been from the southeast. Rocks of the Obosum Group are molasse deposits formed by the erosion of rocks of the Togo Structural Unit, following its uplift in the Pan African event. Banoeng-Yakubo et al. [17] reclassified the hydrogeology of Ghana into five major hydrogeological provinces on the basis of the age, lithology, and the water bearing capacities of the rocks (Figure 1). The Voltaian Basin, comprising the three subdivisions constitutes the Voltaian Province. Although largely sedimentary, primary permeability is virtually non-existent. Therefore the hydrogeological properties of the rocks in the Voltaian Province are owed to the development of secondary permeabilities through fracturing and/or weathering Openly accessible at http://www.scirp.org/journal/NS/
S. M. Yidana et al. / Natural Science 3 (2011) 837-854
of the rocks. The rocks are believed to have lost their primary porosities during the Pan-African tectonic event which partially baked them up. Towards the eastern portions of the basin, the sandstones are partially metamorphosed to quartzitic sandstones. There is a thin saline belt within the Middle Voltaian, which renders the quality groundwater saline in some parts of the basin. This salt bed is mined for table salt in Daboya and other areas. Available data suggest that borehole yield within the Lower Voltaian sub-province ranges between 1 and 9 m3/h with an average of about 6.2 m3/h. On the basis of available data from drilling projects in this sub province, success rate for drilling prolific wells and boreholes is about 55% [18]. Success rate for drilling successful boreholes in the Middle Voltaian sub-province is about 56% and the average borehole yield is about 6.2 m3/h. Borehole discharge characteristics at some locations within this sub province indicates artesian conditions at shallow depths [12]. In the Upper Voltaian sub-province, borehole yields range between 0.41 and 9.0 m3/h and average about 8.5 m3/h. Success rate for drilling successful boreholes is about 56%. The average thickness of the regolith over the Voltaian
839 839
sedimentary rocks is about 9 m. However, previous in vestigations in the Nanumba and West Gonja districts of the northern region of Ghana revealed average regolith thickness of 6 m and 11 m respectively. The relatively thin regolith can be explained by the relatively stable clay (shale) and quartz (sandstone) composition or by the fine texture or ductile nature of the sedimentary rocks found in the Voltaian Province [19]. Deeper seated weathering may occur in areas underlain by arkose or arkosic sandstones such as the Middle Voltaian and are rich in K-feldspar and low temperature plagioclase feldspars. These minerals weather faster than quartz and clay minerals. Underlying fracture systems are commonly developed at depths greater than 20 m below ground surface but on the average, required yields for rural water supplies are obtained above 100 m depth. Borehole data suggest that wells and boreholes in the Voltaian Province are slightly deeper than those in the Birimian. Borehole depths tabulated by [19] range between 45 m and 75 m with a mean depth of 55 m. Fractured rock aquifers in the Voltaian aquifers generally have a low to moderate productivity and overall transmissivity will range from 0.3 m2/d to 267 m2/d with a mean yield of 11.9 m3/d.
Figure 1. The Hydrogeological map of Ghana showing the extent of the Voltaian Basin [17]. Copyright © 2011 SciRes.
Openly accessible at http://www.scirp.org/journal/NS/
840
S. M. Yidana et al. / Natural Science 3 (2011) 837-854
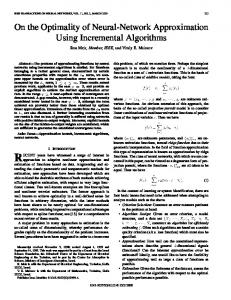
The study area is a small part of the Volta Basin located in the eastern part of Ghana lying between latitudes 6˚48'N and 10˚26'N and longitudes 0˚30'E and 1˚16'W (Figure 2). It is within two major agro-ecological zones namely the interior savannah in the north and the rain forest in the Volta region of Ghana. In between these two major ecological zones lies the forest-savannah transition zone. The annual rainfall ranges from 1000 - 1100 mm in the north to around 1500 - 1600 mm of rain [20]. The annual evapotranspiration values in the area are high in the north ranging from 1800 - 1900 mm to about 1400 - 1500 mm in the south [20]. The topography is generally undulating being relatively flat in the north to highly rugged in the south. The major economic activities of the people include farming, fishing and trading. Farming which is the dominant economic activity in area involves the cultivation of cereals (i.e. maize, millet and rice) and tubers (yam and cassava) [21]. Fishing is largely done along the lake which also serves as a transportation channel for the people.
3. MATERIALS AND METHODS Data for this study were collated from various projects
of World Vision Ghana in the northern and southern parts of the Voltaian. The World Vision Ghana has a fine crop of professionals who strictly adhere to standard groundwater sampling and analytical protocols. The physico-chemical parameters such as pH, Electrical Conductivity (EC), and, alkalinity were measured in the field. Samples for the major ions were preserved in line with the strict protocols spelt out in Appelo and Postma (2005). Data from a total of 392 locations, largely within the Middle Voltaian, and consisting of the concentrations of the major ions sodium (Na+), calcium (Ca2+), magnesium (Mg2+), potassium (K+), bicarbonate ( HCO3 ), chloride (Cl–), and sulfate ( SO 24 ) were obtained from the data archives of the World Vision in the Northern Region of Ghana. The data also includes concentrations of the minor ions nitrate ( NO3 ) and fluoride (F–). Data for each sample were subjected to internal consistency checks through the charge balance error (CBE) calculations (Eq.1). CBE
cations anions 100% cations anions
(1)
where all the concentrations are in meq/L.
Figure 2. A map of Ghana showing the vegetation type in the study area. Copyright © 2011 SciRes.
Openly accessible at http://www.scirp.org/journal/NS/
S. M. Yidana et al. / Natural Science 3 (2011) 837-854
As is consistent with standard practice, data from all samples are required to be electrically balanced, which requires that the CBE should not exceed the absolute value of +/–10%. Optimal multivariate statistical analyses require that the data be normally distributed and homogeneous. However, most geological parameters are positively skewed and structurally inhomogeneous. Therefore data for all the parameters were log-transformed and then standardized to their corresponding z-scores (Eq.2) to approximate the requirements of both normal distribution and homoscedasticity. z
x
(2) where x, μ, and σ are respectively the data, mean and standard deviation of the data. Data standardization is particularly crucial in HCA because the use of the raw non-standardized data in the computation of the Euclidean distances will bias the result in favor of parameters with the highest variances. Factor analysis using principal components as the extraction method, also makes sense when data for the parameters appear similar. With the vastness in the difference in the distribution of the data for the various parameters, standardization to the z-scores ensures some sort of uniformity in their distributions. Data transformation by log-transform and/or standardization to achieve the dual objectives of normal distribution and homoscedasticity are standard practice in the literature [2,3,5, 12,22] and have been found to yield reliable results in multivariate statistical analyses of data. The transformed data for each parameter will then have a mean of 0. Q-mode HCA was then applied to the z-scores. Euclidean distance was used a measure of similarities/dissimilarities of the dataset whilst the Ward’s agglomeration technique was used to link clusters. Using this combination, samples with the greatest similarity in terms of the distribution of the data of their parameters were grouped into the same initial clusters. The groups (or initial clusters) of samples were then grouped together hierarchically using the ward’s linkage method in a sequential fashion until all the samples were grouped. The resulting dendrogram will then contain a hierarchical arrangement of the samples for easy discernment of the spatial patterns in the distribution of parameters. Piper [1] diagrams and linear plots of the major ions were used to facilitate and corroborate the interpretation of the results of the Q-mode HCA. R-mode factor analysis was applied to the transformed dataset to unveil the latent structure in the distribution of the parameters and assist in the identification of the significant processes influencing groundwater hydrochemistry in the Voltaian basin. “Principal components” was Copyright © 2011 SciRes.
841 841
chosen as an extraction method whilst varimax rotation was used to maximize the differentiation of the resulting factors in the factor model. Varimax rotation [23] is the application of an orthogonal matrix to the factor model. It maximizes the variances of the sum of the squared loadings of the parameters under the factors. In the end, the squared correlations of the parameters under the factors will be either large or close to 0. The primary objective of this procedure is to associate each variable with at most one factor, thus simplifying the interpretation of the resulting factor model. The Kaiser criterion [23] was used to ward off non-unique factors in the final factor model. It requires that worthy factors in the factor model should each have an eigenvalue of at least 1. In essence, the implication is that a worthy factor in the final factor model should be able to explain the variance of at least one original variable/parameter. Practically, it is possible to obtain as many factors in factor analysis as there are parameters or variables. However, extracting factors in this fashion will complicate the interpretation of the final result since most of the factors will represent non-unique processes which are difficult to identify and explain. As the objective of factor analysis is to highlight the primary processes influencing basin-wide groundwater hydrochemistry, the application of the Kaiser [23] criterion was satisfactory. In addition, efforts were made to exclude variables which did not add to the validity and interpretability of the factor model. This decision was made using the communalities of the parameters. The communality of a parameter in factor analysis is the sum of the squares of the loadings of the parameter/variable under each of the factors. The maximum communality of a variable is 1 whilst the lowest is 0. In this research, a parameter with unique contribution to the factor model should have a communality of at least 0.50 (or 50%). Parameters/variables with lower communalities were dropped and the process was repeated. Dropping parameters with non-unique contribution to the factor model made significant changes in the distribution of the parameters under each factor and improved upon the total percentage variance explained by the final factor model. Factor scores were computed from the resulting factor model through the regression approach. Factor scores are produced by multiplying standardized variable scores by standardized scoring coefficients. In the least squares regression approach [24], factor scores are predicted for the location of each individual variable on the factor or principal component. The least square regression method is one of the three popular refined methods of estimating factor scores in factor analysis. The advantage of the refined procedure over the non-refined ones is the fact that they offer opportunities for the computation of exact factor scores for each individual sample location. The Openly accessible at http://www.scirp.org/journal/NS/
842
S. M. Yidana et al. / Natural Science 3 (2011) 837-854
independent variables in the regression process are the standardized observed values of the items in the estimated factors or components [25], and the factor scores are the dependent variables. These predictor variables (independent variables) are weighted by regression coefficients which are obtained by multiplying the inverse of the variable correlation matrix by the matrix of the factor loadings. The resulting factor scores (by factor) have a mean of 0 and standard deviation of 1 (if principal components are used). Ordinary kriging was then used to produce spatial maps of the distribution of factor scores in the study area. All the multivariate statistical analyses were done using SPSS version 17. The factor maps were produced from ArcGIS 9.3 [26]. The distribution of the factor scores in space provided a means of assessing the severity of each process in the field and therefore assisted in the determination of the significance of each of the processes in space. Factor scores higher than 0 generally signify the severity of the process or set of processes represented by the factor in question at the location under consideration. The converse is true for factor scores less than 0.
4. RESULTS AND DISCUSSIONS 4.1. General Distribution in the Concentrations of the Major Parameters All the major parameters display high variances in
terms of their distribution in the basin (Table 1). The high variances indicate the general variability in the sources of variation in these parameters within the basin especially between the northern and southern portions of the basin. The EC ranges in value between 41.30 μS/cm to 14,180 μS/cm with a mean of 1000.39 μS/cm. More than 50% of the data on EC are below the mean, suggesting that the sources of the extremely high EC values are discrete in space and are probably associated with certain lithologies and /or anthropogenic impacts which are dispersed in space. The highest EC values were recorded in the northern parts of the basin. For instance the highest value of 14,180 μS/cm was recorded in Nanton of the Savelugu Nanton district of the northern region. This sample has also been noted for one of the highest Cl– and Na+ concentrations, suggesting that variations in the EC may be associated with increases in the concentrations of these ions in the groundwater system. The same trend is observed across the basin especially in the northern parts where the EC values are noticeably higher than what pertains in the south of the basin. The high salinities and the concomitant effect on the taste and aesthetic character of the water from some of these wells render them unappealing for various uses. Where the EC values are extremely high as in the cases of well number 0901C1/C26B1 (14,180 μS/cm), 0901C1/C27B2 (13,420 μS/cm), well number 0901C1/C27B1 (11,180 μS/cm), all at Nanton, the pH is near neutral to slightly alkaline. However, there is no apparent dependence of EC on the pH of groundwater from the basin.
Table 1. Statistical summary of the concentrations of the major parameters. Parameter
Minimum
Maximum
Mean
EC (µS/cm)
41.30
14180.00
1000.39
pH
5.94
11.20
7.37
2.90
832.00
355.59
1.30
737.00
22.00
Cl− (mg/L)
2.00
4998.00
135.46
NO3 (mg/L)
0.01
250.00
4.88
0.00
7.30
0.14
0.01
8.12
1.00
Ca (mg/L)
3.20
866.00
44.96
Mg2+ (mg/L)
0.50
106.00
15.63
Na (mg/L)
7.10
2489.00
152.20
K+ (mg/L)
0.10
177.00
3.36
SiO2 (mg/L)
5.00
112.00
41.16
HCO3 SO
2 4
PO
3 4
(mg/L) (mg/L)
(mg/L)
F− (mg/L) 2+
+
Copyright © 2011 SciRes.
Openly accessible at http://www.scirp.org/journal/NS/
S. M. Yidana et al. / Natural Science 3 (2011) 837-854
Nitrate is usually regarded as a minor constituent of most natural water systems and owes its presence in most cases to anthropogenic impacts or contamination. In the Voltaian Basin, the highest NO3 concentration of 250 mg/L is five times higher than the recommended WHO [27] maximum permissible limit of 50 mg/L in drinking water. Apparently, this sample was also taken from well 090A4/D82B2 at Nanton, where the EC value is 1453 μS/cm. The next highest NO3 value of 244 mg/L was also recorded in Nanton at 0901A4/D82B1 where the EC is 940 μS/cm. There is therefore no obvious relationship between EC and NO3 in groundwater from the basin. The high NO3 values probably result from localized anthropogenic contamination sources, and may signify instances of contamination at the wellhead or instances where open wells are improperly abandoned. The highest fluoride concentrations in the basin are also associated with wells in the northern sector. The highest F– concentration of 8.13 mg/L, which is over 5 times the maximum permissible limit of 1.50 mg/L [27] in potable water, was observed at well number WVI 2361 at Bulkpam in the Saboba district of the Northern Region. There are other scattered cases of high F– in groundwater from the northern parts of the basin, but the average concentration in the entire basin is 1.00 mg/L (Table 1), which is due to generally low values from the southern parts of the basin. Apambire et al. [28] attribute high concentrations of F– in groundwater in the Bongo granites of the Upper East Region of Ghana to the dissolution of fluorite from the rocks. In the study area, the high content of fluoride in some locations might be due to the dissolution of villiamite (NaF) and fluorite (CaF2), which have been noted in the lithology as accessory minerals. High F– could also accrue from anion exchange
843 843
processes in the aquifers. The distribution in the concentrations of SO 24 in the basin takes a similar trend as the one observed for NO3 . The ion ranges in concentration between 1.30 mg/L at WVI 716 at Mame Krobo in the southern Voltaian at the Afram Plains area, and 737 mg/L at WVI 4600 in Jangbojado, also in the Saboba district in the Northern Region. The average SO 24 concentration is however 22.0 mg/L, which is lower than the maximum permissible limit of 250 mg/L (WHO, 1984) in drinking water.
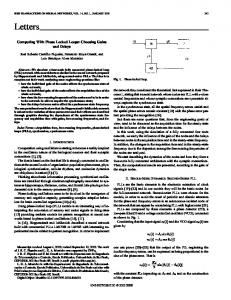
4.2. Spatial Groundwater Types and Groundwater Evolution in the Voltaian The dendrogram resulting from Q-mode HCA is presented in Figure 3. As is obvious, four spatial groundwater types have been highlighted. The phenon line was drawn across the dendrogram at a linkage distance of 8. The position of the phenon line, which determines the number of clusters distinguishable from cluster analysis, is somewhat subjective because there are no fixed laws that determine the optimum position of this imaginary line. The line can be moved up or down the dendrogram to yield less or more clusters. In choosing the position of the phenon line in Q-mode HCA, the researcher is guided by the objectives of the study and his/her understanding of the multiplicity of the underlying processes. Too many clusters can invalidate the general objective of cluster analysis of reducing the dimensionality of a dataset. On the other hand, if the phenon line is positioned in such a way as to result in too few clusters, most of the underlying field associations or processes would be missed.
Figure 3. A dendrogram resulting from the Q-mode HCA. Copyright © 2011 SciRes.
Openly accessible at http://www.scirp.org/journal/NS/
844
S. M. Yidana et al. / Natural Science 3 (2011) 837-854
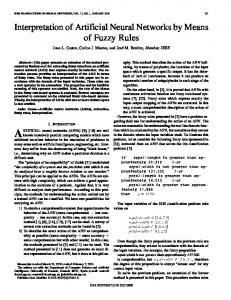
The median concentrations of all parameters for the membership of the four clusters were plotted in a Piper [1] diagram as presented in Figure 4. Cluster 1 represents freshwater Ca-HCO3 water types with low TDS content. The membership of this group are drawn from the southern Voltaian in the Afram Plains area, and are characterized by relatively low EC values which translate into low TDS values (Figure 3). Cluster 4 members are relatively higher TDS freshwater than observed in cluster 1 and represent Na-HCO3 water types in the basin. As is obvious in Figure 4, cluster 4 represents an intermediate water type and connotes a transition between clusters 1 and 3 on one hand and cluster 2 on the other hand. Cluster 2, which has the highest TDS of all the four clusters, represents Na-Cl water types. It represents characteristically terminal water types in the groundwater flow regime on account of both the TDS content, the concentrations of the individual parameters, and the groundwater type. There is therefore an apparent evolution of groundwater from fresh Ca-HCO3 types through Na-HCO3 types to brackish-saline Na-Cl groundwater types in the Voltaian basin. Although there has been no detailed modeling of the groundwater flow regime in the Voltaian, the differentiation revealed by the Q-mode HCA appears to indicate
the important stages within the groundwater flow regime. Figure 5 shows the spatial distribution of the membership of each of the four clusters. Clusters 1 and some cluster 3 members are in the Afram Plains area and represent the freshest groundwater types delivered by aquifers of the Voltaian basin in Ghana. These are areas where the concentrations of the major parameters that determine the suitability of groundwater for many uses are also very low and within acceptable limits for human consumption. The rest of the cluster 3 members were drawn from the Saboba—Chereponi areas of the Northern region. Cluster 2 has only three members, two of which are located in Nanton, close to Tamale the regional capital of the Northern Region, and highlight the locations of high concentrations of Na+ and Cl– ions in groundwater. Cluster 4 members are spatially located around Tamale. All the samples were largely drawn from the Middle Voltaian, which represents the most extensive sedimentary sequence in the Voltaian in particular and in Ghana in general. Previous studies [12,29] attribute the Na-HCO3 groundwater types to the result of ion exchange reactions whereby Ca-HCO3 evolve to Na-HCO3 through interaction with Na-Cl water types. In that respect, it can be conceptualized from the outcome of the HCA in this study that the southern part of the Voltaian
Figure 4. A piper diagram showing the median concentrations of the membership of the four cluster in Figure 3. Copyright © 2011 SciRes.
Openly accessible at http://www.scirp.org/journal/NS/
845 845
S. M. Yidana et al. / Natural Science 3 (2011) 837-854
Figure 5. Spatial distribution of the clusters in the study area. Table 2. (a) Factor loadings matrix from the R-mode Factor Analysis; (b) Total Variance explained by the factors. (a) Factor
Parameter
1
2
EC
0.976
pH
0.097
HCO
3
SO 24
3
4
0.133
0.129
–0.008
0.913
–0.023
–0.117
–0.273
0.621
0.435
–0.279
0.097
0.108
0.713
–0.064
Cl–
0.995
0.033
0.020
0.009
NO3
–0.054
–0.012
0.079
0.961
Ca2+
0.940
–0.107
0.113
0.043
Mg2+
0.180
–0.234
0.797
0.258
+
Na
0.940
0.244
0.081
–0.056
SiO2
–0.288
–0.799
0.150
–0.261
(b) Factor
Initial Eigenvalues
Extraction Sums of Squared Loadings
Rotation Sums of Squared Loadings
Total
% of Variance
Cumulative %
Total
% of Variance
Cumulative %
Total
% of Variance
Cumulative %
1
4.060
40.602
40.602
4.060
40.602
40.602
3.921
39.207
39.207
2
1.976
19.757
60.359
1.976
19.757
60.359
2.013
20.133
59.340
3
1.356
13.560
73.919
1.356
13.560
73.919
1.398
13.985
73.325
4
1.099
10.992
84.911
1.099
10.992
84.911
1.159
11.586
84.911
Copyright © 2011 SciRes.
Openly accessible at http://www.scirp.org/journal/NS/
846
S. M. Yidana et al. / Natural Science 3 (2011) 837-854
represents recharge areas within the Middle Voltaian. In the absence of significant anthropogenic contributions to the total dissolved content of groundwater in the Voltaian, the relatively low TDS values recorded in the Afram Plains areas suggest low residence times, leading to a low period of interaction between the rock mass and groundwater. As it evolves through the intermediate zones to discharge areas in the north, there is a gradual increase in the TDS content of groundwater.
4.3. Processes Controlling the Hydrochemistry The R-mode factor analysis resulted in four factors which cumulatively account for 84% of the total variance in the hydrochemistry (Table 2). The F– was dropped in the process of the analyses since it recorded a communality lower than 0.50. In factor analysis, variables with communalities lower than 50% do not register any significant loading under any of the factors and are therefore regarded as redundant variables. Factor 1 has high positive loadings for EC, Na+, Ca2+, and Cl–, and accounts for over 40.6% of the total variance in the hydrochemistry. It represents the dissolution of the metal ion chlorides in the aquifers. The saline beds are the principal sources of these chlorides in the Middle Voltaian. In some places such as Daboya and other areas, these salts are being commercially mined and are responsible for saline-brackish groundwater in the Voltaian Basin. Factor 2 records high positive correlations with pH, and HCO3 and negative correlation with SiO2. This implies that the principal source of the HCO3 ion in groundwater from the basin is not the incongruent weathering of silicate minerals, but a process which is orthogonal to silicate mineral weathering. Such a process is accompanied by increasing pH and is probably the dissolution of carbonate minerals from some of the rocks in the area and the oxidation of organic carbon by nitrate reduction [30]. The dissolution of carbonate minerals requires low pH and results in the elevation of the pH of the medium. The negative loading of SiO2 to factor 2 also suggests the weathering of silicate minerals in the aquifers. Previous work in the southern part of the Voltaian [12,29,31] suggested the incongruent weathering of silicate minerals as the primary process influencing groundwater hydrochemistry in the area. They also suggested cation exchange as a significant process in the aquifers. In the current study, a plot of Ca2+ + Mg2+ (mmol/L) against HCO3 + SO 24 (mmol/L) suggest the contribution of cation exchange to a possible reduction in the content of the alkaline earth elements in groundwater from the aquifers (Figure 6). Almost all the samples in Figure 6 plot towards the HCO3 + SO 24 side of the equiline suggesting excess Copyright © 2011 SciRes.
HCO3 + SO 24 over the alkaline earth elements. In the context of the study area, several factors could be adduced to account for this observation. Yidana [30] suggested the contribution of organic matter oxidation by nitrate ( NO3 ) to the HCO3 content of groundwater from some sections of northern Ghana including the northern parts of the Voltaian. His study indicated an apparent negative correlation between HCO3 ion and NO3 which suggested a decrease in the latter in favor of the former in places. Although such a strong relationship was not very clear in this study, there is some contribution from organic matter oxidation. There is a negative correlation between the NO3 and HCO3 in Table 3, and although NO3 does not load significantly under factor 2 in Table 2, its negative loading suggests an inverse relationship with HCO3 . There is therefore some contribution of the HCO3concentration in groundwater from the Voltaian, which results from the oxidation of organic matter by NO3- and other stronger oxidizing agents. There is a strong correlation between SO 24 and K+ in Table 3, which suggests the effects of agricultural chemicals. The K+ ion is absent in the final factor model due to a low communality. Spatially, the SO 24 ion content of groundwater in the Voltaian is generally very low when compared with the HCO3 . The HCO3 + SO 24 quantity is therefore largely due to the variations in the HCO3 ion. A comparison of the relationship between Na + K-Cl and Ca + Mg-HCO3-SO4 has been used in the literature to indicate attribute hydrochemical behavior of the major ions in groundwater to cation exchange processes. The Na + K-Cl parameter represents the contribution of sources other than the dissolution of chlorides to the concentrations of Na+ and K+ ions in water. Similarly, the Ca + Mg-HCO3-SO4 term represents the contribution of the
Figure 6. Scatter plot of HCO3 + SO 24 against Ca2+ + Mg2+. Openly accessible at http://www.scirp.org/journal/NS/
847 847
S. M. Yidana et al. / Natural Science 3 (2011) 837-854 Table 3. Correlation matrix from the parameters. EC
pH
ALKA
HCO3
SO 24
Cl–
NO3
F–
Ca2+
Mg2+
Na+
K+
SiO2
EC
1.000
0.169
–0.110
–0.063
0.141
0.981
–0.028
0.121
0.819
0.229
0.972
0.037
–0.294
pH
0.169
1.000
–0.003
0.374
0.223
0.087
–0.113
0.311
0.063
–0.223
0.254
0.246
–0.619
–0.110
–0.003
1.000
0.665
0.027
–0.203
–0.155
0.152
–0.177
0.163
–0.076
–0.085
0.348
–0.063
0.374
0.665
1.000
–0.029
–0.215
–0.165
0.121
–0.259
0.100
0.014
–0.143
–0.139
0.141
0.223
0.027
–0.029
1.000
0.075
0.012
0.177
0.327
0.300
0.123
0.674
–0.101
Cl
0.981
0.087
–0.203
–0.215
0.075
1.000
–0.027
0.075
0.820
0.180
0.956
0.015
–0.248
NO3
–0.028
–0.113
–0.155
–0.165
0.012
–0.027
1.000
–0.053
0.004
0.233
–0.062
0.034
–0.092
0.121
0.311
0.152
0.121
0.177
0.075
–0.053
1.000
–0.041
–0.131
0.170
–0.006
–0.197
Ca2+
0.819
0.063
–0.177
–0.259
0.327
0.820
0.004
–0.041
1.000
0.340
0.713
0.407
–0.156
2+
0.229
–0.223
0.163
0.100
0.300
0.180
0.233
–0.131
0.340
1.000
0.115
0.118
0.184
0.972
0.254
–0.076
0.014
0.123
0.956
–0.062
0.170
0.713
0.115
1.000
0.000
–0.349
K
0.037
0.246
–0.085
–0.143
0.674
0.015
0.034
–0.006
0.407
0.118
0.000
1.000
–0.089
SiO2
–0.294
–0.619
0.348
–0.139
–0.101
–0.248
–0.092
–0.197
–0.156
0.184
–0.349
–0.089
1.000
ALKA HCO
3
SO 24 –
–
F
Mg
Na+ +
main alkaline earth elements from sources other than the dissolution of the sulfates and carbonates of these elements. A linear plot of these terms provides clues on the contribution of cation exchange to the balance of the alkali and alkaline earth elements [29,32,33]. Figure 7 shows the relationship between these parameters for groundwater from the Voltaian. Generally, the consensus is that if the data plot on line with a slope of –1, and away from the origin, cation exchange can be adduced to account for the distribution in the concentrations of the alkali and alkaline earth elements. The scientific rationale is that whereas silicate mineral weathering is the other major source of the major cations in groundwater systems, an inverse relationship of the alkali and alkaline earth elements implies that an increase in the alkali element leads to a decrease in the alkaline earth elements and vice versa. Such a relationship is occurs when cation exchange takes place. In the current study, the slope of the line is almost –1. In addition, most of the data plot outside of the origin, suggesting that cation exchange is a significant process in the hydrochemistry of groundwater in the Voltaian. This is in agreement with the findings of Yidana and Yidana [29] in the southern Voltaian. Cation exchange sites generally exhibit preference for the ions of the alkaline earth elements over those of the alkali elements [34-36]. In this case, Ca2+ and Mg2+ are being adsorbed whilst the Na+ and K+ ions are being released in the groundwater system. This is the most likely explanation for the observed relationship in Figure 7. Copyright © 2011 SciRes.
Figure 8(a) further corroborates the analyses provided above on the relationship between the alkali and alkaline earth elements. Almost all the data plot on the 1:1 line suggesting that the total cation concentration of groundwater in the Voltaian is largely attributed to the alkali elements. This apparent dominance of the alkali over the alkaline earth elements accrues from the effects of cation exchange processes. Obviously in Figure 8(b), the entire data plot above the equiline and far towards the TZ+ side. This buttresses the assertions of the effects of cation exchange on the concentrations of the ions of the alkaline earth elements.
Figure 7. Scatter plot of Ca + Mg-SO4-HCO3 against Na + K-Cl. Openly accessible at http://www.scirp.org/journal/NS/
848
S. M. Yidana et al. / Natural Science 3 (2011) 837-854
(a)
(b)
Figure 8. (a) Scatterplot of total cations (TZ+) against Na + K; (b) Scatterplot of total cations (TZ+) against Ca + Mg.
Factor 3 has high positive loadings for Mg2+ and SO 24 and accounts for 13.6% of the total variance in the hydrochemistry of groundwater in the basin. It represents the dissolution of kiesierite and other magnesium sulfates in the aquifers. Studies of the genesis of the rocks of the Voltaian suggest marine influence, which partly explains the presence of the saline belts in Daboya and other areas. Kiesierite is a marine evaporite which results from the accumulation and evaporation of seawater. Detailed studies of the geochemistry of rocks of the Voltaian were not within the scope of this research. However, kiesierite is highly suspected in the Voltaian. The last factor accounts for 11% of the hydrochemistry and has high positive loading for the NO3 , suggesting anthropogenic impacts on groundwater hydrochemistry in the Voltaian basin. Both organic and inorganic fertilizers are used extensively in farms to improve upon crop yields. In addition, open defecation and improper disposal of domestic waste have been the major environmental problems in some of the rural communities underlain by rocks of the Voltaian in Ghana. Shallow dugouts in some farming communities in the basin often serve as open conduits for the transport of contaminants into aquifers, leading to their contamination. Factor scores usually provide measures of the actual impacts of the processes represented by each of the factors at the various sampled locations. Where the scores are positive, the effects of the factor are high. Negative factor scores suggest low to no appreciable impacts of the factor. Figure 9 presents the distribution of the factor scores of all the four factors in the basin. The spatial distribution of the factor scores was determined through ordinary kriging. The impacts of factor 1, the dissolution of the chlorides of the major cations, are severest in the northwestern parts of the basin, where the saline beds Copyright © 2011 SciRes.
show significant effects on groundwater hydrochemistry. As a result, the factor scores in these areas (Figure 9(a)) are high. The scores for factor 1 at all other locations in the basin are low, suggesting that the impacts of factor 1 are quite discrete and restricted. The impacts of factor 2 are very pervasive in the study area. This is because silicate mineral weathering is an important process in the hydrochemistry of groundwater in the basin. This fact has been underscored by various researchers in the past [12,29,31] for the southern Voltaian. Yidana et al. [12] used mineral stability diagrams to indicate that groundwater from the aquifers of the Middle Voltaian in the Afram Plains is stable within the montmorillonite field, suggesting restricted groundwater flow. Factor scores for factor 3 generally range between –1.5 in the south to about 2 in the north. The highest effects are within the Middle and Lower Voltaian aquifers in the north, where the effects of kiesierite dissolution are suspected to be highest within the entire basin. The effects of anthropogenic contamination (Figure 9(d)) are obvious throughout the basin but are generally minimal. Factor scores generally range between –0.5 and 1.0 which suggest weak influences of anthropogenic contamination. The highest effects appear to be concentrated in the northwestern corner of the basin, apparently at the fringes of the Middle Voltaian and into some parts of the Upper Voltaian sandstone aquifers. Effects of anthropogenic impacts will generally be high in areas where the thickness of the overburden is low and where agricultural activities are intense with the application of both organic and inorganic fertilizers.
5. CONCLUSIONS Spatial classification of groundwater in the Voltaian Openly accessible at http://www.scirp.org/journal/NS/
S. M. Yidana et al. / Natural Science 3 (2011) 837-854
849 849
(a1)
(a2)
Copyright © 2011 SciRes.
Openly accessible at http://www.scirp.org/journal/NS/
850
S. M. Yidana et al. / Natural Science 3 (2011) 837-854
(b1)
(b2)
Copyright © 2011 SciRes.
Openly accessible at http://www.scirp.org/journal/NS/
S. M. Yidana et al. / Natural Science 3 (2011) 837-854
851 851
(c1)
(c2)
Copyright © 2011 SciRes.
Openly accessible at http://www.scirp.org/journal/NS/
852
S. M. Yidana et al. / Natural Science 3 (2011) 837-854
(d1)
(d2)
Figure 9. (a1) Distribution of factor 1 scores in the northern part of the Volta Basin, (a2) Distribution of factor 1 scores in the south of the basin; (b1) Distribution of factor 2 scores in the north of the basin, (b2) Distribution of factor 2 scores in the south of the basin; (c1) Distribution of factor 3 scores in the north of basin, (c2) Distribution of factor 3 scores in the south of the basin; (d1) Distribution of factor 4 scores in the north of the basin, (d2) Distribution of factor 4 scores in the south of the basin. Copyright © 2011 SciRes.
Openly accessible at http://www.scirp.org/journal/NS/
S. M. Yidana et al. / Natural Science 3 (2011) 837-854
Basin has been conducted using factor and cluster analyses. Four groundwater types have been differentiated on the basis of Q-mode HCA: Ca-HCO3 in the south evolves through Na-HCO3 to Na-Cl in the north. The salinity of groundwater increases as it evolves from the recharge type waters (where the TDS is low) through the intermediate type Na-HCO3 waters to the discharge type Na-Cl (where the TDS is highest in the basin and the water is saline-brackish) waters in the northern parts of the basin. This research hypothesizes on the basis of the findings from the HCA, that the major recharge areas within the Voltaian Sedimentary basin are in the southern Voltaian, where groundwater is the freshest, with generally low concentrations of the major ions and other parameters. This research also finds that there are four major factors responsible for hydrochemical variation in the entire basin. These include the dissolution of the chlorides of the major ions, silicate mineral weathering and oxidation of organic matter by nitrate and other oxidizing agents, the dissolution of kieserite group of minerals, and various aspects of anthropogenic contamination. Factor scores computed through the regression procedure suggest that silicate mineral weathering is very pervasive process, affecting groundwater hydrochemistry in the entire basin. Other mineral dissolution processes are restricted and confined to locations where such minerals are present in the lithology. The pervasiveness of silicate mineral weathering suggests that silicate minerals are present almost everywhere within the rocks. This is consistent with the known mineralogy of the rocks of the Voltaian Basin.
[4]
[5]
[6]
[7]
[8]
[9]
[10]
6. ACKNOWLEDGEMENTS The authors are grateful to the World Vision Ghana for the hydro-
[11]
chemical data from the southern part of the Voltaian. They are equally grateful to the Northern Regional Hydrogeologist of the Community Water and Sanitation Agency for support with hydrochemical data from the northern parts of the Voltaian.
[12]
REFERENCES [1] [2]
[3]
Piper, A.M. (1944) A graphic procedure in the geochemical interpretation of water-analyses. American Geophysical Union, San Francisco, Papers, Hydrology, 914-923. Cloutier, V., Lfebvre, R., Therrien, R. and Savard, M.M. (2008) Multivariate statistical analysis of geochemical data as indicative of the hydrogeochemical evolution of groundwater in a sedimentary rock aquifer system. Journal of Hydrology, 353, 294-313. doi:10.1016/j.jhydrol.2008.02.015 Güler, C., Thyne, G.D., McCray, J.E. and Turner, A.K. (2002) Evaluation of graphical and multivariate statistical methods for classification of water chemistry data.
Copyright © 2011 SciRes.
[13]
[14] [15] [16]
853 853
Hydrogeology Journal, 10, 455-474. doi:10.1007/s10040-002-0196-6 Farnham, I.M., Johannesson, K.H., Singh, A.K., Hodge, V.F. and Stetzenbach, K.J. (2003) Factor analytical approaches for evaluating groundwater trace element chemistry data. Analytical Chimica Acta, 490, 123-138. doi:10.1016/S0003-2670(03)00350-7 Yidana, S.M., Ophori, D. and Banoeng-Yakubo, B. (2008a) A multivariate statistical analysis of surface water chemistry data—The Ankobra Basin, Ghana. Journal of Environmental Management, 86, 80-87. doi:10.1016/j.jenvman.2006.11.023 Yidana, S.M., Banoeng-Yakubo, B. and Akabzaa, T.M. (2010) Analysis of groundwater quality using multivariate and spatial analyses in the Keta basin, Ghana. Journal of African Earth Sciences, 58, 220-234. doi:10.1016/j.jafrearsci.2010.03.003 Banoeng-Yakubo, B., Yidana, S.M. and Nti, E. (2009) An evaluation of the genesis and suitability of groundwater for irrigation in the Volta Region, Ghana. Environmental Geology, 57, 2005-1010. doi:10.1007/s00254-008-1385-y Jiang, Y., Wu, Y., Groves, C., Yuan, D. and Kambesis, P. (2009) Natural and anthropogenic factors affecting groundwater quality in the Nandong karst underground river system in Yunan, China. Journal of Contaminant Hydrology, 109, 49-61. doi:10.1016/j.jconhyd.2009.08.001 Kim, K.-H., Yun, S.-T., Choi, B.-Y., Chae, G.-T., Joo, Y., Kim, K. and Kim, H.-S. (2009) Hydrochemical and multivariate statistical interpretations of the spatial controls of nitrate concentrations in a shallow alluvial aquifer around oxbow lakes (Osong area, central Korea). Journal of Contaminant Hydrology, 107, 114-127. doi:10.1016/j.jconhyd.2009.04.007 Mahlnecht, J., Steinch, B. and Navarro de León, I. (2004) Groundwater chemistry and mass transfers in the Independence aquifer, central Mexico, by using multivariate statistics and mass-balance models. Environmental Geology, 45,781-795. doi:10.1007/s00254-003-0938-3 Helstrup, T., Jørgensen, N.O. and Banoeng-Yakubo, B. (2007) Investigation of hydrochemical characteristics of groundwater from Cretaceous—Eocene limestone aquifers in southern Ghana and Togo using hierarchical cluster analysis. Hydrogeology Journal, 15, 977-989. doi:10.1007/s10040-007-0165-1 Yidana, S.M., Ophori, D. and Banoeng-Yakubo, B. (2008b) Hydrochemical evaluation of the Voltaian system—The Afram Plains area, Ghana. Journal of Environmental Management, 88, 697-707. doi:10.1016/j.jenvman.2007.03.037 Anazawa, K. and Ohmori, H. (2005) The hydrochemistry of surface waters in Andesitic Volcanic area, Norikura volcano, central Japan. Chemosphere, 59, 605-615. doi:10.1016/j.chemosphere.2004.10.018 Brown, C.E. (1998) Applied multivariate statistics in geohydrology and related sciences. Springer, New York. Kesse, G.O. (1985) The mineral and rock resources of Ghana. A.A, Balkema, Rotterdam. Junner, N.R. and Hirst, T. (1946) The geology and hydrogeology of the Volta Basin. Gold Coast Geological Survey, Memoir 8. Openly accessible at http://www.scirp.org/journal/NS/
854
S. M. Yidana et al. / Natural Science 3 (2011) 837-854
[17] Banoeng-Yakubo, B., Yidana, S.M., Ajayi, J.O., Loh, Y. and Asiedu, D. (2010) Hydrogeology and groundwater resources of Ghana: A review of the hydrogeological zonation of Ghana. In McMann, J.M., Ed., Potable Water and Sanitation, Nova Science Publishers. [18] Dapaah-Siakwan, S. and Gyau-Boakye, P. (2000) Hydrogeologic framework and borehole yields in Ghana. Hydrogeology Journal, 8, 405-416. doi:10.1007/PL00010976 [19] Carrier, MA, Lefebvre, R., Racicot, J. and Asare, E.B., (2008) Northern Ghana hydrogeological assessment project. 33rd WEDC International Conference, Accra, 7-11 April 2008. [20] Ghana Meteorological Agency (2010) Synoptic weather stations data. Unpublished, Accra. [21] Ghana Statistical Service (2000) 2000 population and housing census. Accra. [22] Güler, C. and Thyne, G.D. (2004) Hydrologic and geologic factors controlling surface and Groundwater chemistry in Indian wells—Owens Valley area, southeastern California, USA. Journal of Hydrology, 285, 177-198. doi:10.1016/j.jhydrol.2003.08.019 [23] Kaiser, H.F. (1960) The application of electronic computers to factor analysis. Educational and Psychological Measurement, 20, 141-151. doi:10.1177/001316446002000116 [24] Thurstone, L.L. (1935) The vectors of mind. University of Chicago Press, Chicago, 226-231. [25] DiStefano, C., Zhu, M. and Mindrilá, D. (2009) Understanding and using factor scores: Considerations for applied researcher. Practical Assessment, Research & Evaluation, 14. [26] ArcGIS 9.3 (2009) Geocoding technology. ESRI, New York. [27] WHO (World Health Organization) (1984) Guidelines for drinking water quality. Recommendations, Vol. 1, Ge-
Copyright © 2011 SciRes.
neva. [28] Apambire, N.B, Boyle, R. and Michel, F.A. (1997) Geochemistry, genesis, and health implication of Fluoriferous groundwaters in the upper region of Ghana. Environmental Geology, 33, 13-24. doi:10.1007/s002540050221 [29] Yidana, S.M. and Yidana, A. (2010) Assessing groundwater quality using water quality index and multivariate statistical analysis—The Voltaian basin, Ghana. Journal of Environmental Earth Science, 59, 1461-1473. doi:10.1007/s12665-009-0132-3 [30] Yidana, S.M (2011) Hydrochemical characterization of aquifers using sequential multivariate analysis and Geographical Information Systems in a tropical setting. Journal of Environmental Engineering, 137, 258-273. doi:10.1061/(ASCE)EE.1943-7870.0000329 [31] Acheampong, S.Y. and Hess, J.W. (1998) Hydrogeological and hydrochemical framework of the shallow groundwater system in the southern Voltaian sedimentary basin, Ghana. Hydrogeology Journal, 6, 527-537. doi:10.1007/s100400050173 [32] Wen, X., Wu, Y., Zhang, Y. and Liu, F. (2005) Hydrochemical characteristics and salinity of groundwater in the Ejina Basin, Northwestern China. Environmental Geology, 48, 665-675. doi:10.1007/s00254-005-0001-7 [33] Kortatsi, B.K (2007) Hydrochemical framework of groundwater in the Ankobra Basin, Ghana. Aquatic Geochemistry, 13, 41-74. doi:10.1007/s10498-006-9006-4 [34] Fitts, C.R. (2002) Groundwater science. Academic Press, New York. [35] Appelo, C.A.J. and Postma, D. (2005) Geochemistry, groundwater and pollution. 2nd Edition, A.A, Balkema, Rotterdam. doi:10.1201/9781439833544 [36] Hiscock, K.M. (2005) Hydrogeology: Principles and practice. Blackwell Publishing, Oxford.
Openly accessible at http://www.scirp.org/journal/NS/