Mark, Patrick Barry (2008) Redefinition of uraemic cardiomyopathy with cardiac magnetic resonance imaging. PhD thesis.
http://theses.gla.ac.uk/65/
Copyright and moral rights for this thesis are retained by the author A copy can be downloaded for personal non-commercial research or study, without prior permission or charge This thesis cannot be reproduced or quoted extensively from without first obtaining permission in writing from the Author The content must not be changed in any way or sold commercially in any format or medium without the formal permission of the Author When referring to this work, full bibliographic details including the author, title, awarding institution and date of the thesis must be given
Glasgow Theses Service http://theses.gla.ac.uk/
[email protected]
1
Redefinition of Uraemic Cardiomyopathy with Cardiac Magnetic Resonance Imaging
by
Dr Patrick Mark MBChB (Hons), MRCP (UK)
Renal Unit, Western Infirmary, Glasgow and Glasgow Cardiovascular Research Centre, University of Glasgow, UK
A thesis submitted for the degree of Doctor of Philosophy in the Faculty of Medicine of the University of Glasgow
2 Contents Page Table of contents
2
List of figures
19
List of tables
25
List of abbreviations
28
Acknowledgements
32
Author’s declaration
33
Summary
34
Chapter 1 : Introduction
38
1.1
Epidemiology of cardiovascular disease in end stage renal failure
39
1.2
Risk factors for cardiovascular disease in the general population
41
and in ESRD 1.2.1
Hypertension
42
1.2.2
Hyperlipidaemia
43
1.2.3
Diabetes mellitus
47
1.2.4
Ischaemic heart disease
48
1.2.5
Physical inactivity
51
1.2.6
Cigarette smoking
51
1.2.7
Oxidative stress
52
3 1.2.8
Uraemic cardiomyopathy as a cardiovascular risk factor
54
1.2.9
Sudden cardiac death
57
1.2.10
Haemodynamic and metabolic factors of CRF
57
1.2.11
Proteinuria
60
1.2.12
Anaemia
61
1.2.13
Homocysteine
62
1.2.14
Hyperparathyroidism, calcium-phosphate metabolism
63
and arterial calcification 1.2.15
Inflammation and C-Reactive protein
65
1.3
Assessment of uraemic cardiomyopathy with echocardiography
67
1.4
Cardiovascular magnetic resonance imaging
69
1.4.1
Principles of cardiac magnetic resonance imaging
70
1.4.2
Cardiac magnetic resonance imaging for assessment of
71
cardiac function 1.4.3
Gadolinium based contrast agents for cardiac magnetic
72
resonance imaging 1.4.4
Cardiac magnetic imaging for assessment of ischaemic
73
heart disease 1.4.5
Cardiac magnetic resonance imaging for assessment of
76
cardiomyopathy 1.4.6 1.5
Contraindications to cardiac magnetic resonance imaging
Redefinition of uraemic cardiomyopathy with cardiovascular magnetic resonance imaging
78 80
4 1.6
1.7
Aims of this project
82
1.6.1
82
Hypothesis
Outline of the studies contained within this thesis
83
Chapter 2 : Materials and methods
84
2.1
Introduction
85
2.2
Ethics Committee approval
85
2.2.1
Subjects
85
2.2.2
Exclusion criteria
87
2.3
Cardiovascular Magnetic Resonance Imaging
87
2.3.1
CMR scan
87
2.3.2
Contrast agent
87
2.3.3
CMR protocol- Image acquisition
88
2.3.3
i
Patient positioning
88
2.3.3
ii
Left ventricular mass and function
88
2.3.3
iii
Aortic distensibilty and compliance
89
2.3.3
iv
Phase encoded (flow sensitive) CMR imaging of
90
aortic blood flow
2.4
2.3.3
v
Contrast enhanced CMR images
90
2.3.3
vi
CMR scan duration
90
CMR Analysis
91
5 2.4.1
Analysis of left ventricular function
91
2.4.2
Definition of left ventricular abnormalities
91
2.4.3
Contrast-enhanced image analysis
95
2.4.4
Computerised assessment of areas of late gadolinium
95
enhancement 2.4.5
Analysis of vascular function
96
2.4.5
i
Aortic distensibilty
96
2.4.5
ii
Measurement of pulse wave velocity
97
2.4.5
ii
a
Assessment of aortic length
97
2.4.5
ii
b
Interpretation of flow velocity curves to
97
calculate time difference between points along the aorta 2.4.5
ii
c
Calculation of pulse wave velocity
97
2.5
CMR Analysis – duration
102
2.6
Coronary angiography
102
2.7
Echocardiography
102
2.7.1
Echocardiography – general
102
2.7.2
Echocardiography protocol – image acquisition
103
2.8
Electrocardiogram
104
2.9
Exercise tolerance testing
104
2.10
Blood sampling
107
2.11
Follow up
107
6 Chapter 3 : A study of ventricular dimensions and function in uraemia
108
with contrast enhanced cardiac magnetic resonance imaging 3.1
Introduction
109
3.2
Methods
110
3.3
3.2.1
CMR technique and analysis
110
3.2.2
Statistical methods
110
Results
110
3.3.1
Patient and control demographics
110
3.3.2
Left ventricular dimensions
111
3.3.3
Reproducibility of measurement of left ventricular
111
dimensions 3.4
Contrast enhanced studies
116
3.4.1
116
Baseline left ventricular dimensions in patients with and without positive myocardial late gadolinium enhancement
3.4.2
Description and functional implications of
119
subendocardial late gadolinium enhancement 3.4.3
Clinical correlates of subendocardial late gadolinium
119
enhancement 3.4.4
Laboratory correlates of subendocardial late gadolinium
120
enhancement 3.4.5
Description and functional implications of diffuse late gadolinium enhancement
121
7 3.4.6
Clinical correlates of diffuse late gadolinium
121
enhancement 3.4.7
Laboratory correlates of diffuse late gadolinium
122
enhancement 3.4.8
Objective computerised analysis of identification and
126
classification of late gadolinium enhancement 3.4.9
Relationship between results of contrast enhanced studies
126
and coronary angiography 3.5
Discussion
132
3.5.1
Uraemic cardiomyopathy defined by CMR
132
3.5.2
Clinical implications of subendocardial LGE
134
3.5.3
Other studies displaying myocardial ischaemia with
136
subendocardial LGE at CMR 3.5.4
Clinical implications of diffuse LGE
137
3.5.5
Other studies displaying diffuse LGE with contrast
139
enhanced CMR 3.5.6
Other studies assessing myocardial tissue composition in
140
ESRD 3.5.7
Limitations
140
3.5.8
Conclusions
141
Chapter 4 : A comparative study of echocardiography and
142
electrocardiography with cardiac magnetic resonance imaging 4.1
Introduction
143
8 4.2
4.3
Methods
144
4.2.1
CMR and echocardiography
144
4.2.2
Echocardiogram- analysis
144
4.2.3
Electrocardiogram
145
4.2.4
Statistical methods
145
Results of echocardiographic studies
146
4.3.1
Patient demographics
146
4.3.2
Echocardiographic compared to CMR descriptions of
146
uraemic cardiomyopathy 4.3.3
Echocardiographic measures of left ventricular geometry
147
4.3.4
Comparison of CMR with echocardiography for
147
calculation of left ventricular mass and dimensions 4.3.5
Derivation of revised echocardiographic formula for use
156
in ESRD patients 4.4
Results of electrocardiographic studies
159
4.4.1
Patient demographics
159
4.4.2
Prevalence of left ventricular hypertrophy by CMR
159
4.4.3
Prevalence of left ventricular hypertrophy by ECG
159
4.4.4
Optimisation of ECG criteria for left ventricular
160
hypertrophy 4.5
Discussion
166
4.5.1
166
Results of echocardiographic studies
9 4.5.2
Echocardiographic studies used to derive measures of left
167
ventricular mass 4.5.3
CMR as a gold standard for calculation of left ventricular
168
dimensions 4.5.4
Feasibility of deriving novel regression formula for
169
calculation of left ventricular mass in end stage renal disease 4.5.5
Studies comparing echocardiographic and CMR
170
measures of left ventricular mass in other populations 4.5.6
Alternative echocardiographic techniques to assess left
170
ventricular mass compared to CMR 4.5.7
Reduction in numbers required to power studies using
171
CMR compared to echocardiography 4.5.8
Discussion of ECG studies
172
4.5.9
Feasibility of redefinition of partition values for left
172
ventricular hypertrophy in end stage renal disease 4.5.10
Limitations of ECG for diagnosis of LVH in ESRD
173
4.5.11
ECG as inclusion point for studies
174
4.5.12
Conclusions on ECG studies
174
Chapter 5 : A study of the determinants of uraemic cardiomyopathy
175
5.1
Introduction
176
5.2
Methods
177
5.2.1
CMR and echocardiography
177
10
5.3
5.2.2
Dialysis data and blood sampling
177
5.2.3
Statistical methods
177
Results
178
5.3.1
Patient demographics
178
5.3.2
Determinants of left ventricular mass in ESRD using
178
CMR 5.3.3
Determinants of left ventricular mass in ESRD using
179
echocardiography 5.4
Discussion
185
5.4.1
Overall determinants of left ventricular mass
185
5.4.2
Blood pressure as a determinant of LVH in ESRD
186
5.4.3
Comparison of determinants of left ventricular mass as
187
assessed by CMR compared to echocardiography 5.4.4
Hyperparathyroidism, hyperphosphataemia and vascular
188
calcification as determinants of LVH 5.4.5
Other potential determinants of LVH in ESRD
189
5.4.6
Aortic stenosis as a risk for LVH in ESRD
190
5.4.7
Anaemia as a risk factor for LVH in ESRD- fact or
191
fiction? 5.4.8
Reinventing the wheel -treatment strategies to reduce LVH in ESRD
193
11 Chapter 6 : Survival of patients undergoing cardiovascular screening
196
for renal transplantation 6.1
Introduction
197
6.2
Methods
198
6.3
6.2.1
Patient demographics
198
6.2.2
Cardiovascular assessment
199
6.2.3
Coronary angiography
199
6.2.4
Follow up
199
6.2.5
Statistical methods
200
Results
200
6.3.1
Patient demographics and survival
200
6.3.2
Laboratory data and patient outcome
201
6.3.3
Transplant list status, renal transplant listing and
201
outcome 6.3.4
Uraemic cardiomyopathy as assessed by CMR and
206
outcome 6.3.5
Resting and exercise electrocardiogram and outcome
206
6.3.6
Coronary angiography and outcome
207
6.3.7
Independent predictors of survival in all patients
210
6.3.8
Independent predictors of patients listed for renal
210
transplantation 6.4
Discussion
217
12 6.4.1
Predictors of survival in a cohort of patients screened for
217
renal transplantation 6.4.2
The resting and exercise ECG and outcome in potential
218
renal transplant candidates 6.4.3
Guidelines for screening for cardiovascular disease in
219
potential renal transplant recipients 6.4.4
Coronary angiography, ischaemic heart disease and renal
221
transplantation 6.4.5
Renal transplantation and survival compared to dialysis
223
as treatment for end stage renal disease 6.4.6
Limitations of the current study of outcome in patients
225
undergoing cardiovascular screening for renal transplantation 6.4.7
Conclusions and further studies required in the role of
226
cardiovascular assessment for renal transplantation
Chapter 7 : A study of the diagnostic utility of brain natriuretic peptide
227
in end stage renal disease 7.1
Introduction
228
7.2
Methods
229
7.3
7.2.1
CMR technique and analysis
229
7.2.2
Measurement of serum brain natriuretic peptide levels
229
7.2.3
Statistical methods
229
Results
230
13 7.3.1
Dialysis modality and serum BNP levels
230
7.3.2
Baseline demographics and serum BNP levels
230
7.3.3
Relationship between left ventricular dimensions and
231
serum BNP levels 7.3.4
Serum BNP levels in patients with left ventricular
231
hypertrophy and/or left ventricular systolic dysfunction 7.3.5
Relationship between BNP and presence of late
232
gadolinium enhancement 7.3.6 7.4
Prognostic value of brain natriuretic peptide
240
Discussion
242
7.4.1
242
Serum BNP in cardiovascular disorders in the general population and ESRD
7.4.2
Basic pathophysiology of mechanisms of production,
243
action and excretion of brain natriuretic peptide 7.4.3
Results of study of diagnostic properties of serum brain
245
natriuretic peptide in end stage renal disease 7.4.4
Diagnostic properties of brain natriuretic peptide in the
246
general population 7.4.5
Diagnostic properties of BNP in end stage renal disease
247
7.4.6
Prognostic role of serum brain natriuretic peptide in end
249
stage renal disease 7.4.7
Other potential roles for brain natriuretic levels in end
250
stage renal disease 7.4.8
Effect of dialysis on serum BNP
251
14 7.4.9
Conclusions
Chapter 8 : A study of vascular function with cardiovascular magnetic
252
253
resonance imaging in end stage renal disease 8.1
Introduction
254
8.2
Methods
255
8.2.1
CMR measures of aortic distensibilty and pulse wave
255
velocity 8.2.2
Measurement of aortic distensibilty
255
8.2.3
CMR measurement of pulse wave velocity
256
8.2.4
Applanation tonometry measurement of pulse wave
256
velocity
8.3
8.2.5
Follow up
257
8.2.5
Statistical methods
257
Results
258
8.3.1
Patient and control demographics
258
8.3.2
Measures of vascular function
258
8.3.3
Comparison between CMR and applanation tonometry
259
for measurement of pulse wave velocity 8.3.4
Haemodynamic relationship between pulse wave
259
velocity, aortic distensibilty and volumetric arterial strain 8.3.5
Clinical correlates of aortic distensibilty and volumetric arterial strain
263
15 8.3.6
Relationships between aortic distensibilty and left
266
ventricular dimensions and late gadolinium enhancement 8.3.7
Clinical correlates of pulse wave velocity
267
8.3.8
Relationship between CMR measures of vascular
271
function on survival and combined mortality and cardiovascular events 8.3.9
Multivariate analysis of relationship between CMR
272
measures of vascular function and survival 8.4
Discussion
278
8.4.1
Basic physiology of aortic function
278
8.4.2
Alterations of aortic function in ESRD
278
8.4.3
Relationship between aortic distensibilty, volumetric
280
arterial strain and pulse wave velocity 8.4.4
Results of studies of aortic distensibilty
281
8.4.5
Limitations of studies with aortic distensibilty and aortic
282
volumetric arterial strain 8.4.6
Results of studies of pulse wave velocity
283
8.4.7
Limitations of study of PWV with CMR
284
8.4.8
Prognostic implications of CMR studies of vascular
285
function 8.4.9
CMR measures of vascular function as surrogate markers
286
of cardiovascular risk 8.4.10
Assessment of vascular function using CMR
286
8.4.11
Other studies using CMR to assess pulse wave velocity
288
16 8.4.12
Arterial stiffness in uraemia - clinical implications and
288
long term survival 8.4.13
Conclusions
Chapter 9 : A study of dermatological complications of contrast
289
291
enhanced magnetic resonance imaging 9.1
Introduction
292
9.2
Methods
293
9.3
9.2.1
Identification of patients and MRI data
293
9.2.2
Statistical methods
294
Results 9.3.1
294 Demographics of patients undergoing renal replacement
294
therapy at the Western Infirmary, Glasgow 2000-2006 9.3.2
Cases of nephrogenic systemic fibrosis identified in
295
North Glasgow 9.3.3
Contrast enhanced magnetic resonance imaging
295
performed during the period 2000-2006 9.3.4
Relationship between exposure to MRI contrast agents
296
and development of NSF 9.3.5
Characteristics of patients who developed nephrogenic
296
systemic fibrosis 9.4
Discussion
301
9.4.1
301
Results of this study
17 9.4.2
Pathogenesis of nephrogenic systemic fibrosis
302
9.4.3
Clinical features of nephrogenic systemic fibrosis
303
9.4.4
Histological findings in nephrogenic systemic fibrosis
303
9.4.5
Postulated triggers for the development of nephrogenic
306
systemic fibrosis 9.4.6
Pharmacokinetics of gadolinium based contrast agents in
307
end stage renal disease 9.4.7
Adverse effects of gadolinium based contrast agents in
308
end stage renal disease 9.4.8
Relationship between gadolinium based contrast agents
308
and nephrogenic fibrosing dermopathy 9.4.9
Treatment of nephrogenic systemic fibrosis
309
9.4.10
Conclusions
310
Chapter 10 : General discussion and conclusions
311
10.1
312
Definition of uraemic cardiomyopathy with cardiac magnetic resonance imaging
10.2
Long term implications of uraemic cardiomyopathy and other
313
cardiovascular risk factors in uraemia 10.3
Investigation of vascular function in uraemia using cardiac
314
magnetic resonance imaging 10.4
Nephrogenic systemic fibrosis- a devastating new disorder in
315
uraemic patients 10.5
Limitations of these current studies
315
18 10.6
Cardiac magnetic resonance imaging- a novel surrogate end point
316
for clinical trials in end stage renal disease? 10.7
Future work with cardiac magnetic resonance in end stage renal
317
disease 10.8
Interventions to reduce cardiovascular risk in end stage renal
319
disease 10.9
Conclusions
322
References
324
Publications containing work undertaken for this thesis
355
Publications related to the work in this thesis
355
Presentations to Learned Societies of work undertaken for this thesis
355
19 List of Figures
Fig 1.1
Cause specific death rates for all dialysis patients by age, 1995-97 from the USRDS report 1999
Fig 1.2
Schematic view of the relationship between ischaemic heart disease, LVH and sudden cardiac death in ESRD
Fig 1.3
First pass imaging demonstrating an area of hypoenhancemnt in keeping with a myocardial perfusion deficit in a patient with a recent lateral myocardial infarction
Fig 1.4
Late gadolinium enhancement representing infarcted myocardial tissue in the lateral wall of the left ventricle in the same patient
Fig 1.5
Extensive chaotic myocardial collagen deposition indicated by late gadolinium
enhancement
in
a
patient
with
hypertrophic
cardiomyopathy Fig 1.6
Patchy late gadolinium enhancement demon demonstrated in both the septum and lateral walls of the left ventricle in a patient with acute myocarditis
Fig 2.1
Vertical long axis image in end diastole in a patient with left ventricular hypertrophy
Fig 2.2
Horizontal long axis image in end diastole in the same patient
Fig 2.3
Short axis view of the left ventricle in end diastole with the left ventricular and right ventricular cavities indicated
Fig 2.4
End diastolic and end systolic short axis views of the left ventricle with the endocardial and epicardial borders contoured using the Argus analysis package
Fig2.5
Ascending aorta and descending aorta shown in cross section, with
20 ascending aortic contour traced for distensibilty and volumetric arterial strain measurement Fig 2.6
Using Cardiowarp to measure aortic length
Fig 2.7
Ascending aorta and descending aorta shown in cross section with ascending aortic contour traced for aortic blood flow measurement
Fig 2.8
Representative plot of normalised blood flow plotted against time
Fig 2.9
M-mode echocardiogram of the left ventricle of a patient with left ventricular hypertrophy
Fig 2.10.1
End diastolic 4-chamber view of the left ventricle with the endocardial surface contoured
Fig 2.10.2
End systolic 4-chamber view of the left ventricle with the endocardial surface contoured
Fig 3.1
Short axis mid left ventricular cavity view of images of the left and right ventricle of a normal control subject
Fig 3.2
Short axis mid left ventricular cavity view of images of the left and right ventricle of a patient with ESRD on haemodialysis with marked left ventricular hypertrophy
Fig 3.3
Horizontal long axis view of images of the left and right ventricle of a normal control subject
Fig 3.4
Horizontal long axis view of images of the left and right ventricle of the ESRD patient
Fig 3.5
Contrast enhanced images of the left ventricle in a patient with ESRD with no evidence of LGE
Fig 3.6
Contrast enhanced images of the left ventricle in a patient with ESRD with evidence of subendocardial LGE indicating a large old inferior myocardial infarction
21 Fig 3.7
Patient with an inferior myocardial infarction indicated by subendocardial LGE and a corresponding basal inferior wall motion abnormality
Fig 3.8
Horizontal long axis and short axis view of the heart of a patient with severe left ventricular hypertrophy and septal diffuse LGE
Fig 3.9
Vertical long axis and short axis view of the left ventricle in a further patient with severe left ventricular hypertrophy and septal and lateral wall diffuse LGE
Fig 3.10
Short axis and horizontal long axis and view of a patient with moderate left ventricular hypertrophy and a lesser degree of septal diffuse LGE
Fig 3.11
Box plot showing mean pixel intensity for subtypes of LGE pattern
Fig 4.1
Prevalence of left ventricular abnormalities as detected by CMR
Fig 4.2
Prevalence of left ventricular abnormalities as detected by echocardiography
Fig 4.3
Proportion of patients with left ventricular dilatation as classed by echocardiographic pattern of remodelling
Fig 4.4
Scatter plots of echocardiographic measures versus CMR measures of LV mass for various M-mode echocardiographic formulae
Fig 4.5
Bland-Altman plots of Echocardiographic and CMR LV mass for the Penn formula
Fig 4.6
Bland-Altman plots of Echocardiographic and CMR LV mass for the for the Teichholz formula
Fig 4.7
Scatter plots of echocardiographic measures versus CMR measures of LV mass for end diastolic and end systolic volume
Fig 4.8
Bland-Altman plot of CMR and echocardiographic LV end diastolic
22 volume Fig 4.9
LV mass by CMR plotted against the LV dimensions cubed to calculate volume of LV myocardial tissue
Fig 4.10
Calculated LV Mass using novel LVM formula
Fig 4.11
Receiver operator characteristic curves for Cornell voltage and Cornell product for diagnosis of LVH by CMR
Fig 4.12
Receiver operator characteristic curves for Sokolow-Lyon voltage and Sokolow-Lyon product for diagnosis of LVH by CMR
Fig 5.1
Scatter plot of systolic and diastolic blood pressures plotted against LVMI assessed by CMR
Fig 6.1
Kaplan-Meier survival curves of patients stratified by the presence of ischaemic heart disease
Fig 6.2
Kaplan-Meier survival curves of patients stratified by transplant status
Fig 6.3
Kaplan-Meier survival curves of patients stratified by the presence of left ventricular abnormalities
Fig 6.4
Kaplan-Meier survival curves of patients stratified by the presence and subtype of LGE
Fig 6.5
Kaplan-Meier survival curves of patients stratified by the presence of an ischaemic ECG
Fig 6.6
Kaplan-Meier survival curves of patients stratified by ability to perform an exercise tolerance test
Fig 6.7
Kaplan-Meier survival curves of patients stratified by coronary angiography status
Fig 7.1
Box plots for Log10BNP in patients with and without LVH and LVSD
Fig 7.2
Receiver operator characteristic curves BNP for the diagnosis of LVH and LVSD
23 Fig 7.3
Box plots for Log10BNP in patients with defined by subtype of LGE
Fig 7.4
Log transformed serum BNP level plotted against mass of subendocardial myocardial fibrosis
Fig 7.5
Kaplan-Meier survival curves for all cause mortality with patients stratified by serum BNP tertile
Fig 8.1
Bland Altman plot comparing CMR and applanation tonometry in healthy volunteers
Fig 8.2
Scatter plot of log transformed pulse wave velocity plotted against negative log transformed aortic distensibilty
Fig 8.3
Scatter plot of negative log transformed aortic distensibilty plotted against age for normal controls and uraemic patients
Fig 8.4
Box and whisper plots of log transformed aortic distensibilty in patients with and without a past medical history of diabetes mellitus and ischaemic heart disease
Fig 8.5
Box and whisper plots of log transformed aortic distensibilty in patients divided by pattern of LGE
Fig 8.6
Mass of subendocardial myocardial fibrosis indicated by LGE plotted against log transformed aortic distensibilty
Fig 8.7
Scatter plot of log transformed pulse wave velocity plotted against age for normal controls and uraemic patients
Fig 8.8
Box and whisper plots of log transformed pulse wave velocity in patients divided by antihypertensive therapy
Fig 8.9
Kaplan-Meier survival curves for all cause mortality with patients stratified by systolic blood pressure tertile
Fig 8.10
Kaplan-Meier survival curves for all cause mortality with patients stratified by aortic distensibilty tertile.
24 Fig 8.11
Kaplan-Meier survival curves for survival to either CV end point or death with patients stratified by aortic VAS quartile
Fig 8.12
Kaplan-Meier survival curves for survival to either CV end point or death with patients stratified by pulse wave velocity tertile
Fig 9.1
Graph displaying the cumulative number of contrast enhanced MRI scans performed in this cohort of patients with the cumulative frequency of diagnosis of nephrogenic systemic fibrosis displayed
Fig 9.2
Histology of NSF lesions
25 List of Tables
Table 1.1
Risk factors for cardiovascular disease in the general population and in ESRD
Table 1.2
Comparison of the 4S study with the 4D and ALERT studies
Table 3.1
Background demographics for uraemic patients and controls
Table 3.2
Left ventricular dimensions in uraemic patients and controls
Table 3.3
Background demographics for uraemic patients undergoing contrast enhanced CMR
Table 3.4
Left ventricular dimensions displayed by subtype of LGE
Table 3.5
Clinical characteristics of patients as grouped by presence and subtype of LGE
Table 3.6
Laboratory characteristics of patients grouped by presence and subtype of LGE
Table 3.7
Coronary angiography results by presence and subtype of LGE
Table 4.1
Background demographics for patients studied with CMR and echocardiography
Table 4.2
Comparison of echocardiographic and CMR measures of left ventricular dimensions
Table 4.3
Comparison of M-mode methods of calculating left ventricular mass
Table 4.4
Mean values for QRS voltages and QRS voltage-duration products displayed by gender and CMR LVH status
Table 4.5
Sensitivities and specificities of the established ECG criteria for LVH compared to CMR
Table 4.6
Area under receiver operator curves for ECG diagnostic criteria for LVH
26 Table 4.7
Sensitivities of the 4 ECG criteria
Table 5.1
Baseline characteristics of patients
Table 5.2
Determinants of LVMI as measured by CMR in a multivariate linear regression model
Table 5.3
Determinants of LVMI as measured by echocardiography in a multivariate linear regression model
Table 6.1
Baseline demographic data for patients alive and dead at the end of the follow up period
Table 6.2
Laboratory parameters for patients alive and dead at the end of the follow up period
Table 6.3
Baseline demographic data for patients subdivided by the transplant status at the end of the follow up period
Table 6.4
Left ventricular dimensions in patients who died and those who were still alive at the end of the follow up period
Table 6.5
Electrocardiographic data for patients who died and those who were still alive at the end of the follow up period
Table 6.6
Cox regression survival analysis for all patients
Table 6.7
Cox regression survival analysis for patients who underwent contrast enhanced CMR
Table 6.8
Cox regression survival analysis for patients on the renal transplant list
Table 7.1
Background demographics for dialysis patients
Table 7.2
Correlation co-efficients between ventricular dimensions and serum BNP
Table 7.3
Areas under receiver-operator-characteristic curves for the use of BNP for the diagnosis of LVH and LVSD
27 Table 8.1
Background demographics for uraemic patients and controls
Table 8.2
Demographics data for patients were alive and dead at the end of the follow up period for uraemic patients and controls
Table 8.3
Cox survival analysis for patient survival
Table 8.4
Cox survival analysis for patient survival to either death or cardiovascular event
Table 9.1
Clinical characteristics of the complete of cohort of patients comparing those with and without a diagnosis of NSF
Table 9.2
Baseline characteristics of NSF cases
28 List of abbreviations
10
Primary
4D
Deutsche Diabetes Dialyse Studie
4S
Scandinavian Simvastatin Survival Study
AAo
ascending aorta
ABPM
ambulatory blood pressure monitoring
ACC/AHA
American College of Cardiology/American Heart Association
ACE
angiotensin converting enzyme
ACEi
angiotensin converting enzyme inhibitor
AD
aortic distensibilty
ALERT
Assessment of LEscol in Renal Transplantation
APKD
adult polycystic kidney disease
ARB
angiotensin receptor blocker
ASE
American Society of Echocardiography
AUC
area under curve
BSA
body surface area
CA
calcium channel antagonist
CAD
coronary artery disease
Ca-P
calcium-phosphate
CD
cardiac death
CHF
chronic heart failure
CI
confidence interval
CKD
chronic kidney disease
CPN
chronic pyelonephritis
29 CrCl
creatinine clearance
CRF
chronic renal failure
CRP
C-reactive protein
CT
computed tomography
CVA
cerebrovascular accident
CVD
cardiovascular disease
DAo
descending aorta
DBP
diastolic blood pressure
ECF
extra cellular fluid
ECG
electrocardiogram
EDTA
ethylenediamine tetraacetic acid
EDV
end diastolic volume
EF
ejection fraction
ESV
end systolic volume
ETT
exercise tolerance test
FLASH
fast low-angle shot
FoV
field of view
Gd-DTPA-BMA
Gadolinium-diethylentriaminepentaacetate
GFR
glomerular filtration rate
GN
glomerulonephritis
HD
haemodialysis
HDL
high-density lipoprotein
HLA
horizontal long axis
HR
hazard ratio
IDL
intermediate-density lipoprotein
30 IHD
ischaemic heart disease
IVST
interventricular septal thickness
KDOQI
Kidney Disease Outcomes Quality Initiative
LDL
low-density lipoprotein (LDL)
LGE
late gadolinium enhancement
LV
left ventricle/ventricular
LVEF
left ventricular ejection fraction
LVH
left ventricular hypertrophy
LVID
left ventricular internal diameter
LVMI
left ventricular mass index
LVOT
left ventricular outflow tract
LVSD
left ventricular systolic dysfunction
LVW
left ventricular wall thickness
MET
metabolic equivalent
MI
myocardial infarction
MIA
malnutrition, inflammation, and atherosclerosis
MonoRx
monotherapy
MRI
magnetic resonance imaging
NHS
National Health Service
NPV
negative predictive value
NSF
nephrogenic systemic fibrosis
NT-proBNP
N-terminal-pro Brain Natriuretic peptide
Pap
papillary muscles
PC
personal computer
PD
peritoneal dialysis
31 PPV
positive predictive value
PTH
parathyroid hormone
PVD
peripheral vascular disease
PWT
posterior wall thickness
PWV
pulse wave velocity
ROC
receiver operator characteristic
ROI
region of interest
RRT
renal replacement therapy
SA
short axis
SBP
systolic blood pressure
SPECT
myocardial scintigraphy
T
Tesla
TE
echo time
TIA
transient ischaemic attack
TR
repetition time
TrueFISP
fast imaging with steady-state precession
Tx
transplant
URR
urea reduction ratio
VAS
volumetric arterial strain
VLA
vertical long axis localiser
VLDL
very low-density lipoprotein
32 Acknowledgements
I would like to thank my principal supervisor Professor Alan Jardine for his valuable advice, considerable patience and encouragement throughout this project. Throughout this venture I have also been delighted to receive the support and enthusiasm of my cosupervisor Professor Henry Dargie.
I am extremely grateful to Tracey Steedman and Tony Cunningham for their help teaching
me
the
techniques
of
cardiac
magnetic
resonance
imaging
and
echocardiography and would also like to thank Dr John Foster for advice with MR physics and Helen MacDonald for secretarial help with patients at the Clinical Research Institute.
This work would not have been possible without the participation of the patients of the Western Infirmary Renal Unit. I am indebted to the Consultant staff of the Renal Unit for encouraging patients to participate: Dr Stuart Rodger, Dr Ellon McGregor, Dr Margaret McMillan, Dr Conal Daly, Dr Neal Padmanabhan, Dr Colin Geddes and Dr Brian Junor. I am particularly grateful to Lynne Thomson, transplant coordinator, who pointed out suitable patients.
Finally, I would like to thank the British Heart Foundation who supported this work through a Junior Research Fellowship.
33 Declaration
The experimental design of the work presented in this thesis was that of the author and his supervisors, Professor Alan Jardine and Professor Henry Dargie. All experimental work was carried out by the author except acquisition of echocardiographic studies (performed by Tony Cunningham, Clinical Research Initiative, University of Glasgow), acquisition a proportion of cardiac magnetic resonance images (performed by Tracey Steedman, Glasgow Cardiac Magnetic Resonance Unit, University of Glasgow) and performance of pulse wave analysis tracings (Dr Lukas Zimmerli, University of Glasgow). Measurement of brain natriuretic peptide concentrations was performed by Dr JJ Morton (University of Glasgow).
I declare that this thesis has been composed by myself and is a record of work performed by myself. It has not been previously submitted for a higher degree.
Patrick Mark July 2007
34 Summary Patients with end stage renal disease (ESRD) have a 20-100 fold risk of premature cardiovascular death compared to age matched controls from the general population. These patients have many ‘conventional’ cardiovascular risk factors such as diabetes, ischaemic heart disease, hypertension, cigarette smoking and hyperlipidaemia. However, the relationship between the presence of these risk factors and cardiovascular outcomes is less clear in ESRD than in the general population. In the cases of hyperlipidaemia and hypertension a paradoxical relationship has been demonstrated where lower cholesterol or blood pressure is associated with an increased risk of cardiovascular events. One factor previously demonstrated to be associated with poor prognosis is the presence of uraemic cardiomyopathy, found in approximately 70% of ESRD patients at initiation of dialysis therapy, usually defined echocardiographically as the presence of left ventricular (LV) abnormalities, including left ventricular hypertrophy (LVH), LV dilatation and LV systolic dysfunction. However, echocardiography makes assumptions regarding LV geometry, which is frequently distorted in patients with ESRD. Furthermore any errors in measurements are amplified by the changes in hydration status which occur during the dialysis cycle, leading to changes in LV chamber dimensions. For these reasons, cardiac magnetic resonance imaging (CMR), by providing high fidelity measurements, potentially offers a ‘volume independent’ method of quantifying LV dimensions. Furthermore, by using gadolinium based contrast agents, tissue abnormalities particularly myocardial fibrosis, indicated by late gadolinium enhancement (LGE) may by identified.
The work contained in this thesis examines the relationship between cardiac dimensions, as defined by CMR and cardiovascular risk factors (both conventional and specific to uraemia).
In a study of 145 patients with ESRD using CMR with
35 gadolinium, two specific pathological processes were demonstrated. First, the presence of subendocardial LGE indicating previous myocardial infarction was associated with the presence of conventional cardiovascular risk factors such as previous ischaemic heart disease and diabetes. Patients with subendocardial LGE frequently had LV systolic dysfunction. Second, diffuse LGE, representing fibrosis throughout the LV wall was identified in patients with LVH. This was an unexpected finding and appears specific to uraemia. Using CMR, isolated LV dilatation was rare. These findings suggest that in uraemia two forms of cardiomyopathy exist- LV systolic dysfunction due to underling myocardial ischaemia and LVH which is a true ‘uraemic cardiomyopathy’ associated with diffuse myocardial fibrosis. Attempts were made to reassess the relationship between CMR and echocardiographic measures of cardiac dimensions. In keeping with a previous study, it was demonstrated that M-mode echocardiography overestimates LV mass compared to CMR in this population. Thus, CMR may be used to optimise echocardiographic formulae to calculate LV mass. Furthermore, it appeared that either by echocardiography or by CMR the chief determinant of LVH in this population was blood pressure, in particular systolic blood pressure. This has implications for treatment as recent studies aimed at correcting anaemia, previously associated with LVH, either to reduce LV mass or to improve survival, have generally demonstrated increased cardiovascular events with higher haemoglobin. Therefore, if LV mass is a goal of treatment, attempts should be made to reduce blood pressure further in this population.
The patients studied in these investigations were candidates for renal transplantation, the definitive treatment for chronic renal failure. Cardiovascular disease is the leading cause of death both in patients on the renal transplant list, as well as post successful transplantation. There is a great deal of interest in identifying patients at high
36 cardiovascular risk, to allow strategies to be adopted to minimise this risk, frequently by undertaking invasive investigation such as coronary angiography. In a survival study of 300 potential renal transplant recipients, factors associated with increased risk of mortality were increased age, ischaemic heart disease whilst receipt of a renal transplant was protective. Although the presence of LGE was associated with poorer outcome, this finding was not independent of other variables. One interesting finding was that patients with greater exercise tolerance, measured objectively using the full Bruce exercise test had better outcomes. This observation represents a simple pragmatic method to riskstratify such patients. A study using the biomarker brain natriuretic peptide (BNP) a peptide released from the LV in response to stretch and hypertrophy, in 114 patients, demonstrated that whilst BNP has potential as a diagnostic tool for the presence of uraemic cardiomyopathy, in particular LVH, this peptide added little prognostic value.
As familiarity with CMR techniques developed, it became clear that vascular function could be investigated with this imaging modality. Previous studies using alternative measures of vascular function have suggested that arterial stiffness is an important predictor of long term outcome in patients with ESRD. A study of 147 uraemic patients using aortic distensibilty and aortic volumetric arterial strain as CMR measures of aortic stiffness demonstrated that both these parameters were associated with an increased risk of cardiovascular events and mortality. To date there do not appear to be any similar outcome studies using these measures, although a number of authors have noted an association between aortic distensibilty and cardiovascular risk factors. These factors may represent potential targets for therapy aimed at reduction of cardiovascular risk in patients with ESRD.
37 One unfortunate development during the period during which these studies were undertaken, was the emergence of a link between exposure to gadolinium based contrast agents and nephrogenic systemic fibrosis (NSF), a potentially life threatening skin disorder in patients with advanced renal failure. This finding lead to the cessation of contrast CMR studies. A retrospective investigation of factors present in patients in North Glasgow affected by NSF, confirmed that patients with NSF were more likely to have undergone contrast based imaging than unaffected patients, frequently undergoing multiple scans, with high doses of gadodiamide used. Until this issue is clarified, future scans using these agents in this population should be undertaken with caution.
These studies have characterised for the first time the relationship between both uraemic cardiomyopathy and uraemic arterial stiffness and both cardiovascular risk factors and long term outcome. CMR measures of cardiac dimensions and vascular function represent future targets for interventions aimed at reducing cardiovascular risk in patients with advanced renal failure.
38
Chapter 1
Introduction
39 1.1
Epidemiology of cardiovascular disease in end stage renal failure
Premature cardiovascular disease is the leading cause of death in patients with end stage renal disease (ESRD) requiring dialysis therapy with approximate risk age adjusted cardiovascular risk and cardiovascular mortality rates around 20 times those of the general population(1;2). Prior to the development of haemodialysis (and subsequently peritoneal dialysis) as treatment for advanced renal failure, pericarditis and pericardial effusions were common and often fatal cardiac manifestations of the syndrome of terminal uraemia. With the advent of dialysis therapy, it became evident that premature cardiovascular disease was reported as cause of death in a disproportionately large number of patients on dialysis programmes, despite the young age of patients selected for dialysis treatment during the early years of this treatment. In 1974, the Seattle group led by Belding Scribner, a pioneer in early haemodialysis treatment, reported the presence of accelerated atherosclerosis in patients treated with dialysis treatment(3). Whilst undeniably a contributory factor to the excess cardiovascular mortality in ESRD patients, this is unlikely to be the sole mechanism, and further analysis of the relationship between conventional cardiovascular risk factors and outcome in this population reveals stark differences between patients with ESRD and the general population.
Using data from the United States Renal Data Services (USRDS), approximately 60% of deaths amongst dialysis patients in the United States can be attributed to myocardial infarction, cardiac arrest, cerebrovascular disease and other cardiac causes(4), with similar figures reported to European renal registries. Whilst the most common mode of cardiovascular death in the general population is myocardial infarction, one striking finding in the ESRD population is the extremely high proportion of deaths attributed to sudden (and therefore presumed arrhythmic) cardiac death (Figure 1.1).
40
Figure 1.1 Cause specific death rates for all dialysis patients by age, 1995-97 from the USRDS report 1999.
One dilemma here is the difficultly is ascertaining the cause of death in such patients, to then identify reversible risk factors to improve treatment. Nonetheless, as this is a consistent finding, it suggests differences in the pathogenesis of fatal cardiovascular events in patients with ESRD compared to those in the general population. Moreover, although many ‘conventional’ cardiovascular risk factors are present in patients with ESRD, the relationship between these risk factors and outcome is less clear than in the general population, and additionally there are cardiovascular risk factors either specific to the uraemic milieu which carry a more influential role on future cardiovascular events than in the general population. Table 1.1 lists some of these risk factors which will be discussed in greater detail.
41 Risk factors for CVD – gen. population
Risk factors for CVD - ESRD
Older age
Haemodynamic and metabolic factors of CRF
Hypertension
Proteinuria
Hyperlipidaemia
↑extracellular fluid (ECF) volume
Diabetes
Electrolyte imbalance
Physical inactivity
Anaemia
Previous MI/CAD/PVD/CVD
Homocysteine
Smoking
↑PTH/calcium-phosphate
Oxidative stress
Arterial calcification
LVH/LVSD
Inflammation
Table 1.1 Risk factors for cardiovascular disease in the general population and in ESRD
1.2
Risk factors for cardiovascular disease in the general population and in ESRD
In the later part of the 20th century it became clear from an abundance of large clinical trials, that by intervention on a specific risk factor, previously identified from observational studies, the risk of future cardiovascular events could be reduced. Focus has directed on which patients derive most benefit from these interventions, frequently dependent on their baseline probability of a certain event occurring. For example, in the case of lipid lowering therapy post myocardial infarction(5), the clinical benefit is now clear and has translated into widespread changes in clinical practice. As the same evidence is not present in the ESRD population, it is tempting to extrapolate these findings from trials in the general population to this group. However, these epidemiological associations from observational studies do not demonstrate the same relationship in ESRD as in the general population and to date interventional trials aimed
42 at such risk factors in ESRD patients have given conflicting results. It is also clear that some of these risk factors are closely interrelated (e.g. haemodynamic/ metabolic factors of chronic renal failure and extracellular fluid volume). A number of the factors displayed in Table 1.1 are discussed.
1.2.1
Hypertension
In the general population, it has been demonstrated that lowering blood pressure in patients with hypertension reduces cardiovascular risk(6;7). Initially studies suggested that the agent used to treat blood pressure may not be as important as the blood pressure target itself, with certain exceptions. Treatment with diuretics(8), calcium channel antagonists(9), beta blockers(10), angiotensin converting enzyme inhibitors(11) and angiotensin receptor blockers(12) have all been shown to be effective at reducing risk of cardiovascular events in hypertensive individuals. To date, no minimum blood pressure target has been identified and although there is some evidence from observational studies that a ‘U’ or ‘J’ shaped curve relationship between diastolic blood pressure and outcome exists(13), suggesting that low diastolic blood pressure may compromise perfusion of vascular beds distal to a stenotic vessel. Nonetheless, this is less of a problem in clinical practice, where frequently achieving target blood pressure is more of an issue. Additionally, it has been clearly demonstrating that reduction of blood pressure is a major modifiable risk factor in patients with chronic kidney disease, both in preventing progression to ESRD and in preventing cardiovascular events(14;15). The story is more complex in patients with ESRD. Several observational studies have demonstrated that low blood pressure is independently associated with increased mortality in ESRD. Zager et al demonstrated that whilst pre-dialysis blood pressure was unrelated to cardiovascular mortality, a clear ‘U’ shaped curve relationship between post-dialysis
blood
pressure
was
seen
with
post-dialysis
systolic
blood
43 pressure>180mmHg and 160mmHg or 2 years on dialysis therapy) demonstrated a linear relationship with increasing blood pressure(18). The inference from this study is that low blood pressure in incident dialysis patients may represent left ventricular systolic dysfunction, hence increasing these patients risk of early death.
There few trials to inform how best to achieve blood pressure targets in ESRD, and observational data supports the use of long-duration dialysis sessions, with slow ultrafiltration as pioneered by Charra et al in Tassain, France(19). More recent data have shown similar benefits with nocturnal haemodialysis (allowing for longer treatment sessions)(20). There is a pressing need for large randomised controlled trials in ESRD (both haemodialysis and peritoneal dialysis) to determine both optimal blood pressure targets and strategies to achieve those targets, with either dialysis, pharmacological intervention or a combination of these methods.
1.2.2
Hyperlipidaemia
In the general population, hypercholesterolaemia and dyslipidaemia are interchangeable in terms of prevalence and risk implication. In ESRD, however, this is not the case. ESRD patients typically have either normal or slightly increased low-density lipoprotein (LDL), increased very low-density lipoprotein (VLDL) and intermediate-density
44 lipoprotein (IDL) leading to elevated triglyceride levels, and decreased levels of highdensity lipoprotein (HDL). There are also qualitative changes in dyslipidaemia with a shift to a more atherogenic LDL particle size toward a small, dense apo-B-rich LDL predominance(21). The prevalence of dyslipidaemia in chronic kidney disease patients is very high. In one study of patients of both haemodialysis and peritoneal dialysis patients, the prevalence of dyslipidaemia was approximately 67%(22), where dyslipidaemia was defined as at least one abnormal lipid parameter. In fact, peritoneal dialysis seems to be associated with a relatively more atherogenic lipid profile than haemodialysis(23).
In the general population the relationship between hyperlipidaemia (dyslipidaemia) and cardiovascular disease (predominantly coronary artery disease) is well established and there are proven benefits of lipid-lowering with statins(5;24-28). Only limited epidemiological and even more limited interventional, data exist on the relationship between dyslipidaemia and cardiovascular disease in ESRD. In patients receiving maintenance haemodialysis, reports suggest either no relationship or paradoxical correlations, the so called “reverse epidemiology”, where a lower total cholesterol level has been associated with a higher risk of death (29-31), or conversely, a higher serum cholesterol level has been found in long-term dialysis survivors(32). These studies have often used registry data, and either all cause mortality or unspecified CV mortality. Similar inverse, “J” or “U”-shaped relationships between lipid levels and all cause mortality have been reported in other populations and are thought to reflect a high prevalence of co-morbid disease (specifically malignancy and associated malnutrition) in patients with low cholesterol levels. These observations highlight the need for interventional trials and may have led to under-treatment of dyslipidaemia. Amongst patients starting dialysis, almost 40% are diabetic and 25% have known coronary artery
45 disease and 30% of dialysis patients have cholesterol levels higher than 5.18mmol/L(33). Despite these observations, and studies showing effective lipidlowering and safety of statins, less than 10% of patients commencing maintenance dialysis receive statins(34;35). The impetus now lies in clarifying the therapeutic benefit, and unravelling the mechanisms that underlie the cholesterol paradox.
The “4D Trial” (Deutsche Diabetes Dialyse Studie) perhaps unexpectedly, failed to show a significant reduction in cardiovascular events in haemodialysis patients given atorvastatin for a median of four years(36). It was a randomised, placebo-controlled study in 1,255 type II diabetic patients on chronic haemodialysis, who had been on dialysis for less than two years. Atorvastatin lowered mean LDL-cholesterol levels by 42%, to 1.9 mmol/L. However, there was no significant reduction in the primary end point (a composite of cardiac death, nonfatal myocardial infarction, and fatal or nonfatal stroke). The investigators speculated that the negative results could be in part due to a different pathogenesis of vascular events in diabetic patients with ESRD compared to other groups, and that the intervention was too late in the natural history of such complex disease. Atorvastatin therapy did, however, lower the incidence of myocardial infarction. Thus, an alternative explanation is that in the complex mixture of cardiovascular disease that affects patients with ESRD the relationship between cholesterol and myocardial infarction is present (and lipid-lowering reduces this endpoint) but that myocardial infarction is not the dominant cardiovascular end-point.
This hypothesis has been explored in patients with ESRD who received renal transplants in the Assessment of LEscol in Renal Transplantation (ALERT) trial. In this related population, all lipid parameters are associated strongly with the development of myocardial infarction but much less so with cardiac death, which is more dependent on
46 left ventricular hypertrophy (LVH) and hypertension(37). The differences in cardiac outcomes in the 4S study in patients with conventional CVD, the 4D study and the ALERT study are illustrated in Table 1.2. The 4S (Scandinavian Simvastatin Survival Study) study randomised patients to simvastatin 40mg or placebo post myocardial infarction and demonstrated a significant reduction in both myocardial infarction and cardiovascular death(5). In the general population (4S) patients are more likely to have a non-fatal MI than a cardiac death, whereas in patients receiving haemodialysis the relationship is reversed. Additionally it is clear that the cardiac event rate in the 4D exceeds even a very high risk group such as post myocardial infarction patients. In the general population, a minimum threshold for lowering LDL has not yet been defined and safety concerns regarding intensive statin therapy have not been founded. To date only less aggressive statin therapy has been trialled in the ESRD population and although the risk of adverse affects such rhabdomyolysis in this population is higher, so far the safety record in these clinical trials has been good.
LDL-cholesterol n mmol/L
mmol/L % change
baseline
change
CD+MI
Non-
annual
fatal
rate
MI %
CD+MI %
CD % of
reduction
reduction
4S
4444
4.9
1.7
-35
5.2
16.9
34
42
ALERT
2102
4.1
1.0
-32
2.0
5.2
35
38
4D
1255
3.1
1.2
-42
8.2
11.8
14
19
Table 1.2 Comparison of the 4S study with the 4D and ALERT studies. Abbreviations n= number of patients studied, CD – cardiac death, MI – myocardial infarction
47 1.2.3
Diabetes mellitus
Diabetic nephropathy is the cause of ESRD in 15-30% of patients with approximately equal proportions of patients having type I and type II diabetes(38).
Extra-renal
complications of diabetes include macrovascular disease and microvascular disease. The overall risk of death from myocardial infarction in a patient with diabetes is approximately three times that of the general population, with younger patients at higher risk(39). However the development of nephropathy, heralded by the presence of albuminuria, enhances the risks of further macrovascular complications as well as the risk of progressing to ESRD(40). Data from the Diabetes Control and Complications trial has shown that tight diabetic and blood pressure control reduce the risk of progression to ESRD and cardiovascular events in type I diabetics(41;42). However in the United Kingdom Prospective Diabetes Study tight glycaemic control was not shown to reduce risk of myocardial infarction in type II diabetics(43). Better glycaemic control was shown to reduce risk of microvascular complications and better blood pressure control has been demonstrated to reduce risk of cardiovascular events and progression of diabetic nephropathy(44). Once established on dialysis therapy, the survival for diabetic patients is considerably worse than for patients with other causes of ESRD with a median survival on dialysis survival of 2.5 years(45). This is mainly attributable to the excess risk of vascular disease. Studies screening diabetic patients for kidney transplantation have suggested that over half of diabetic renal transplant candidates will have at least one greater than 50% coronary artery stenosis(46).
Once established on dialysis therapy, the options for type I diabetic patients include both simultaneous kidney-pancreas transplantation and kidney only transplantation with or without pancreas after kidney transplantation. Islet cell transplantation has been performed successfully but the long success has to date been relatively disappointing
48 with 132.6 µmol/L, 27 dialysis patients) with 2972 patients with normal renal function undergoing PCI in 1994–97(57). The in-hospital mortality was significantly higher in the patients with renal dysfunction (10.8% for the renal patients and 1.1% in the controls) with significantly more blood transfusions in the renal patients. The 1-yr actuarial survival was significantly lower at 75% for the renal group compared to 97% for the matched controls. These data suggest that once a patient with
51 advanced renal disease develops a significant burden of atherosclerotic coronary artery disease, there is paucity of randomised controlled data to inform best practise. Current observational evidence suggests that outcomes are considerably poorer than the general population both in the setting of acute myocardial ischaemia as well as for coronary revascularisation.
1.2.5
Physical inactivity
Evidence from observational studies of the general population suggests that increased physical activity is associated with reduced cardiovascular mortality. Physical activity is frequently limited in ESRD patients. One epidemiological study from the Dialysis Morbidity and Mortality Wave 2 study has demonstrated that limitations in physical activity are common among new patients with ESRD in the United States and correlate highly with increased mortality risk. Frequent exercise of up to 4 to 5 times per week correlate with improved survival. Daily exercise was not associated with any additional protective benefit(58). Although direct benefits of an interventional exercise programme on long term outcome are difficult to demonstrate, in a small single centre study of haemodialysis patients, Mustata et al demonstrated that a 3 month exercise programme improved arterial stiffness, a surrogate marker of increased cardiovascular risk in ESRD. A typical class consisted of a 5- to 10-minute warm-up period, 40 to 50 minutes of conditioning exercise (either treadmill running or exercise bicycle), and a 5- 10minute cool-down(59). It is not clear how this approach would translate to the entire ESRD population.
1.2.6
Cigarette smoking
Of potentially modifiable risk cardiovascular risk factors in ESRD patients, perhaps less attention has been paid to cigarette smoking than other factors. In the USRDS Wave 2
52 study studying 4024 new dialysis patients smoking at the time of inception of dialysis was associated with a 37% increase in mortality, even after adjustment for co-morbidity. Ex-smokers had event rates similar to non smokers(60). Cigarette smoking also accelerates the progression of chronic renal failure. There are no trials to support which smoking cessation strategy is most effective in ESRD, but meta-analyses suggest that nicotine replacement therapy is part of an effective strategy in the general population(61).
1.2.7
Oxidative stress
Conditions predisposing to atherosclerosis, including hypercholesterolemia, diabetes mellitus, cigarette smoking and chronic kidney disease are associated with increased oxidative stress. The atherogenicity of low-density lipoprotein (LDL) is greatly increased upon oxidative modification(62) as, once oxidised, LDL is taken up by scavenger receptors on monocytes, leading to the conversion of monocytes into foam cells, one of the earliest steps in the development of atherosclerosis. Reactive oxygen species can also directly promote LDL oxidation, stimulate vascular smooth muscle cell proliferation and migration(63). Reactive oxygen species also activate several matrix metalloproteinases, which contribute to atherosclerotic plaque instability and rupture, thereby precipitating acute cardiovascular events(64). Oberg et al demonstrated that biomarkers of oxidative stress (plasma protein carbonyl group content, plasma free F2isoprostane content, plasma protein reduced thiol content) were significantly elevated in patients with chronic renal failure compared to healthy subjects(65). Haemodialysis (HD) may induce oxidative stress, primarily through membrane bio-incompatibility and endotoxin challenge. One study examining the relationship between haemodialysis and cardiovascular disease on serum malondialdehyde levels, a marker of oxidative stress found mean serum malondialdehyde levels were significantly elevated in dialysis
53 patients with cardiovascular disease(66). However to date no study exists examining the relationship between oxidative stress and long term outcome in ESRD patients.
A number of studies have addressed the issue of whether using antioxidant therapy would reduce the risk of cardiovascular events, both in patients at high risk of cardiovascular events in the general population and in ESRD. The Heart Protection Study randomised 20,536 UK adults (aged 40-80) with coronary disease, other occlusive arterial disease, or diabetes to receive antioxidant vitamin supplementation (600 mg vitamin E, 250 mg vitamin C, and 20 mg beta-carotene daily) or matching placebo. None of these interventions produced any significant reductions in the 5-year mortality from, or incidence of, any type of vascular disease, cancer, or other major outcome(67). Similarly in the Heart Outcomes Prevention Evaluation (HOPE) Study treatment with vitamin E had no apparent effect on cardiovascular outcomes(68). By contrast in the Cambridge Heart Antioxidant Study (CHAOS) in patients with angiographically proven coronary atherosclerosis, alpha-tocopherol (vitamin E) substantially reduced the rate of non-fatal myocardial infarction at one year(69). This study is out of keeping with the larger trials with longer follow up.
Interestingly in ESRD, alpha-tocopherol decreases LDL oxidation in ESRD patients. The benefit appears to be greater in patients on PD, which may be of clinical importance given the greater atherogenicity of lipid abnormalities in peritoneal dialysis(70). Building on this observation, the Secondary Prevention with Antioxidants of Cardiovascular disease in End stage renal disease study (SPACE), assigned haemodialysis patients with cardiovascular disease to high dose (800 IU/day) oral vitamin E or placebo. Vitamin E reduced the risk of the composite cardiovascular disease endpoints (myocardial infarction (fatal and non-fatal), ischaemic stroke,
54 peripheral vascular disease and unstable angina)(71). A similar large scale trial of antioxidant therapy as primary cardiovascular disease prevention is required in ESRD.
1.2.8
Uraemic cardiomyopathy as a cardiovascular risk factor
Cardiac abnormalities, specifically hypertrophy of the left ventricular wall, were first noted in ESRD by Richard Bright in 1827, where he postulated that it was caused by ‘the unusual efforts to which the heart has been impelled’(72). The presence of uraemic cardiomyopathy is strongly associated with adverse outcome in patients will ESRD. Echocardiographic studies report three patterns of cardiomyopathy – left ventricular hypertrophy (LVH) and LV dilatation and left ventricular systolic dysfunction (LVSD) that affect up to 90% of patients starting dialysis therapy(73). Each is associated with reduced survival compared with unaffected patients; effects that persist even after successful
transplantation(74).
Parfrey
et
al
have
demonstrated
that
the
echocardiographic prevalence of LVH is 50-80%, with left ventricular dilatation in 2040% and LVSD present in approximately 16% of patients in incident ESRD patients(75). When followed up over a 2 year period, these abnormalities were associated with a cumulatively poorer survival compared to those patients with normal ventricles after adjustment for other variables such as age, diabetes and ischaemic heart disease(76). Data from the USRDS registry has demonstrated similar findings with LVH a risk factor for poor outcome in incident dialysis patients(77). A schematic diagram of the potential relationships between ischaemic heart disease, sudden cardiac death and LVH is demonstrated in Figure 1.2.
LVH develops early in the course of chronic kidney disease and is associated with stiffening of the LV wall, a precursor to diastolic heart failure(78;79). The various permissive factors promoting LVH in uraemia will be discussed in detail in Chapter 5
55 but hypertension, anaemia, hyperparathyroidism and hypoalbuminaemia have all been associated with its development(80). Volume status is a key factor in determining blood pressure in ESRD and may make definition of LV chamber dimensions difficult(81).
Histological analysis of the heart in animal models of experimental renal failure shows that LVH is associated with an increase in cardiomyocyte volume(82). This, in turn, results in increased oxygen diffusion distance and subsequent cardiomyocyte ischaemia. Cardiomyocyte number may increase initially but subsequently is reduced(83). In subtotally nephrectomised rats, reduced capillary density per volume of myocardium is seen(84). Similar findings have been demonstrated in post mortem specimens of patients with ESRD(85). It is likely that apoptosis is triggered and increased fibrosis follows progressive myocyte death(82). Electrophysiological abnormalities in calcium handling have been demonstrated with abnormal sarcoplasmic calcium uptake, and increased cytosolic calcium concentrations of calcium in diastole(86-88). These electrophysiological changes lower the threshold for arrhythmia and underpin the evolution of diastolic heart failure.
LVH may be considered an adaptive process in response to increased myocardial work due to pressure and volume overload. Pressure overload tends to cause increased wall thickness with an unchanged or reduced LV cavity diameter (concentric hypertrophy), whilst volume overload promotes LV dilatation, with additional changes in wall thickness as an adaptive mechanism to reduce wall stress(89;90). This phenomenon is called eccentric hypertrophy. Both eccentric and concentric remodelling are common in ESRD patients. These remodelling processes are initially beneficial as dilatation allows an increase in stroke volume without increased inotropy, as well as permitting maintenance of stroke volume and cardiac output in the presence of decreased
56 contractility(91).
Physiological hypertrophy may additionally occur in response to
increased cardiac work, and the increase in LV mass is appropriate to LV volume such as in highly conditioned athletes(92). However, in dialysis patients the degree of hypertrophy may be inappropriate for the given ventricular stresses, either volume or pressure load, both of which are dramatically elevated(76). This has led to the term ‘inadequate hypertrophy’, and LVH may be either a precursor to the evolution of cardiac failure or arrhythmia in ESRD patients(93).
CRF/RRT/Renal Tx
Left
Ischaemic
Ventricular
Heart Disease
Hypertrophy
Left
Sudden
Myocardial
Ventricular Failure
Cardiac Death
Infarction
Figure 1.2 Schematic view of the relationship between ischaemic heart disease, LVH and sudden cardiac death in ESRD. Abbreviations CRF- chronic renal failure, RRT – renal replacement therapy, Tx - transplant
57 1.2.9
Sudden cardiac death
Sudden cardiac death is the cause of up to 60% of cardiovascular deaths in patients with ESRD. The risk of such an event increased with increasing time spent on renal replacement therapy. Although, high risk patients potentially can be identified- patients with LVH or LVSD, previous ischaemic heart disease or potentially using biomarkers such as brain natriuretic peptide (BNP) or troponin T(94), no proven strategy exists to reduce risk of this catastrophic event. Haemodialysis specific risks include pre-dialysis hyperkalaemia and intra-dialytic or post dialysis hypokalaemia. In a large retrospective analysis of dialysis related cardiac arrests (in centre up to 2 hours post dialysis), a low potassium dialysate (0 or 1 mmol/L) was identified as a risk factor for cardiac arrest. More cardiac arrests took place on Mondays, suggestive that fluid overload may also be a risk factor, after the ‘long gap’ of 2 days since the antecedent dialysis session(95). Evidence is emerging from patients with ischaemic heart disease and cardiac failure that implantable cardiac defibrillators, as a prophylaxis for sudden cardiac death, improve survival(96). Currently these are underused in the ESRD post cardiac arrest despite apparent association with improved survival(97). A prospective trial of implantable defibrillators for reduction of mortality in dialysis patients is warranted.
1.2.10 Haemodynamic and metabolic factors of CRF Additional to electrolyte shifts related to dialysis, alterations in volume status and hence blood pressure, may cause haemodynamic instability in the dialysis patient. Intermittent haemodialysis leads to rapid changes in fluid and solute status. Hypotension in particular, is a common cardiovascular complication of haemodialysis, which may vary in severity from minor, if troublesome side-effects such as nausea or dizziness, through to more severe cardiac or cerebral ischaemia. The pathogenesis of haemodialysis related hypertension is multi-factorial. The initial trigger is hypotension as the patient is
58 connected to the dialysis circuit. The main determinants of blood pressure control, which are deranged in ESRD, are intravascular volume preservation, vasoconstriction leading to increased systemic vascular resistance and maintenance of cardiac output by appropriate inotropic and chronotropic response(98).
During haemodialysis, fluid is removed from the intravascular space by ultrafiltration. As intravascular pressure drops, fluid is drawn from the interstitial space in an attempt to maintain intravascular volume. This however is incomplete and limited by the relative increase in extravascular osmotic pressure. Blood volume decreases leading to hypotension(99). Factors influencing this include ultrafiltration rate(100), fluid status of the patient(101), dialysate sodium(102), dialysate buffer(103), temperature(104), venous compliance and food intake which may lead to splanchnic blood pooling(105).
The appropriate response to dialysis related hypovolaemia is normally to increase systemic vascular resistance, by constriction of precapillary vessels. However in ESRD this mechanism is blunted. Although autonomic neuropathy affecting efferent sympathetic pathways may contribute to this disturbance (primarily found in diabetic patients), the dialysis treatment itself is a greater factor for impaired vascular response in this setting. Haemodialysis appears to be associated with impaired vascular reactivity during
hypovolaemia.
The
secretion
of
vasoconstrictive
peptides
such
as
catecholamines, vasopressin and renin is less pronounced with haemodialysis compared to say haemofiltration or isolated ultrafiltration(106). Other factors associated with vasodilatation related to haemodialysis include excess secretion of cytokines such as tumour necrosis factor-α and interleukin-1, perhaps related to the degree of biocompatibility
of
the
dialysis
membrane,
although
this
remains
controversial(107;108). The temperature of the dialysate in the extracorporeal circuit is
59 an additional feature influencing haemodynamic stability and control of systemic vascular resistance. Both the blood pressure response and vascular reactivity are improved with the use of cool (35-360C) compared to standard (37-380C) dialysate (104;109). This may either be due to reduced cutaneous vasodilatation, which may occur in a bid to reduce ‘excessive’ heat when warmer standard dialysate is used or the constrictive effect of blood vessels to maintain a constant core temperature when a cooler dialysate is used.
Maintenance of cardiac output in response to hypovolaemia related to dialysis is mainly dependent on pre-existing cardiac function which is discussed elsewhere. Left ventricular diastolic or systolic dysfunction where present impair the heart’s ability to maintain cardiac output. Other factors such as autonomic neuropathy and drug therapy with beta-blockade may impair the chronotropic response. Cardiac function may paradoxically improve during dialysis due to a combination of fluid removal reducing after load, the removal of postulated cardiodepressor uraemic toxins (or acidosis) or due to the use of increased dialysate calcium which has a positive inotropic effect(110;111). Factors specific to dialysis which may reduce cardiac output include impaired ventricular filling due to reduced venous return. The presence of the arteriovenous fistula used for dialysis access causes increased cardiac output, promoting LVH and may lead to high output cardiac failure(112).
For the period when the patient is not on dialysis therapy, the relationship between volume status, blood pressure and systemic vascular response is complex with debate about the relative importance of increased peripheral resistance and increased intravascular volume on the development of hypertension in ESRD. In one pilot study from our group, cardiac output was lower in haemodialysis patients than in a small
60 group of normal subjects, because of a lower stroke volume in the dialysis group(113). As the blood pressure was the same, calculated peripheral resistance was thus higher in the dialysis group compared with controls. In the dialysis group there is a very convincing relationship between end diastolic volume (a reflection of intravascular volume), cardiac output and blood pressure. No such relationship was found between calculated peripheral resistance and any blood pressure variable, suggesting that intravascular volume plays a larger role than increased vascular resistance in the determination of blood pressure in patients on haemodialysis, or is at least the most variable factor. This is consistent with the effects of reduction of intravascular volume (‘dry weight’) and improved blood pressure control on dialysis(114;115). Although there was no correlation between systemic vascular resistance and blood pressure parameters, systemic vascular resistance was higher in haemodialysis patients. Thus, for a given cardiac output, the achieved blood pressure is substantially greater in haemodialysis patients than in controls. Whether this increase in systemic vascular resistance is a functional consequence of increased vascular tone or of structural changes in the vessel wall is unclear, although it is clearly important as vasodilators are likely to be effective against the former, whereas reversal of strategies structural changes (e.g. associated with calcification) are likely to be more difficult.
1.2.11 Proteinuria Microalbuminuria (30 to 300mg/day) was first identified as risk factor for cardiovascular disease in patients with diabetes in 1984(116). Subsequently, data from the Framingham studies have shown that proteinuria is a risk factor for cardiovascular mortality in the general population(117). Similar findings have emerged from other large epidemiological studies that either proteinuria or microalbuminuria are not only predictive of progression of renal disease but also of future cardiovascular events(118).
61 Analyses from the Prevention of Vascular and End Stage Renal Disease (PREVEND) study shows clearly that urinary albumin acts as a continuous risk factor for cardiovascular events with no lower limit(119). Microalbuminuria and proteinuria have been accepted to represent a consequence of renal damage. However, Deckert et al proposed in 1989 that albumin leakage is a reflection of widespread vascular damage, with the kidney as a ‘window’ to the vasculature(120). This hypothesis has been reinforced by studies demonstrating that microalbuminuria is associated with changes in endothelial dysfunction in patients with diabetes(121). The Irbesartan in Patients with Type 2 Diabetes and Microalbuminuria (IRMA-2) study, evaluating the effect of the angiotensin II antagonist irbesartan, demonstrated that reduction of albuminuria in microalbuminuric hypertensive patients with type II diabetes was associated with renal protection and some degree of cardiovascular protection although this study was not powered to address the effect on cardiovascular events(122). From the standpoint of the patient with ESRD, as albuminuria or proteinuria are both markers of cardiovascular risk and of progression of renal disease towards ESRD, it seems likely that proteinuria is a cardiovascular risk factor, which whilst present in some patients in the general population, is grossly overrepresented in patients at the onset of dialysis therapy.
1.2.12 Anaemia The presence of anaemia, secondary to erythropoietin deficiency is an almost universal finding in patients with ESRD. This is strongly associated with increased mortality and morbidity in patients on maintenance haemodialysis(123). Anaemia has been consistently linked with the development and progression of cardiac structural changes in patients with chronic renal failure. In patients with chronic renal failure, haemoglobin starts to fall as glomerular filtration rate drops to between 25 and 50 ml/min and Levin et al demonstrated that in patients with advanced pre-dialysis renal failure each 0.5g/dL
62 fall in haemoglobin was associated with a increased LV mass(124). However, the outcome of studies directed at haemoglobin correction, either to reduce progression of LVH or to reduce cardiovascular events have generally been associated with increased mortality in patients randomised to achieve a higher haemoglobin with erythropoietin therapy(125-128). Lower haemoglobin is likely to be found in ‘sicker’ patients with more evidence of inflammation and malnutrition, and therefore it is not surprising that anaemia is associated with increased mortality. What is less clear is what the target haemoglobin should be in dialysis patients, and the optimum time to commence correctional therapy with erythropoietin. The relationship between haemoglobin and uraemic cardiomyopathy and outcome is further discussed in Chapter 5.
1.2.13 Homocysteine Homocysteine is a sulphur containing amino acid, formed during the conversion of methionine to cysteine. The concept of homocysteine being atherogenic arose from the observation that patients with homocystinuria, an autosomal recessive condition, characterised
by
the
accumulation
of
homocysteine
experienced
premature
cardiovascular death. Epidemiological studies have demonstrated an association between hyperhomocysteinaemia and atherosclerotic vascular disease. Normal metabolism of homocysteine is either by transsulfuration to cysteine (vitamin B6 dependent) or remethylation to methionine (vitamin B12 and folate dependent). In renal failure it is suggested that remethylation is impaired leading to accumulation of homocysteine. Hyperhomocysteinaemia has been associated with increased risk of cardiovascular events in patients with ESRD in a number of observational studies(129131).
63 One large trial of B vitamin (2.5 mg of folic acid, 50 mg of vitamin B6, and 1 mg of vitamin B12) supplementation in the general population to reduce cardiovascular events was disappointing, with no significant reduction in risk(132). In dialysis patients, despite evidence that reduction of serum homocysteine levels can be achieved with folic acid, randomised controlled trials have demonstrated that folic acid supplementation in ESRD is not associated with reduction of cardiovascular events(133) or a reduction in atheroma progression(134). Indeed, further analysis have suggested paradoxically that some patients with higher homocysteine levels are at reduced risk(133;135) forwarding the hypothesis, that homocysteine levels may be a nutritional marker in dialysis patients in the absence of inflammation, a frequent confounder of other markers of interpretation of nutritional status (albumin) in ESRD. This represents a further example of the ‘reverse epidemiology’ (akin to cholesterol) of cardiovascular risk factors where conventional cardiovascular risk factors in the general population have the reverse relationship with outcome in the ESRD population.
1.2.14 Hyperparathyroidism,
calcium-phosphate
metabolism
and
arterial
calcification Hyperparathyroidism is one of the hallmarks of chronic renal failure and is a result of chronic
hyperphosphataemia
and
hypocalcaemia.
Secondary
and
tertiary
hyperparathyroidism result in the spectrum of renal bone disease including osteitis fibrosa cystica and mixed renal osteodystrophy. Observational studies demonstrate that as well as being a risk factor for fractures (136), raised serum PTH levels are a risk factor for mortality in dialysis patients(137;138). It is now recognised that parathyroid hormone (PTH) has potentially negative cardiovascular effects. In animal models of uraemia PTH has been demonstrated to promote cardiac interstitial fibrosis and arteriolar thickening(139). PTH has also been shown to stimulate cardiac accumulation
64 of calcium in myocytes leading to scarring(140). The role of PTH in promoting LVH is further discussed in Chapter 5.
Like hyperparathyroidism, hyperphosphataemia is almost inevitable in patients with ESRD and registry data supports that even mild hyperphosphataemia is an independent predictor of mortality in dialysis patients(137;138;141). Although poor phosphate control may be a reflection of under dialysis, it has become clear that phosphorus retention promotes vascular calcification, perhaps by inducing transformation of vascular smooth muscle cells into an osteoblast-like phenotype(142). Total body calcium or calcium phosphate product as well as PTH have been recognised to be the other key determinants of vascular calcification. Other clinical factors consistently associated with the development of vascular calcification include age, duration on renal replacement therapy, PTH, homocysteine and degree of inflammation(143-147).
Although patients with ESRD, if left untreated, would be calcium deficient due to failure of synthesis of 1,25-dihydroxyvitamin D3, the combination of treatment with vitamin D analogues to suppress PTH, combined with calcium containing phosphate binders may lead to overall normalised or high body calcium levels. The presence and degree of coronary artery calcification, demonstrated in young adult dialysis patients by electron beam computed tomography, has been associated with ingestion of large amounts of calcium containing phosphate binders and a greater elevation in the calciumphosphate product(144). Until fairly recently, options for controlling phosphate with phosphate binding medication were limited to compounds containing either calcium or aluminium. The non-calcium containing binder sevelamer hydrochloride has been demonstrated to be associated with a lesser degree of progression of coronary artery calcification in patients new to haemodialysis therapy, compared to those taking
65 calcium containing phosphate binders(143). It has been suggested that this reduction in vascular calcification using non calcium containing phosphate binders may translate into a survival benefit for these patients(148).
1.2.15 Inflammation and C-Reactive protein Chronic inflammation is indicated by raised serum C-reactive protein (CRP), a hepatic derived acute phase protein. CRP is raised in response to a number of conditions where inflammation may be present including infection, trauma, infarction and malignancy. The acute phase response is driven by cytokines including interleukin-1, interleukin-6, interferon-gamma, tumour necrosis factor-α, and transforming growth factor-β.
In
healthy individuals elevated CRP is a risk factor for future coronary events(149;150) as well as in patients with diabetes(151), whilst in patients with acute myocardial infarction, CRP predicts mortality within the first 30 days post infarct (152). Whether CRP is simply an additional marker for established coronary risk factors, such as dyslipidaemia or perhaps the inflammatory nature of the high risk atherosclerotic coronary plaque, or represents a further additive risk factor is less clear. The is no doubt that raised CRP correlates with the cluster of atherogenic risk factors found in the metabolic syndrome(153). Supporting the notion that CRP is directly atherogenic, in vitro studies have demonstrated the presence of CRP in atherosclerotic coronary plaque(154), whilst CRP and matrix metalloproteinase co-localise in the endothelial layer and macrophage-rich areas in atherosclerotic plaques suggesting that CRP has a role in rupture of the ‘vulnerable’ plaque(155). Finally, statins have been demonstrated to lower serum CRP, with greatest clinical benefit derived in patients with a larger magnitude of CRP reduction in response to therapy(156).
66 Patients with ESRD tend to have higher CRP levels, and this is predictive of cardiovascular
outcome
in
both
haemodialysis
and
peritoneal
dialysis
patients(157;158)whilst higher levels interleukin-6 have also been associated
with
increased mortality(159). Possible explanations for elevated CRP in ESRD include direct inflammatory effects of uraemia, chronic infection of vascular access, the presence of indwelling peritoneal or vascular dialysis catheters, bio-incompatibility of haemodialysis membranes or peritoneal dialysis fluids or impurities of water supply used for dialysis.
The association between atherosclerosis and inflammation (together with associated poor nutritional status) in dialysis patients have given rise to the hypothesis of the so called malnutrition, inflammation, and atherosclerosis (MIA) syndrome(160). If truly present this relationship may explain the cholesterol paradox in ESRD patients. One intriguing study addressing this issue performed by Liu and colleagues followed up 823 chronic haemodialysis patients for a median of 2.4 years, and categorised the study population into 2 subgroups based on the presence or absence of inflammation and/or malnutrition (defined as achievement of specified cut-offs for any of serum albumin, CRP and interleukin-6)(35). Overall, 77% of the patients had evidence of inflammation/malnutrition, which was associated with older age, increased comorbidity, prevalent CV disease, diabetes, and lower total cholesterol levels. A Ushaped association between cholesterol levels and mortality was seen in the overall cohort and in the subgroup with inflammation/malnutrition. However, in the absence of inflammation/malnutrition, total cholesterol was positively associated with all-cause mortality and even more strongly associated with CV mortality. These results give insights into novel methods to address the frequently perplexing issue of the reverse epidemiology of cardiovascular disease in patients with renal failure.
67 1.3
Assessment of uraemic cardiomyopathy with echocardiography
Echocardiography involves the application of ultrasound in the frequency range of 2 to 10 MHz. The technique requires an ultrasound transducer consisting of a series of piezoelectric crystals, that when electrically activated, emit ultrasound energy. Returning ultrasound energy is converted by the piezoelectric crystal into radiofrequency energy which is processed to digital information by high-speed by digital converters within the ultrasound platform.
The simplest image is the M-mode echocardiogram. An M-mode echocardiogram is acquired by interrogating returning ultrasound signals along a single plane with the images generated recorded on a scrolling video screen. The operator can select this plane to obtain an M-mode image. This plane line can be swept through an area of cardiac anatomy and the image then displayed as a series of concurrent M-mode images. M-mode echocardiography was once the foundation of anatomical diagnosis but has been to an extent abandoned in favour of 90-degree two-dimensional scanning. However, M-mode does confer higher temporal resolution than two-dimensional echocardiography and may provide a higher degree of resolution than two-dimensional scanning. In general, however, its clinical role, as a stand-alone technique, has been largely supplanted by two-dimensional echocardiography. It remains widely used as a method for estimation of LV mass, both for clinical practise as well as in interventional studies. Conventionally “cube” methods, which using M-mode septal, posterior wall, and left ventricular internal dimensions have been used to measure LV mass. These methods assume normal ventricular geometry. More recently, several two-dimensional methods have been shown to provide enhanced accuracy, especially in abnormally shaped ventricles(161).
68 Echocardiography provides an excellent method for quantification of ventricular function. Linear measurements such as LV wall thickness, internal chamber dimensions, and derived parameters such as fractional shortening traditionally have been obtained from M-mode echocardiography. Normal values for adults are well established(162164). Global ventricular function and cardiac volumes can be measured with a variety of methods using two-dimensional echocardiography, with Simpson’s rule being the most commonly used for quantification of ventricular volume. Determination of left ventricular volume requires manual tracings of the endocardial border in diastole and systole. Once the chamber volumes have been determined, ejection fraction can be calculated. Echocardiographic methods will be discussed in greater detail in Chapters 2 and 4.
Echocardiographic abnormalities have been described in patients with ESRD as early as the 1970s. Initially, as uraemic pericarditis was one of the cardinal features of advanced presentation of ESRD, echocardiography was a key tool in the diagnosis and management of haemorrhagic pericardial effusions. However, abnormal thickening of the
LV
wall
as
well
as
valvular
calcification,
were
soon
demonstrated
echocardiographically(165) and the prognostic implications of these findings emerged with the expansion of dialysis programmes. Studies from the Canadian dialysis population have demonstrated the importance of LV abnormalities as discussed previously(73;76). However, as echocardiographic measurement of LV mass and function is dependent on LV chamber dimensions, care must be taken in assessing LV structure and performance in patients with ESRD. It is well-established that changes in volume status in these patients during both the inter- and intra-dialytic period result in substantial changes in LV chamber dimensions(81;166), with any potential error in echocardiographic measures being amplified by the assumptions of cubed formulae.
69 Additionally changes in volume status affect both pre- and after-load. To what extent the changing loading conditions contribute to a change in LV function parameters is difficult to determine. A lower ejection fraction after dialysis may result from a decrease in contractility either de novo or in response to myocardial ischaemia invoked by the haemodynamic demands of dialysis, but also from a decreased preload, an increased after load or a combination thereof.
A ‘volume-independent’ assessment of LV dimensions in ESRD is an extremely attractive concept. Newer echocardiographic techniques such as 3-dimensional echocardiography may be promising but are untested in this population. Whilst LV chamber dimensions remain subject to the hydration status of the patient regardless of imaging method, by using a high resolution method such as cardiac magnetic resonance imaging (CMR) to delineate myocardial dimensions, the presence of structural cardiovascular disease may be more accurately defined in this population.
1.4
Cardiovascular magnetic resonance imaging
Rapid progress has been made with CMR over the past decade, and this has become established as a reliable and clinically important technique for assessment of cardiac structure and function. Furthermore, by using contrast based techniques, myocardial perfusion and viability can be assessed. CMR is non-invasive and avoids the use of ionising radiation. Progress in CMR technology may further widen its clinical application in coronary artery imaging, assessment of valvular heart disease and identification of vulnerable atheromatous coronary plaque.
70 1.4.1
Principles of cardiac magnetic resonance imaging
CMR (and all magnetic resonance imaging) is based on the principle of nuclear magnetic resonance. Images are generated from signals produced by protons (hydrogen nuclei). The human body consists of mainly of water, an abundant source of hydrogen ions. The proton behaves like a small magnet when placed in a magnetic field, aligning itself with the field and precessing with a frequency that depends on the magnetic field strength. Protons align parallel and anti-parallel to the direction of the primary field, with a small excess of parallel protons that gives rise to a net magnetisation vector. This net vector can be rotated by application of a second temporary radiofrequency (RF) pulse. Once this pulse ceases, the magnetisation vector recovers to its former position, releasing a signal in the form of radio waves. This relaxation of the net vector is attributable to two distinct but simultaneous processes, longitudinal (T1) and the transverse (T2) relaxations(167;168) A pulse sequence consists of a series of RF pulses of varying duration or strength and application of magnetic-field gradients that are adjusted to highlight desired tissue characteristics.
Basic pulse sequences used in CMR are spin-echo and gradient-echo sequences. Spinecho sequences are often used for assessment of cardiac morphology, and flowing blood normally appears black. Gradient-echo sequences have a lower soft-tissue contrast compared with spin-echo, and flowing blood is represented by high signal intensity and turbulence as areas of signal void. Gradient-echo sequences are used to assess valvular lesions, shunts, and great vessels as well as for measurement of ventricular function and wall-motion characteristics. Flowing blood across a magnetic gradient can be encoded to quantify flow. These phase-encoded velocity maps are based on the principle that magnetic vectors of flowing protons acquire a phase shift that is proportional to flow
71 velocity. This technique is used to assess flow volumes and velocity profiles across valves and shunts.
Cardiac and respiratory motion artefact can cause difficulty acquiring CMR images. Using breath-hold electrocardiograph-gated techniques to acquire images minimises such artefacts. The presence of cardiac arrhythmias such as atrial fibrillation may interfere with synchronised data acquisition.
1.4.2
Cardiac magnetic resonance imaging for assessment of cardiac function
Unlike echocardiography, where LV mass and dimensions are derived from one- or two-dimensional data, using assumptions of cardiac geometry, with CMR, actual myocardial mass and volumes are obtained. A Simpson’s rule algorithm is still used, but acquired using three-dimensional data from a series of thin slices with no geometric assumptions. Therefore, CMR has become established as the ‘gold standard’ noninvasive reference standard for cardiac function and mass. Data are acquired using bright blood gradient-echo sequences, obtained during a 15- to 20-s breath-hold, are used to cover the entire left ventricle (LV) with short-axis views from the mitral plane and slice thickness of 10 mm. In these studies a TrueFISP (fast imaging with steadystate precession) sequence is used. Individual CMR scanner manufacturers have their own nomenclature for the various imaging sequences, with TrueFISP being that used for this pulsed gradient-echo sequence by Siemens (Erlangan, Germany). The actual CMR protocol used is described in detail in Chapter 2.
Using these techniques, published normal reference ranges for cardiac dimensions and function have been generated(169). As CMR sequences evolve, it is important to use the appropriate reference range for the sequence used to acquire the data as small but
72 statistically significant differences in LV dimensions have been described between images acquired of the same patients with TrueFISP and FLASH (fast low-angle shot), an alternative gradient-echo sequence(170).
1.4.3
Gadolinium based contrast agents for cardiac magnetic resonance imaging
All the currently approved CMR contrast agents use gadolinium which has paramagnetic properties. Gadolinium based contrast acts as an extracellular contrast agent with a ‘fast wash in/slow wash out’ characteristics. Gadolinium itself is toxic, and therefore is chelated to a variety of molecules depending on the agent used. This chelate has some effect on the pharmacokinetics of the agent and in the case of Gd-BOPTA (Multihance), further changes the paramagnetic properties of the product. The molecular weights of these agents range between 650 and 2,000 Daltons and their mechanism of action is to shorten T1 relaxation of tissue within the magnetic field.
During the first pass after rapid intravenous injection of contrast, extracellular agents diffuse into the interstitium of the tissues, except in the brain and testes. Approximately 40% of intravenously injected extracellular agents diffuse from the blood into the interstitium during the first pass(171). By tracking a bolus as it transits through a region of interest, time-intensity curves can be generated and used to determine myocardial perfusion. In the presence of altered interstitial tissue architecture, e.g. due to oedema, necrosis, fibrosis or inflammation (or any combination of these factors), passage of the gadolinium chelate will be delayed through the myocardial tissue. This will be indicated by the presence of late gadolinium enhancement (LGE), when this tissue is imaged, typically achieved approximately 5 minutes after bolus injection. Over a period typically lasting several minutes, the agent diffuses back into the blood pool, from which it is excreted by the kidneys.
73 Gadolinium based agents currently in use for cardiac imaging include Omniscan (gadodiamide, GE Healthcare, UK), Magnevist (gadopentetate dimeglumine, Gadovist, Schering AG, Berlin, Germany), MultiHance (gadobenate dimeglumine, Bracco, Bracco S.p.A., Milan, Italy), Gadovist (gadobutrol, Schering AG, Berlin, Germany), OptiMARK
(gadoversetamide, Tyco Healthcare, Hazelwood, Minnesota, United
States) and ProHance (gadoteridol, Bracco, Princeton, New Jersey, United States).
1.4.4
Cardiac magnetic imaging for assessment of ischaemic heart disease
CMR is an excellent technique for defining the presence and extent of both acute and chronic myocardial infarction. Like echocardiography, wall motion abnormalities may be present on cine images, suggestive of ischaemic myocardial damage. On first-pass perfusion images with contrast, an area of hypo-enhancement is seen within the infarcted region, correlating with microvascular obstruction inside the infarct zone (172), Figure 1.3. In the presence of chronic myocardial infarction the presence of LGE 5 to 30 min after contrast injection is seen using a turbo FLASH inversion-recovery sequence, Figure 1.4. In acute infarction, LGE reflects myocardial necrosis and abnormal contrast molecule kinetics within infarcts with associated tissue oedema, whereas in chronic infarction, it reflects increased concentration of gadolinium nonviable, infarcted scar tissue(173;174). Combining the extent of LGE, may indicate the presence of viable ‘hibernating’ myocardium. A myocardial segment with a wall motion abnormality and no LGE may represent myocardial hibernation which may recover with revascularisation, whilst non viable myocardium typically has >75% thickness of tissue demonstrating LGE(175).
Coronary angiography with CMR is an attractive concept and may yet become a noninvasive diagnostic method. Currently, the small size of coronary arteries, their complex
74 course, and constant motion with cardiac contraction and respiration has made angiography technically difficult. CMR however can evaluate coronary blood flow of myocardial perfusion with first-pass contrast enhanced imaging before and after pharmacologically induced hyperaemia, usually with adenosine. This method has a have high diagnostic accuracy for detection of coronary artery disease with myocardial perfusion reserve having a sensitivity, specificity, and diagnostic accuracy of 90%, 83%, and 87%, respectively, for detection of a >75%, coronary artery stenosis(176). This technique clearly has great potential for non invasive diagnosis of coronary artery disease.
75
Figure 1.3 First pass imaging demonstrating an area of hypoenhancemnt (arrowed) in keeping with a myocardial perfusion deficit in a patient with a recent lateral myocardial infarction
Figure 1.4 Late gadolinium enhancement representing infarcted myocardial tissue in the lateral wall of the left ventricle in the same patient as Figure 1.3
76 1.4.5
Cardiac magnetic resonance imaging for assessment of cardiomyopathy
CMR allows accurate definition of cardiac structure, function and geometry in the presence of cardiomyopathy. Furthermore, the ability of contrast enhanced CMR to detect areas of tissue fibrosis has allowed detailed study of myocardial composition in a number of cardiomyopathies characterised by the presence of fibrotic tissue (usually collagen) within the myocardium. To date there has been extremely limited study of uraemic cardiomyopathy with CMR, with one small study with CMR from our own group
describing
LVH
morphologically
in
haemodialysis
patients.
Other
cardiomyopathies have been analysed in more detail. Hypertrophic cardiomyopathy has been intensively studied with CMR (Figure 1.5) and CMR allows both demonstration of the degree of hypertrophy, the phenotypic expression of the pathological fibrosis(177), degree of left ventricular outflow tract obstruction, systolic anterior motion of the mitral valve and can monitor after surgical and pharmacologic interventions(178) or alcohol septal artery ablation(179).
Other cardiomyopathies involving myocardial fibrosis where CMR may be useful in either the diagnosis or long term management include arrhythmogenic right-ventricular cardiomyopathy and dilated cardiomyopathy. In arrhythmogenic right-ventricular cardiomyopathy CMR can demonstrate fatty infiltration of the right ventricle and by detecting characteristic high signal intensity of fat on spin-echo images within the right ventricular myocardium, the presence of fat in the right ventricular wall can be demonstrated and then confirmed with fat suppression techniques. Diffuse and focal thinning and local aneurysms of the right ventricle can be also be detected (180;181). Areas of myocardial fibrosis have been described in dilated cardiomyopathy, and CMR may be a useful method of discriminating dilated from ischaemic cardiomyopathy in patients with heart failure of unknown aetiology(182).
77 Inflammatory and infiltrative cardiomyopathies have also been described using CMR. In sarcoidosis, infiltrates in myocardium can be are seen as areas of amplified T2 signal intensity (attributable to inflammation, oedema, and granulomas), which enhance after administration of gadolinium. CMR can non-invasively assess response to steroid treatment(183). In acute myocarditis contrast enhancement is present in approximately 90% of patients and correlates with active inflammation defined by histopathology (Figure 1.6)(184). In cardiac amyloidosis, CMR initially allows accurate demonstration of the presence of thickening of the right atrial and right ventricular wall. Following administration of gadolinium in patients with cardiac amyloid, CMR shows a characteristic pattern of global subendocardial late enhancement coupled with abnormal myocardial and blood-pool gadolinium kinetics(185). Additionally, endomyocardial fibrosis (also termed Loeffler’s endocarditis), which is characterised by extensive subendocardial fibrosis, apical thrombus formation, and progressive diastolic dysfunction can be quantified using CMR(186).
Recently, the ferromagnetic properties attributable to the deposition of iron in myocardial tissue have been exploited to initially assess the degree of iron overload in the heart of patients with thalassaemia. Myocardial iron loading is assessed with the use of myocardial T2* relaxation characteristics at CMR. This approach has subsequently been used to guide iron chelation therapy in these patients and myocardial T2* has been used as an end point in a clinical trial demonstrating superiority of combination chelation treatment with deferiprone and deferoxamine in comparison to deferoxamine monotherapy, in thalassaemia major patients with mild to moderate cardiac iron loading(187).
78 1.4.6
Contraindications to cardiac magnetic resonance imaging
Patients with claustrophobia may not tolerate study with CMR. The presence of a cardiac pacemaker or implantable cardiac defibrillator remains an absolute contraindication to study with CMR. There are some reports of patients with pacemakers undergoing CMR without adverse outcome, but this should be only be carried out in a controlled environment, with facilities for both close monitoring and reprogramming of the pacemaker immediately available, and for the purpose of general clinical and research use, a pacemaker remains an absolute contraindication to scanning(188). The presence of intraocular metallic shards (e.g. welders) and intracerebral clips or shunts are also contraindications to scanning. Metallic implants can lead to artefacts, which might degrade images. Most cardiac prosthetic valves and coronary stents presently in use are safe for CMR at available clinical field strengths.
79
Figure 1.5 Extensive chaotic myocardial collagen deposition indicated by late gadolinium enhancement in a patient with hypertrophic cardiomyopathy
Figure 1.6 Patchy late gadolinium enhancement demon demonstrated in both the septum and lateral walls of the left ventricle in a patient with acute myocarditis
80 1.5 Redefinition of uraemic cardiomyopathy with cardiovascular magnetic resonance imaging Despite the dramatically increased cardiovascular risk in ESRD, the relationship between risk factors, interventions and outcome is unclear. One of the few factors to have consistently been demonstrated to indicate poor outcome is uraemic cardiomyopathy, defined by echocardiography. However, as discussed, it is possible that some echocardiographic abnormalities widely present in ESRD, such as LVH may be at best overestimated, as suggested by the one previous report using CMR, or even artefactual(189). Although a variety of myocardial tissue abnormalities have been described either in animal models of uraemia or in post mortem studies of ESRD patients, no method has been able to non invasively describe this histopathological finding in vivo. The previous studies of other cardiomyopathies, with some similar histological correlates suggest that CMR has the potential to perform this function. Furthermore, very few CMR studies have been able to assess the long term implications of either morphological ventricular abnormalities or whether the presence of LGE confers increased risk of cardiovascular events or mortality.
All these factors suggest that there would be benefits from studying a cohort of patients with ESRD using CMR. Hopefully, by more accurately characterising cardiac abnormalities in this patient group, novel therapeutic targets for intervention may be identifies. The relationship between ischaemic heart disease and uraemic heart disease is imprecise. If systolic dysfunction, is due primarily to uraemia, then increasing doses of dialysis may be beneficial, on the assumption that myocardial contractility is suppressed by some (potentially undiscovered or least not yet causally linked) ‘uraemic factor’. Renal transplantation is a definitive treatment for uraemia, but unfortunately the current supply of cadaveric organs is outstripped by demand. On the other hand, if as in the
81 general population, ischaemic heart disease is the leading cause of systolic dysfunction, then evidenced based medical therapy with inhibitors of the renin angiotensin system and beta blockade would be an appropriate strategy. The question of lipid lowering therapy remains unresolved, but requires further study. Many of these agents are currently underused in the ESRD population, and often poorly tolerated.
One further intriguing notion would be to predict the patients at highest risk of sudden cardiovascular death. The recent finding that the presence of myocardial fibrosis demonstrated by CMR was associated with increased risk of ventricular arrhythmia in patients with dilated cardiomyopathy(190), suggests that CMR may have a role in risk stratification for such patients. The same may apply in ESRD, with the highest risk patients being candidates for implantable cardiac defibrillators.
Finally as CMR technology evolves, new methods for imaging and analysis emerge, dependent on the clinical needs of the cohorts of patients examined. Often these techniques may be applicable, across a wider range of patients than previously envisaged. As a unique group of patients at very high cardiovascular risk, patients with ESRD may have distinct differences in both cardiac and vascular function, allowing insights into factors responsible for the pathogenesis of cardiovascular disease in the general population. Abnormalities in these factors which are severely distorted in ESRD, such as arterial stiffness, may be expressed more subtly in the general population. Studying a cohort of ESRD patients may allow novel CMR methods to be developed to investigate cardiac and vascular markers of cardiovascular risk, to the advantage of research into cardiovascular disease in the general population.
82 1.6 Aims of this project The principal aims of this project were: •
To establish the presence and prevalence of left ventricular abnormalities (‘uraemic cardiomyopathy’), in a cohort of patients with ESRD using CMR
•
To establish the relationship between uraemic cardiomyopathy and conventional cardiovascular risk factors
•
Establish the prognostic impact of the presence of uraemic cardiomyopathy described by CMR
Secondary aims: •
To compare conventional methods of defining uraemic cardiomyopathy such as echocardiography with CMR
•
To examine whether vascular function could be assessed using CMR
•
To determine methods of identifying patients with uraemic cardiomyopathy, in particular left ventricular hypertrophy using the conventional method of echocardiography
1.6.1
Hypothesis
The studies performed are designed to test the hypothesis that specific left ventricular and vascular abnormalities can be identified in patients with ESRD and that these abnormalities have an influence on long term survival of these patients.
83 1.7
Outline of the studies contained within this thesis
Seven principal studies were performed and are detailed in Chapters 3-9:
Chapter 3 :
A study of ventricular dimensions and function in uraemia with contrast enhanced cardiac magnetic resonance imaging.
Chapter 4 :
A comparative study of echocardiography and electrocardiography with cardiac magnetic resonance imaging.
Chapter 5 :
A study of the determinants of uraemic cardiomyopathy.
Chapter 6 :
Survival of patients undergoing cardiovascular screening for renal transplantation.
Chapter 7 :
A study of the diagnostic utility of brain natriuretic peptide in end stage renal disease.
Chapter 8 :
A study of vascular function with cardiovascular magnetic resonance imaging in end stage renal disease.
Chapter 9 :
A study of dermatological complications of contrast enhanced magnetic resonance imaging.
84
Chapter 2
Materials and Methods
85 2.1
Introduction
The principal technique used for this thesis was cardiovascular magnetic resonance imaging
(CMR).
This
was
supplemented
with
echocardiography and exercise tolerance testing.
electrocardiography
(ECG),
In this chapter the background,
methods, apparatus and protocols used for these techniques will be outlined.
2.2
Ethics Committee approval
The studies performed in this thesis were approved by the North Glasgow Hospitals University NHS Trust Ethics Committee. All subjects gave written informed consent, the forms being approved by the Ethics Committee.
2.2.1
Subjects
Patients with advanced renal failure were recruited from the renal transplant assessment clinic at the Western Infirmary. At inception of the study, patients attending the renal transplant assessment clinic were required to be established on dialysis therapy. The study extended to those patients anticipated to commence dialysis therapy within six months in keeping with changes in British Transplant Society recommendations regarding eligibility for cadaveric renal transplantation. Therefore using KDOQI classification all patients studied would be classified as chronic kidney disease stage 5(191). As cardiovascular disease is the leading cause of both early (with 30 days of surgery) and late patient death with a functioning renal transplant, patients considered to be at increased cardiovascular risk for renal transplantation were referred for cardiovascular screening by the renal transplant co-ordinator. At this point, patients were asked if they were willing to undergo CMR by the investigator (PM). Patients were considered to be at increased cardiovascular risk if any of the following criteria were present, in keeping with published guidelines(192):
86 •
Age ≥50
•
Presence of diabetes mellitus
•
History of cigarette smoking
•
Previous history of ischaemic heart disease
•
Previous history of peripheral or cerebrovascular disease
•
Strong family history of cardiovascular disease
•
Documented history of left ventricular abnormalities
•
ECG or previous cardiac stress test suggestive of underlying ischaemic heart disease
•
The opinion of the consultant transplant surgeon or consultant nephrologist
All subjects who underwent CMR gave written informed consent and this strategy was approved by the consultant nephrologists and surgeons involved in the transplant assessment process with the protocol approved by the local ethics committee. All patients underwent conventional cardiovascular risk factor assessment including history, clinical examination, ECG and blood sampling. A history of IHD was defined as previous myocardial infarction or angina pectoris, and hypercholesterolaemia was defined as fasting total serum cholesterol >5.0 mmol/L or use of statin therapy. The decision to list a patient for transplantation was not influenced by CMR findings, and was made by an independent transplant surgeon and nephrologist taken on the basis of clinical findings and additional investigations such as exercise testing, myocardial perfusion scanning and coronary angiography as clinically indicated. Due to ethical concerns regarding the potential risks of invasive procedures such as coronary angiography, this was only performed as clinically indicated as judged by an independent cardiologist, and not as part of study protocol.
87 2.2.2
Exclusion criteria
Exclusion criteria were contraindications to magnetic resonance scanning (permanent pacemaker, implanted ferromagnetic objects, pregnancy, and extreme claustrophobia). Two otherwise eligible patients were also screened and excluded with a documented history or echocardiographic evidence of hypertrophic cardiomyopathy and one further patient with a history of thalassaemia and repeated blood transfusions was excluded; both of which have been associated with characteristic CMR findings(177;187). There was no evidence of other cause of cardiomyopathy (e.g. amyloidosis, Fabry’s disease, sarcoidosis, iron overload) in study patients based on clinical (original renal disease, serum ferritin, and clinical review) and echocardiographic findings.
2.3
Cardiovascular Magnetic Resonance Imaging
2.3.1
CMR scan
CMR was performed using a 1.5 Tesla MRI scanner (Siemens Sonata, Erlangan, Germany). As described previously CMR provides a high fidelity, volume independent method for assessing cardiac dimensions and function. To minimise influence of hydration status on ventricular chamber dimensions CMR scanning was performed on the post-dialysis day in patients on haemodialysis, and with patients at their ‘dry weight’ in patients on peritoneal dialysis, according to clinical charts. All scanning was performed by the investigator (PM) or a cardiac radiographer (Tracey Steedman, Glasgow CMR Unit, Western Infirmary, Glasgow).
2.3.2
Contrast agent
The paramagnetic contrast agent used was gadolinium-diethylentriaminepentaacetate (Gd-DTPA-BMA, Omiscan, Amersham, United Kingdom). The initial dose used was
88 0.2mmol/kg from September 2003 to March 2004. All studies after March 2004 used 0.1mmol/kg. The change in dose was made to allow for reduction in scan time and to minimise any potential side effects associated with use in patients with advanced renal failure.
2.3.3
CMR protocol- image acquisition
2.3.3.i
Patient positioning
Patients were positioned head first and supine in the scanner. Breath hold instructions were relayed via headphones and relaxing music played if desired. A chest coil was employed to optimise image acquisition.
2.3.3.ii
Left ventricular mass and function
An ECG gated breath hold fast imaging with steady-state precession (trueFISP) sequence was used to acquire cine images in long axis planes followed by sequential short axis left ventricular cine loops (8mm slice thickness, 2mm gap between slices) from the atrio-ventricular ring to the apex. In full the protocol is as follows: 1. The initial sequence was a multi-slice breath-hold localiser in end expiration. From these images select the best axial image depicting the left ventricle and septum was selected 2. This image was used to plan a vertical long axis localiser (VLA) along the long axis of the ventricle from the mid-point of the mitral valve to the apex. From the resulting VLA scan the horizontal long axis (HLA) localiser was planned, again using the mid-point of the mitral valve and the apex of the ventricle to orientate
89 3. From this HLA view, three short axis (SA) localiser slices were produced, with the orientation selected as close as possible to parallel to the mitral valve plane. The anatomical landmark of the atrio-ventricular groove was used as a guide 4. The resulting SA images allow the three long axis views to be set. These were the 4-chamber, 2-chamber and left ventricular outflow tract (LVOT) views. Cine studies were acquired in these orientations 5. From the cine 4-chamber study acquired the short axis stack was planned. The first of these cine slices was positioned in an orientation across the mitral valve plane, again using the atrio-ventricular groove as an anatomical land-mark. The slice position would then be incremented and repeated until LV was completely covered Imaging parameters, which were standardized for all subjects, included repetition time (TR)/echo time (TE)/ flip angle (FA)/ voxel size /field of view (FoV) - 3.14 ms/ 1.6 ms/ 600/ 2.2 x 1.3 x 8.0 mm/340 mm.
2.3.3.iii
Aortic distensibilty and compliance
Aortic distensibilty was assessed from cine MR images in the transverse plane of the ascending aorta were obtained at the level of the main pulmonary artery utilising a trueFISP sequence (TR=3.2 ms, TE=1.6 ms, FA=60°, FoV 276x340mm, pixel dimensions 2.3x1.3mm, slice thickness=7 mm). The approximately 10 second breathhold CMR sequence resulted in prospective images with a temporal resolution of at least 22.5ms. During image acquisition, blood pressure was measured using a nonferromagnetic brachial artery sphygmomanometer cuff (Schiller instruments, Baar, Switzerland).
90 2.3.3.iv
Phase encoded (Flow sensitive) CMR imaging of aortic blood flow
To generate flow measurements along the aorta a fast low angle shot (FLASH) gradientecho pulse sequence (TR=41 ms, TE=3.2 ms, FA=30°, matrix size=192x256, Pixel Dimensions 1.5x1.5, slice thickness= 5 mm) was applied perpendicular to the aorta at 2 levels: at the level of the crossing of the pulmonary artery through the ascending (in the same plane as the compliance sequence) and descending aorta and at the level of the diaphragm. This resulted in multiphase image pairs of modulus- and velocity encoded images with a temporal resolution of approximately 20.7 ms.
2.3.3.v
Contrast enhanced CMR images
Further images were acquired 10 minutes after a manual injection of a peripheral bolus of Gd-DTPA-BMA via a intravenous cannula flushed with 10ml of 0.9% saline. A breath-hold segmented turboFLASH inversion-recovery sequence, using identical slice positions as the cines was used. Standardised settings were used for contrast-enhanced imaging including specific parameters of TR/TE/flip angle/voxel size/FoV/number of segments - 11.6 ms/4.3 ms/20°/2.2 x 1.3 x 8.0 mm/ 23. Inversion time for the turboFLASH sequence was optimized on an individual patient basis. Successful nulling of normal myocardium was deemed to have been achieved once the LV myocardium appeared black and homogenous. Generally, an inversion time of between 150 and 280 ms was required.
2.3.3.vi
CMR scan duration
Standard LV mass and function took approximately 20-25 minutes. Measures of vascular function required a further 5 minutes and acquisition of contrast enhanced images added an additional 10 minutes to scan time. Overall, scan time was approximately 30–40 minutes, with a maximum time of 45minutes.
91 2.4
CMR Analysis
2.4.1
Analysis of left ventricular function
LV function was analysed from the left ventricular short axis cine loops. Epicardial and endocardial borders were traced manually and end-systolic and end-diastolic contours with end-systolic and end-diastolic volumes and LV mass were calculated using conventional analysis software (Argus, Siemens, Erlangen). Volumes and LV mass were also indexed to body surface area with body surface area calculated using the Dubois formula: Body Surface Area = 0.20247 x Height(m)0.725 x Weight(kg)0.425 Left ventricular ejection fraction (LVEF) was calculated as:
2.4.2
Definition of left ventricular abnormalities
LVSD was defined as LV ejection fraction (LVEF) 70% stenosis of any epicardial coronary artery). Total atheromatous plaque burden was calculated by adding the percentages of the most severe lesion in each artery (thus the range was 0–400% as four vessels- left main stem, left anterior descending, right coronary and circumflex arteries were studied)(193).
2.7
Echocardiography
2.7.1
Echocardiography – general
In all cases echocardiography was carried out on the same day as CMR, either immediately prior to, or after the CMR scan. Echocardiography was performed using an
103 Acuson 128 machine (Siemens Medical, Bracknell, UK) by a single cardiac technician (Tony Cunningham, Clinical Research Initiative, University of Glasgow) and stored on videotape for off line analysis.
2.7.2
Echocardiography protocol – image acquisition
Patients were placed in the left lateral position and scanned from several different intercostal spaces. Standard trans-thoracic views were recorded from parasternal and apical transducer positions as listed below: Parasternal Approach Long-axis plane Root of aorta—aortic valve, left atrium, left ventricular outflow tract Body of left ventricle—mitral valve Left ventricular apex Right ventricular inflow tract—tricuspid valve Short-axis plane Root of the aorta—aortic valve, pulmonary valve, tricuspid valve, right ventricular outflow tract, left atrium, pulmonary artery, coronary arteries Left ventricle—mitral valve Left ventricle—papillary muscles Left ventricle—apex Apical Approach Four-chamber plane Four chamber Four chamber with aorta Long-axis plane Two chamber—left ventricle, left atrium and with aorta
104 Pulsed wave, continuous wave Doppler, 2-D M-mode, and colour flow mapping were used in each position as appropriate to assess valve flow patterns, diastolic function, anatomy, dimensions and regurgitation respectively. Analysis of LV mass was performed as described in chapter 4. Further characterisation of LVH into concentric and eccentric LVH was dependent on measurements of regional wall thickness (RWT): RWT = [(2 x PWTd) / LVIDd) Concentric hypertrophy was present if the RWT ≥0.45 in the presence of LVH with eccentric hypertrophy present if RWT was


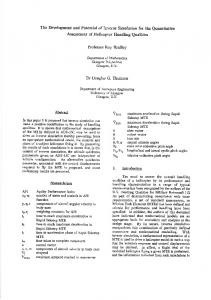


![[PDF]. - University of Glasgow](https://m.moam.info/img/260x300/pdf-university-of-glasgow_647a49be097c476e028cdaa7.jpg)