University of Pennsylvania
ScholarlyCommons Publicly Accessible Penn Dissertations
1-1-2013
A Bayesian Approach for Predicting Building Cooling and Heating Consumption and Applications in Fault Detection Bin Yan University of Pennsylvania,
[email protected]
Follow this and additional works at: http://repository.upenn.edu/edissertations Part of the Architectural Engineering Commons Recommended Citation Yan, Bin, "A Bayesian Approach for Predicting Building Cooling and Heating Consumption and Applications in Fault Detection" (2013). Publicly Accessible Penn Dissertations. 821. http://repository.upenn.edu/edissertations/821
This paper is posted at ScholarlyCommons. http://repository.upenn.edu/edissertations/821 For more information, please contact
[email protected].
A Bayesian Approach for Predicting Building Cooling and Heating Consumption and Applications in Fault Detection Abstract
Making a prediction typically involves dealing with uncertainties. The application of uncertainty analysis to buildings and HVAC (heating, ventilation and air conditioning) systems, however, remains limited. Most existing studies concentrate on the parameter uncertainty and parametric variability in building simulations for the design stage, and rely on Monte Carlo experiments to quantify this uncertainty. This dissertation aims to develop a rapid and direct method that is capable of quantifying uncertainty when predicting building cooling and heating consumption in the operation stage, while simultaneously capturing all sources of uncertainty and applying these to actual system operations. Gaussian Process regression, a Bayesian modeling method, is proposed for this purpose. The primary advantage of Gaussian Process regression is that it directly outputs a probability distribution that explicitly expresses prediction uncertainty. The predictive distribution covers uncertainty sources arising not only from parameter uncertainty and parametric variability, but also from modeling inadequacy and residual variability. By assuming a Gaussian input distribution and using Gaussian kernels, Gaussian Process regression takes parameter uncertainty and parametric variability into consideration without using the Monte Carlo method. This dissertation makes three main contributions. First, based on the observations from commissioning projects for approximately twenty campus buildings, some of the important uncertainties and typical problems in variable air volume system (VAV) operations are identified. Second, Gaussian Process regression is used to predict building cooling and heating consumption and to evaluate the impact of parametric variability of system control related variables. Third, a method for automated fault detection that uses Gaussian Process regression to model baselines is developed. By using the uncertainty outputs from the Gaussian Process regression together with Bayes classifiers and probabilistic graphical models, the proposed method can detect whether system performance is normal or faulty at the system component level or the whole building level with a high degree of accuracy. Degree Type
Dissertation Degree Name
Doctor of Philosophy (PhD) Graduate Group
Architecture First Advisor
Ali M. Malkawi Subject Categories
Architectural Engineering
This dissertation is available at ScholarlyCommons: http://repository.upenn.edu/edissertations/821
A BAYESIAN APPROACH FOR PREDICTING BUILDING COOLING AND HEATING CONSUMPTION AND APPLICATIONS IN FAULT DETECTION Bin Yan A DISSERTATION in Architecture Presented to the Faculties of the University of Pennsylvania in Partial Fulfillment of the Requirements for the Degree of Doctor of Philosophy 2013
Supervisor of Dissertation _______________________ Ali M. Malkawi Professor of Architecture
Graduate Group Chairperson _______________________ David Leatherbarrow Professor of Architecture
Dissertation Committee Yun Kyu Yi, Assistant Professor of Architecture Ben Taskar, Boeing Professor of Computer Science & Engineering, University of Washington
Acknowledgement
First of all, I want to express my gratitude toward my advisor, Prof. Ali Malkawi, who gave me the opportunity to study at UPenn and guided me throughout more than five years of my PhD studies. I sincerely appreciate his time and effort during my PhD training. I look forward to working with him again in the future. Many thanks go to my committee member Prof. Yun Kyu Yi. Prof. Yi not only gave me a great deal of valuable advice pertaining to my research, but also helped me in many other aspects of PhD life. Special thanks to Prof. Ben Taskar, who was also on my committee. Prof. Taskar generously spent time teaching me many useful technical skills that I used in my dissertation research. I also want to thank all my colleagues from Tsinghua University and my colleagues at UPenn, who participated in the system optimization project. Without them, it would have been impossible for me to collect the data for this project. Thanks also go to my parents for their unconditional support. I am also grateful to Vilhelm Sjöberg, who gave me very helpful suggestions pertaining to dissertation writing and defense presentation and was a continuous source of encouragement. ii
During my studies at UPenn, I received funding from the Department of Architecture and the T.C. Chan Center. Finally, I wish to thank the professors and staff in the department for their continuous support during my study. I had a wonderful experience there.
iii
ABSTRACT
A BAYESIAN APPROACH FOR PREDICTING BUILDING COOLING AND HEATING CONSUMPTION AND APPLICATIONS IN FAULT DETECTION
Bin Yan Ali M. Malkawi
Making a prediction typically involves dealing with uncertainties. The application of uncertainty analysis to buildings and HVAC (heating, ventilation and air conditioning) systems, however, remains limited. Most existing studies concentrate on the parameter uncertainty and parametric variability in building simulations for the design stage, and rely on Monte Carlo experiments to quantify this uncertainty. This dissertation aims to develop a rapid and direct method that is capable of quantifying uncertainty when predicting building cooling and heating consumption in the operation stage, while simultaneously capturing all sources of uncertainty and applying these to actual system operations. Gaussian Process regression, a Bayesian modeling method, is proposed for this purpose. The primary advantage of Gaussian Process regression is that it directly
iv
outputs a probability distribution that explicitly expresses prediction uncertainty. The predictive distribution covers uncertainty sources arising not only from parameter uncertainty and parametric variability, but also from modeling inadequacy and residual variability. By assuming a Gaussian input distribution and using Gaussian kernels, Gaussian Process regression takes parameter uncertainty and parametric variability into consideration without using the Monte Carlo method. This thesis makes three main contributions. First, based on the observations from commissioning projects for approximately twenty campus buildings, some of the important uncertainties and typical problems in variable air volume system (VAV) operations are identified. Second, Gaussian Process regression is used to predict building cooling and heating consumption and to evaluate the impact of parametric variability of variables related to system control. Third, a method for automated fault detection that uses Gaussian Process regression to model baselines is developed. By using the uncertainty outputs from the Gaussian Process regression together with Bayes classifiers and probabilistic graphical models, the proposed method can detect whether system performance is normal or faulty at the system component level or the whole building level with a high degree of accuracy.
v
Table of Contents
Acknowledgement .......................................................................................................................... ii ABSTRACT ................................................................................................................................... iv List of Tables ............................................................................................................................... viii List of Figures................................................................................................................................ ix Chapter 1 Introduction.................................................................................................................. 1 Chapter 2 Background .................................................................................................................. 7 2.1 Building Energy Consumption and HVAC System Type ................................................... 7 2.2 Building Commissioning and Fault Detection .................................................................. 11 2.3 Modeling Methods and Simulation Programs ................................................................... 17 2.4 Existing Research on Uncertainty Analysis ...................................................................... 19 2.4.1 Uncertainty Sources ................................................................................................... 19 2.4.2 Analysis Methods........................................................................................................ 21 2.4.3 Applications in Buildings and HVAC Systems ........................................................... 24 Chapter 3 Uncertainty in System Operations ........................................................................... 27
vi
3.1 VAV System Operations ................................................................................................... 27 3.2 Typical Faults in VAV Systems ........................................................................................ 29 3.2.1 Inefficient Use of Economizers and Cooling and Heating Counteraction in AHUs .. 30 3.2.2 Excessive Reheating in VAVs ..................................................................................... 32 3.3 Uncertain Variables Related to System Controls .............................................................. 38 Chapter 4 Gaussian Process Regression .................................................................................... 46 4.1 Predicting with Gaussian Processes .................................................................................. 47 4.2 Basic Ideas of Gaussian Processes .................................................................................... 49 4.3 Dealing with Uncertain Inputs ........................................................................................... 54 4.4 Possible Extensions ........................................................................................................... 56 Chapter 5 Predicting Cooling and Heating Consumption ....................................................... 59 5.1 Predicting Energy Use or Demand .................................................................................... 59 5.2 Evaluating the Impact of Uncertain Inputs ........................................................................ 64 Chapter 6 Applications in Fault Detection ................................................................................ 70 6.1 Bayesian FDD Method ...................................................................................................... 70 6.2 Multi-level Fault Detection ............................................................................................... 85 Chapter 7 Conclusion .................................................................................................................. 96 Bibliography ............................................................................................................................... 100 Index ............................................................................................................................................ 107
vii
List of Tables
Table 6-1 Internal load density settings in the energy model ........................................... 77 Table 6-2 Percentage of class assignments ....................................................................... 83 Table 6-3 Percentage of class assignments for 𝐹VAV ........................................................ 92 Table 6-4 Percentage of class assignments for 𝐹AHU ........................................................ 92
viii
List of Figures
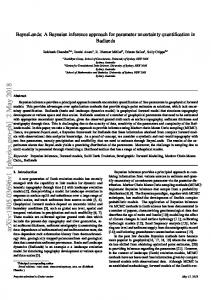
Figure 1-1 Process of research development ...................................................................... 5 Figure 2-1 Actual and projected U.S. primary energy use by end-use sector .................... 9 Figure 2-2 U.S. Commercial energy end-use splits in 2010 ............................................. 10 Figure 2-3 Percentage of various thermal distribution system types by conditioned floor area in U.S. commercial buildings .................................................................................... 11 Figure 2-4 Model-based FDD Method ............................................................................. 16 Figure 2-5 Process of uncertainty analysis using Monte Carlo Experiments ................... 22 Figure 3-1 Components of system optimization project ................................................... 29 Figure 3-2 Cooling energy consumption of an educational building ............................... 31 Figure 3-3 Simulated and metered cooling consumption ................................................. 32 Figure 3-4 Sensor readings versus on-site measurements of air flow rate ....................... 33 Figure 3-5 Mean values and standard deviation of normalized air flow rate by outside air dry-bulb temperature......................................................................................................... 35
ix
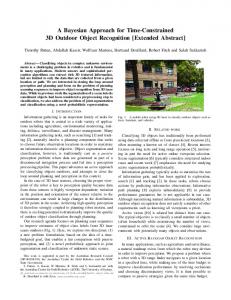
Figure 3-6 Mean values and standard deviation of normalized air flow rate by hour when outside air temperature is between 8°C and 12°C ............................................................ 36 Figure 3-7 Mean values and standard deviation of normalized air flow rate by hour when outside air temperature is between 12°C and 16°C .......................................................... 37 Figure 3-8 Excessive reheating of an educational building .............................................. 38 Figure 3-9 Histogram of AHU supply air temperature 11/1/2008-3/9/2009 .................... 40 Figure 3-10 Histogram of AHU supply air temperature 2/8/2008 – 4/30/2008 ............... 40 Figure 3-11 Histogram of AHU supply air temperature 4/8/2008 – 4/30/2008 ............... 41 Figure 3-12 Histogram of AHU supply air temperature 4/8/2008 – 4/30/2008 ............... 42 Figure 3-13 Histogram of AHU supply air temperature 3/19/2009 – 4/7/2009 ............... 42 Figure 3-14 Temperature log of outside air, mixed air, supply air and return air in the same AHU as shown in Figure 3-13. ................................................................................ 43 Figure 3-15 Histogram of AHU supply air temperature 7/16/2008 – 7/30/2008 ............. 43 Figure 3-16 Temperature log of outside air, air after preheat, supply air and return air in the same AHU as shown in Figure 3-15. .......................................................................... 44 Figure 4-1 Diagram of making predictions with uncertainty through Gaussian Process regression .......................................................................................................................... 49 Figure 5-1 24-hour prediction of chilled water and steam use ......................................... 61 Figure 5-2 Structure of Neural Network used in the study ............................................... 62 Figure 5-3 Comparison of 𝑹𝟐 values of Gaussian Processes to Neural Networks ........... 63 Figure 5-4 Histogram of measured AHU supply air temperature..................................... 66
x
Figure 5-5 Predictive distributions of hourly chilled water use which include the uncertainty introduced by the variance in AHU supply air temperatures ......................... 67 Figure 6-2 Proposed Bayesian FDD method .................................................................... 73 Figure 6-3 Posterior distributions of three classes when their priors are equal ................ 75 Figure 6-4 Floor plan of the simulated building ............................................................... 77 Figure 6-5 One-week sample of the plug-in load schedule used in the energy model ..... 78 Figure 6-6 Metered cooling and heating consumption of a building with similar system type as the simulated building........................................................................................... 80 Figure 6-7 Simulated cooling and heating by EnergyPlus................................................ 81 Figure 6-8 Process of detecting excessive cooling or heating consumption using Gaussian Process .............................................................................................................................. 83 Figure 6-9 Percentage of alarm occurrence versus outside air temperature ..................... 84 Figure 6-10 Percentage of alarm occurrence versus the hour of day ................................ 85 Figure 6-11 Graphical model representation of possible faults that result in excessive heating ............................................................................................................................... 86 Figure 6-12 Procedures of multi-level fault detection ...................................................... 90 Figure 6-13 Distribution of supply air temperature in the energy model ......................... 91 Figure 6-14 Histogram of normalized air flow rate in training and testing datasets ........ 93 Figure 6-15 Histogram of the amount of cooling and heating counteraction in AHUs in scenario two ...................................................................................................................... 94 Figure 6-16 Uncertainty magnitude and percentage of faulty class assignment versus normalized air flow rate in scenario two........................................................................... 95 xi
Figure 7-1 Possible extension of the proposed fault detection method ............................ 99
xii
Chapter 1 Introduction
Making a prediction typically involves dealing with uncertainties. Uncertainty and sensitivity analysis have been applied extensively in science and engineering. Their application to buildings and HVAC (heating, ventilation and air conditioning) systems, however, remains limited. When predicting building energy consumption for existing buildings, the output is usually determined by point estimation alone.
Although many studies have applied uncertainty analysis to the design stage of buildings and systems, the operation stage often remains overlooked. While the uncertainty in building energy consumption predictions during the operation stage shares many common elements with predictions during the design stage, an additional source of uncertainty for the operation stage must be considered. This additional source of
1
uncertainty arises from the fact that actual system operations differ from their operation under ideal conditions. Such discrepancies and their impact have not been fully recognized or addressed in existing studies. Apart from considering the discrepancy between actual and idealized system operations, a modeling method that can quantify prediction uncertainty in a direct and rapid manner will significantly improve current uncertainty analysis. Therefore, the main purpose of this research is to develop a method that is capable of quantifying uncertainty when predicting building cooling and heating consumption in the operation stage directly and rapidly, while capturing all sources of uncertainty and applying these to actual system operations.
In this dissertation, Gaussian Process regression, a Bayesian modeling method, is proposed as a means of predicting building energy consumption in the operation stage. Instead of relying on the Monte Carlo method and point estimation, Gaussian Process regression directly outputs a probability distribution, a form that explicitly expresses prediction uncertainty. The primary advantage of Gaussian Process regression is its ability to quantify uncertainty. In terms of prediction accuracy, Gaussian Process regression is as good as, if not better than, other conventional modeling methods (Rasmussen, 1996).
Compared with current uncertainty analysis methods, Gaussian Process regression has several additional advantages. First, Gaussian Process regression can make predictions based on historical data without requiring the construction of a complex physics-based 2
model. This statistical approach relies on data alone. Therefore, unlike a physics-based model, it does not require the configuration of numerous physical parameters. In system operations, given recent advances in building automation systems, comprehensive historical data of system performance are readily available. Second, the predictive distribution of Gaussian Process regression captures various uncertainties that arise from the modeling process. In this dissertation, uncertainty in the modeling process includes model inadequacy, residual variability, observation error and interpolation uncertainty (details relating to uncertainty in the modeling process will be introduced in Chapter 2). Uncertainty in the modeling process is seldom quantified. Methods used in most studies restrict themselves to parameter uncertainty and parametric variability, whereas Gaussian Process regression can account for uncertainty in the modeling process. Third, Gaussian Process regression provides a more efficient means of quantifying parameter uncertainty or parametric variability. By assuming a Gaussian input distribution and using Gaussian kernels, Gaussian Process regression takes into account parameter uncertainty and parametric variability without using the Monte Carlo method, which is generally considered to be the standard in existing uncertainty analyses. The use of Gaussian Process regression rather than the Monte Carlo method therefore saves time and requires fewer data samples.
This dissertation makes three main contributions. First, it addresses important uncertainties and typical problems in variable air volume system operations that have been identified in building commissioning projects. Second, Gaussian Process regression 3
is used to predict building cooling and heating consumption because it is a model that takes various sources of uncertainty into account. Third, a method for automated fault detection, in which Gaussian Process regression is used to model baselines, is developed.
Figure 1-1 describes the process of research development. Gaussian Process regression is used to predict building energy consumption. The output of Gaussian Process regression is a predictive distribution, which can be used to evaluate the impact of variables related to system controls and to predict baselines in fault detection. Actual measurements of related variables on system control from building commissioning projects are used to evaluate their impact on energy consumption. Typical faults identified from building commissioning projects are used to verify the proposed fault detection method in conjunction with machine learning techniques, including Bayes classifiers and probabilistic graphical models.
4
Actual Measurements from the project Gaussian Process Regression
Building Commissioning
Evaluate impact of system control related variables Typical faults identified from project
Predictions w. uncertainty Predict baseline in fault detection
Fault Detection Bayes Classifier & Probabilistic Graphical Model
Figure 1-1 Process of research development
In this dissertation, Chapter 2 provides the background for this research by discussing the existing research of uncertainty analysis and its applications in buildings and systems, the scope of this work, its main applications, and simulation tools used in the case studies.. Chapter 3 identifies the uncertainties in HVAC system operations based on observed data. The observed data includes historical data from building automation systems, onsite measurements from commissioning projects, and sub-metered cooling and heating consumption of individual buildings. The source of uncertainty described in Chapter 3 concerns the deviation of actual system performance from its operation under ideal conditions. In addition to identifying the discrepancies between simulations and real systems, this approach explains why it is necessary to consider uncertainty in energy consumption predictions. Chapter 4 introduces the theoretical aspects of Gaussian Process regression and discusses possible extensions of the proposed model. In Chapter 5
5, the basic form of Gaussian Process regression is used to predict building cooling and heating consumption. A case study of predicting energy use with uncertain AHU supply air temperature is presented to show how Gaussian Process regression can accelerate uncertainty analysis for parametric variability. Chapter 6 explores the applications of the proposed Bayesian approach in fault detection. Apart from Gaussian Process regression, the proposed Bayesian approach also uses two other machine learning techniques: Bayes classifiers and probabilistic graphical models. Chapter 7 includes a brief discussion of the advantages and limitations of the proposed method and suggests topics for future research.
6
Chapter 2 Background
This chapter presents a detailed discussion of the background for this dissertation. The scope of this dissertation and its significance in terms of energy consumption are discussed. Then, the purpose and potential applications for this type of research are explained. Next, the choice of modeling methods and simulation tools used in this dissertation are discussed. The chapter concludes with a discussion of the limitations of the existing researches in this field.
2.1 Building Energy Consumption and HVAC System Type This research concentrates on a specific type of thermal distribution system, the variable air volume (VAV) system. VAV systems are widely used in large-scale commercial 7
buildings, especially in the United States. The following statistics show the percentage of commercial building energy use as a measure of total U.S. primary energy use, the percentage of HVAC energy use as a measure of total energy use of commercial buildings, and the breakdown of thermal distribution system types in commercial buildings. These statistics demonstrate the importance of this research field from the perspective of energy consumption.
Figure 2-1 shows the actual and projected U.S. primary energy use by end-use sector from 2011 to 2040. Buildings (commercial and residential) consume more than 40% of the total primary energy in the United States. Commercial buildings account for 19% of total primary energy use. The energy use of commercial buildings is predicted to increase by 3.1 quadrillion Btu from 2011 to 2040. In 2040, commercial buildings will account for 20% of total energy use (EIA, 2012).
8
U.S. primary energy use, (quadrillion Btu) 120
Actual
Projected
100
Industrial
80
31%
34%
60
19%
20%
40
22%
21%
Residential
28%
25%
Transportation
20 0
2011
2015
2020
2025
2030
2035
Commercial
2040
Figure 2-1 Actual and projected U.S. primary energy use by end-use sector 1
HVAC energy consumption, including space heating, space cooling and ventilation, accounts for 43% of the energy use in commercial buildings (EIA, 2012), as shown in Figure 2-2. In some large office buildings, this portion can exceed 50%.
1
Source: EIA, Annual Energy Outlook 2012 Early Release, Jan. 2012, Summary Reference Case Tables, Table A2, p. 3-5
9
Lighting 14% Cooking 2% Computers 2% Electronics 3%
Other & Adjust 25% Space Heating 27%
Water Heating 7% Refrigeration 4%
Space Cooling Ventilation 10% 6%
Figure 2-2 U.S. Commercial energy end-use splits 2
Figure 2-3 shows the percentage of conditioned (both heated and cooled) floor area by different system type in U.S. commercial buildings, including education, health care, office and public buildings (Westphalen & Koszalinski, 1999). Packaged air-conditioning systems and individual air-conditioners are usually used for small-scale commercial buildings. Central thermal distribution systems predominate in large-scale commercial buildings. There are three types of central thermal distribution systems. These include variable air volume (VAV) systems, constant air volume (CAV) systems, and fan coil unit (FCU) systems. FCU and VAV/CAV are distinguished by the media they employ to transport cooling and heating. FCU uses water while VAV/CAV uses air. The all-air system is the predominant system type found in large commercial buildings in the United
2
“Other” includes service station equipment, ATMs, telecommunications equipment, medical equipment, pumps, emergency electric generators, combined heat and power in commercial buildings, and manufacturing performed in commercial buildings.
10
States. Air handling units (AHU) process air centrally and distribute processed air to terminal VAV and/or CAV boxes. VAV boxes are more common because they are more energy efficient by varying air volume. Radiators are sometimes installed in perimeter zones along with VAV/CAV boxes. Although this dissertation focuses on central VAV systems, some of it is also applicable to CAV systems.
Central CAV 14% Central FCU 6%
Individual AC 12%
Central VAV 19%
Packaged 49%
Figure 2-3 Percentage of various thermal distribution system types by conditioned floor area in U.S. commercial buildings
2.2 Building Commissioning and Fault Detection That faults and deficiencies in control systems are among the most important barriers to energy-efficient buildings (PECI, 2003). Sophisticated technologies such as direct digital control have been introduced into HVAC systems as a promising means of achieving energy saving measures in buildings. However, they also increase the complexity of the systems and lead to a higher probability of deviation between system performance and
11
design intent. As a result, few systems perform as intended. Actual system performance in real buildings may differ from desired performance because of flaws in operations and maintenance. The most frequently occurring problems in HVAC systems include faulty economizer operation, malfunctioning sensors, malfunctioning valves, dampers, or other actuators, faulty or improper ventilation control strategies, and improper set-point settings (PECI, 2003).
A growing awareness of the inefficiencies in HVAC systems has expanded the use of commissioning in new and existing buildings. Commissioning can be defined as the process of ensuring that systems are designed, installed, functionally tested, and capable of being operated and maintained according to the owner’s operational needs (DOE, 1998). A study by Xiao and Wang (2009) summarizes the history of building commissioning. The development of commissioning can be traced back to the 1950s, when building commissioning was introduced in Europe. In the 1970s, the growth of environmental consciousness, and more importantly, the energy crisis, led to manual testing, and the adjusting and balancing of systems after installation and before operation in the United States. About two decades ago, the American Society of Heating, Refrigerating, and Air-Conditioning (ASHRAE) and other institutions in the United States began to provide codes and guidelines for commissioning. Since the beginning of the 21st century, building commissioning has been widely used as an energy conservation method all over the world.
12
The role of commissioning in assuring efficient and effective system performance is significant from the perspective of energy conservation. The potential savings resulting from building commissioning and system control optimization in commercial buildings were estimated to be 5-30% of their total energy use (Hunt & Sullivan, 2002). The payback time of commissioning in existing buildings can vary from one month to five years (Mills et al., 2005). Building commissioning usually involves conducting on-site measurements, analyzing the performance data from the monitoring system, observing the actual performance and comparing that with what it is expected to be (Claridge, 1998). Its main purpose is to detect inefficiencies and optimize the system. System measurements and sub-metered data are therefore crucial to building energy diagnosis. Faults in system operations may reoccur after commissioning. In order to achieve energy savings and maintain high-level energy efficiency, lifecycle building commissioning may be necessary. Currently, commissioning requires intensive labor, time and cost, which makes it impractical to conduct commissioning throughout the building lifecycle, especially given the increasing scale and complexity of modern buildings.
Commissioning methods that can reduce labor, time and cost are highly desirable. Automated commissioning is considered to be a necessary and feasible solution. Building automation systems (BAS) are now standard in most modern buildings and can control and monitor system performance. This makes it possible to automate the commissioning process throughout the building lifecycle. Consequently, there has been a recent growth of interest in research and development (R&D) to automate building commissioning. 13
However, the commissioning of HVAC systems is still far from being completely automated. It is believed that wireless communication, automated diagnostics, and advanced control would lead to completely automated commissioning in 10 to 20 years (Brambley & Katipamula, 2004). Automating building commissioning throughout a building lifecycle requires research on many levels. No single tool can accomplish all the tasks that would be required, including information management, functional testing, and performance monitoring, and fault detection and diagnostics (Xiao & Wang, 2009).
Information management includes tracking and recording all the information necessary for commissioning in addition to any changes to HVAC systems in the building lifecycle. Automatic information management is to a large extent crucial for commissioning to be effective and efficient (Xiao & Wang, 2009). Building lifecycle information systems and data models have been developed in order to maintain the accuracy, conformity and consistency of the information necessary for commissioning (Stum, 2000; Luskay, 2003; Forester, 2003). However, additional efforts are necessary in order to integrate these data management tools with emerging automated fault detection and diagnostic tools (PECI, 2003).
Functional performance testing is achieved by creating false operating conditions and manipulating set-points. By observing test responses and comparing these with design intent, engineers can detect deficiencies in system operations (Xiao & Wang, 2009). Functional testing, when employed as an active commissioning method, is a relatively 14
new commissioning method. Functional testing can also be used to generate data to build models required for automated fault detection tools.
Performance monitoring plays an important role in automated commissioning in the building lifecycle. Trend analysis from data acquired from performance monitoring systems, a simple technique used in conventional commissioning, can also be useful in automated commissioning. In addition, continuous building performance measurements, supporting information processing, and data visualization technologies have been developed over the past two decades (Piette et al., 2001).
Fault detection and diagnostics (FDD) aims to discover faults and sub-optimal system operations. Research on fault detection and diagnosis began after the benefits of lifecycle commissioning became widely recognized (Xiao & Wang, 2009). The two most commonly used FDD models are the rule-based method and the model-based method. The rule-based method uses expert knowledge or first principles to derive a set of if-thenelse rules to draw conclusions about whether faults exist in the systems (Katipamula & Brambley, 2005). Kaldorf and Gruber (2002) describe an expert system for the FDD of building systems. House et al. (2001) and Brunton et al. (2012) use the rule-based method to detect faults in AHUs. Significant drawbacks of the rule-based method include that it is difficult to determine a complete set of rules, and difficult to ensure that all rules are always applicable, especially in complex systems (Katipamula& Brambley, 2005). For complex systems, more complicated model-based methods are often used in fault 15
detection, as shown in Figure 2-4 (Liddament, 1999). Outputs of real processes and predictions from baseline models are compared. Any deviations greater than a threshold tend to indicate abnormalities in system performance. O’Neill et al. (2011) develop a whole building energy diagnostics system using EnergyPlus simulations as baseline models. Wang et al. (2011) present a model-based online fault detection method for the AHUs of office buildings. Yang et al. (2011) use a model-based fault detection method to detect faults in the supply air temperature sensors of AHUs.
Figure 2-4 Model-based FDD Method
Current research in this field continues to explore the development of more robust automated FFD tools that can be integrated into BAS systems. Many sub-tasks must be accomplished before fully automated commissioning becomes a reality (Diamond, 2004). One of the primary sub-tasks involves improving baseline predictions. Capturing uncertainty in baseline predictions would help enhance the robustness of the model-based FDD method. Accordingly, the proposed Bayesian approach provides a solution for improving baseline predictions. The ultimate goal of the research presented in this dissertation is to improve the performance of automated fault detection by incorporating prediction uncertainty. 16
2.3 Modeling Methods and Simulation Programs Various building energy use modeling methods have been applied to existing buildings in order to understand building energy performance and improve energy efficiency. For example, simplified models based on heat balance equations and detailed simulations, such as EnergyPlus, DeST and DOE-2, can optimize operating strategies (Liu & Claridge, 1998; Yan et al., 2009). Temperature-based regression and Neural Networks have been widely used to determine retrofit savings (Kissock et al., 1998; Cohen & Krarti, 1995). These models can be categorized into two groups: physics-based and datadriven. In physics-based models, the functional form of relations between variables and the values of parameters are known. They can be derived through our knowledge of the physical principles of the system or through experiments. Physics-based models can be considered white box models. Once a model has been developed, historical data is not required in order to make new predictions. In practice, metered data is used to calibrate the input values of a model. In data-driven models, both the functional form of relations between variables and the values of parameters in those functions are learned through optimization algorithms based on historical data. Neural Networks and temperature-based regression models are data-driven models. Such models can be considered black box models.
Even experienced engineers might take days to build a credible building energy model by using simulation tools such as EnergyPlus. Such models require many inputs, including 17
the dimensions of buildings, their density and schedule of occupants, lighting and equipment, and HVAC system parameters. Although a model can be calibrated until its outputs closely match the measured data, this does not mean that the simulation model and its predictions are an accurate or complete reflection of the actual system operations. Due to the lack of information for the inputs in most cases, many inputs are impossible to measure accurately, and their configuration therefore remains merely an estimate (Haves et al., 2001). Moreover, simulation models assume that systems are operating under ideal conditions. Most existing models do not incorporate imperfect and faulty mechanical operations into their calculations.
When historical data is available and sufficient, it is easier and more accurate to make predictions through data-driven models. The time, effort and experience required to develop a data-driven model result in a more affordable engineering project. Historical data based models can make accurate predictions and can be applied to detect changes in energy consumption patterns. They can also verify energy savings of retrofit projects. Their primary limitation is that a data-driven model is only applicable to the specific building or system from which the data came. The model cannot be generalized to other buildings without additional training data (Yan et al., 2011). The proposed Bayesian approach in this dissertation employs data-driven models. Since the proposed approach aims to be applied to the operation stage, data can be acquired from building automation systems, making it feasible to build credible models based on historical data.
18
Due to a lack of measured data with the desired features for the development and validation of the proposed fault detection method, synthetic data is used in this dissertation. Building energy performance simulation programs can be used to generate synthetic data. Computer experiments have been designed to mimic actual system operations. The two most comprehensive tools to simulate building energy consumption are EnergyPlus and TRNSYS (TRaNsient SYstem Simulation Program), because they have the largest number of modules for pre-configured systems and discrete HVAC components and features of typical HVAC systems and user-configurable HVAC systems (Crawley et al., 2008). In this dissertation, EnergyPlus is used to generate synthetic data to verify the proposed method. EnergyPlus is a well-recognized simulation program that provides a strong integration of building modeling and system simulation.
2.4 Existing Research on Uncertainty Analysis
2.4.1 Uncertainty Sources Uncertainty can enter mathematical models in various contexts. There are many ways to classify sources of uncertainty. Kennedy and O’Hagan (2001) proposed a framework for Bayesian calibration of computer models, in which they categorize uncertainty sources into the following groups: •
Parameter uncertainty: which results from inputs of mathematical models whose exact values are unknown. 19
•
Model inadequacy: which is defined as the difference between the true mean value of the real world process and the model output at the true values of the inputs. “Mean value” is used in the definition because the real process may itself exhibit random variability. “True values of inputs” refers to the assumption that there is no parameter uncertainty. Intuitively, model inadequacy is caused by the fact that models are only approximations of reality and because there will always be some discrepancy when they are compared to the underlying true physical process.
•
Residual variability: which concerns variations in the process. The real process may not always take the same values even if certain conditions remain the same, whereas a model will always produce the same outputs when given the same inputs. There are two explanations for this discrepancy. First, the real process itself may be inherently stochastic. Second, unrecognized conditions exist in the current model. If additional conditions can be specified within the model, it might be possible to reduce or eliminate this type of variation.
•
Parametric variability: which results from the variability of model inputs when some of the conditions in the inputs are not controlled or specified. In some cases, it is advantageous to leave some of the inputs unspecified to permit them to vary according to a joint distribution, so that the additional uncertainty introduced by parametric variability can be analyzed.
•
Observation error: which results from measurement error and may also contribute to residual errors.
20
For data-driven models, interpolation uncertainty is a major source of uncertainty. Interpolation uncertainty is caused by a lack in data samples. Interpolation or extrapolation is used to make predictions for those input settings that do not have simulation data or experimental measurements. Interpolation uncertainty could be considered one form of model inadequacy. Since Gaussian Process regression is a datadriven modeling method, interpolation uncertainty is an important source of uncertainty in Gaussian Process modeling.
There will be no attempt to redefine the principle of uncertainty classification in this dissertation research because Kennedy and O’Hagan’s (2001) definition is widely recognized and cited in the field. In this dissertation, the term “uncertainty in the modeling process” is used to include model inadequacy, residual variability, observation error, and interpolation uncertainty.
2.4.2 Analysis Methods Most existing studies on uncertainty concentrate on parameter uncertainty and parametric variability. The purpose of these studies is to determine how uncertainties in the output of a mathematical model can be apportioned to different contributions of uncertainties in the
21
model inputs. Such uncertainty studies usually include three steps, as illustrated in Figure 2-5.
y
Sensitivity Analysis
Figure 2-5 Process of uncertainty analysis using Monte Carlo Experiments
The first step is the assessment of uncertainty in input parameters or variables. Each input parameter or variable must be assigned a plausible range and distribution. If the analysis is primarily of an exploratory nature, then rather crude distribution assumptions may be adequate. However, if precise uncertainty results are desired, then distributions of input features must be specified with care, and dependencies or correlations among input variables must be considered.
The second step is the propagation of uncertainty. A sample must be generated from the ranges and distributions specified for inputs. Monte Carlo simulations are a widely used
22
propagation technique for uncertainty analysis (Hamby, 1995; Helton, 1993; Kleijnen, 1997; Lomas & Eppel, 1992; Morris, 2006; Saltelli, 1990). Popular sampling techniques include random sampling, importance sampling, and Latin hypercube sampling. Multiple model evaluations are performed with probabilistically selected model inputs. The output distribution of these evaluations is used as the basis for further uncertainty analysis.
The third step is sensitivity analysis. The purpose of sensitivity analysis is to determine the importance of parameters and variables in terms of their relative contribution to the output uncertainty. Regression-based techniques are typically used to explore the mapping from input to output. It helps pinpoint the parameters that deserve primary focus in modeling.
The procedures described above are conceptually simple, widely used, and easy to explain. This approach has several advantages. First, the full range of each input variable is sampled and subsequently used as model inputs. Therefore, the full stratification over the range of each input variable facilitates the identification of nonlinearities, thresholds and discontinuities. Next, uncertainty results are obtained without the use of a surrogate model. Moreover, extensive modifications to the original model are not necessary and a variety of regression-based techniques are applicable for further sensitivity analysis. However, there is also a serious drawback to using this approach. If the model is computationally expensive to evaluate and if many model evaluations are required, the cost of the required calculations may be prohibitive. In most cases, these procedures are 23
only applicable to computer models and not to real processes because the propagation of uncertainty is difficult to realize in real processes. It is often too expensive to repeat experiments and sometimes even impossible to collect data for certain input settings.
The Bayesian approach proposed in this dissertation uses Gaussian Process regression to build a surrogate model based on either simulated data or measured data. As such, it can be applied to both computer models and real processes. Furthermore, for parametric variability in uncertainty analysis, the time cost can be reduced in the uncertainty propagation step because significantly fewer model evaluations or experiments are required. Moreover, Gaussian Process regression can account for additional types of uncertainty in the modeling process aside from parametric variability.
2.4.3 Applications in Buildings and HVAC Systems Uncertainty analysis provides additional information for decision-making. Knowledge gained from an uncertainty analysis may completely change the decisions being made. A study by de Wit (2004) employs Bayesian decision theory to determine whether a mechanical cooling system should be installed in a four-story office building in the Netherlands. Two conflicting objectives were at stake in this decision-making process: first, the builders wanted to maximize the future occupants’ satisfaction with the thermal aspects of the indoor climate, and second, they wanted to minimize investment cost. In
24
the absence of uncertainty, two different decision-makers with different preferences will make the same decision. However, when uncertainty is present, the same two decisionmakers are presented with different choices, which demonstrates the importance of uncertainty analysis in decision-making.
Uncertainty analysis can affect system sizing. System sizing determines the initial cost of the system and also affects the operating performance through the partial load behavior of system components. System sizing depends on peak load calculations. In most cases, decisions are made based on point estimations of a worst-case scenario, which often results in grossly oversized systems. A 2010 study by Domínguez-Muñoz et al. uses uncertain inputs of envelopes, internal load and infiltration to calculate a distribution of peak cooling loads. The resulting probability distribution covers the whole range of possible peak loads. The capacity of the HVAC equipment is determined based on this probability distribution instead of on the results from point estimation. This study demonstrates how it is possible for decision-makers to find a solution that strikes a balance between thermal comfort levels on one hand and the initial and operation costs on the other.
A recent paper published by Heo et al. (2012) takes uncertainty into account when evaluating energy savings of energy conservation measure (ECM) candidates. This research inputs uncertain factors into a simplified energy model and uses Monte Carlo experiments to evaluate retrofit energy savings. 25
Existing studies on this topic have three main limitations. First, the uncertainty in the modeling process is rarely quantified in the predictions. The uncertainty sources included in the predictive distributions are limited to parameter uncertainty and parametric variability. For the analysis of parameter uncertainty and parametric variability, only envelope related parameters are investigated. Second, Monte Carlo experiments are used in most uncertainty studies, which is potentially computationally expensive. Third, the existing research tends to analyze simulation results instead of system measurements. Therefore, this dissertation aims to develop a method capable of quantifying uncertainty when predicting building energy consumption in a direct and rapid manner. The proposed method is simultaneously able to capture parameter uncertainty and parametric variability as well as model inadequacy, residual variability, and observation error. The uncertain variables investigated in this dissertation are mainly related to system controls in the operation stage. The proposed method could apply directly to measured data, although it is not necessarily limited to such data.
26
Chapter 3 Uncertainty in System Operations
This chapter discusses some of the uncertainties in HVAC system operations based on observed data. The observed data includes historical data from building automation systems, on-site measurements from commissioning projects and sub-metered data of individual buildings. Findings from the commissioning projects are used as examples to illustrate system uncertainties in actual system operations.
3.1 VAV System Operations Variable-air-volume (VAV) systems are intended to be an energy-efficient solution to multi-zone buildings with different thermal loads. While perimeter zones may require heating, some internal zones may require cooling. An air handling unit delivers air to all 27
the zones it serves at the same temperature. This temperature is fixed at approximately 12.8°C throughout the year in some systems. The air temperature is set to satisfy the cooling demand and for dehumidification purposes. The air delivered to the zones which need less cooling, or need heating, is reheated by hydronic coils in the VAV terminal boxes.
In an air handling unit, outside air is mixed with return air. The economizer modulates dampers to control the ratio of outside air to return air in an attempt to approach the desired supply air temperature when the outside air is cool. Preheating coils are located behind the mixing chamber to prevent freezing, and cooling coils are located next to the preheating coils.
This chapter utilizes data from an on-campus system optimization project. As shown in Figure 3-1, the main components of this project include real-time energy consumption monitoring, building simulation, energy audit and building commissioning. Energy audit and on-site measurement are performed for the selected buildings as a part of this dissertation research. Historical data from control systems are analyzed to detect energy efficiency related problems. The sub-metered cooling and heating consumption is also used for energy audit and building commissioning. Based on the problems identified from the energy audits and building commissioning projects, a database which includes building energy consumption, major faults in system operations and energy saving potentials is compiled. Building simulation software EnergyPlus is used to model 28
building performance, study retrofit strategies, and estimate potential energy savings. Local weather data and metered data are used to calibrate the simulation models. Using detailed investigations in conjunction with energy simulations, energy saving strategies are proposed and implemented.
Local Weather Station
BPAT
Real-time Energy Consumption Database
Live Display
1000 kWh
Simulation
Energy Audit & Commissioning
Building Info. Database
2000 1800 1600 1400 1200 1000 800 600 400 200 0 Jan Feb Mar Apr May Jun Jul Aug Sep Oct Nov Dec Month
Figure 3-1 Components of system optimization project
3.2 Typical Faults in VAV Systems Typical problems identified from the commissioning projects include inefficient use of economizers, cooling and heating counteraction in air handling units, and excessive zone
29
heating. Inefficient use of economizers exists in 56% of the buildings, cooling and heating counteraction exists in 53% of the buildings, and excessive reheating exists in 85% of the buildings in the commissioning project.
3.2.1
Inefficient Use of Economizers and Cooling and Heating Counteraction in
AHUs When the outside air temperature is several Celsius degrees lower than the supply air temperature set-point, free cooling can be utilized and there should be no chilled water consumption. Figure 3-2 shows the cooling energy consumption versus outside air temperature of an educational building. When outside air temperature is lower than 10°C, cooling energy consumption still takes place. Both the inefficient use of an economizer and cooling and heating counteraction in air handling units can explain this phenomenon. First, the economizer fails to modulate the dampers to achieve the correct ratio of outside air to return air so that free cooling can be utilized to the maximum extent. Therefore, the system is forced to use more energy to reach the required supply air temperature. Second, simultaneous cooling and heating might occur in the air handling units. Flaws in control logic, improper set-points and malfunction of valves and/or actuators can lead to simultaneous cooling and heating. With both coils operating, the downstream cooling coil must remove the heat introduced by the heating coil to maintain the supply air temperature set-point. In addition to these two deficiencies, measurement noise may contribute to the amount of unnecessary cooling energy consumption. 30
Means and Standard Deviation of Cooling Consumption 35
30
25
W/m 2
20
15
10
5
0
0
2
4
8 6 Temperature (°C)
10
12
14
Figure 3-2 Cooling energy consumption of an educational building
Figure 3-3 shows the simulated and metered cooling consumption of a public building. It can be observed from metered cooling consumption that in December, January and February, there is still a certain amount of chilled water consumption even though simulation results show little or almost no chilled water consumption. Unlike under actual conditions, in the simulation, the idealized utilization of free cooling through an economizer can be achieved to a precise degree, and no cooling and heating counteraction takes place in air handling units. This example illustrates one type of
31
discrepancy between simulated and actual operations. In Chapter 6, cooling and heating counteraction in the AHUs is selected as a fault to be detected in one of the studies, in order to verify the proposed fault detection method.
1000 kWh
Simulated 2000 1800 1600 1400 1200 1000 800 600 400 200 0
Jan
Feb
Mar
Apr
May
Metered
Jun
Jul
Aug Sep
Oct
Nov Dec
Figure 3-3 Simulated and metered cooling consumption
3.2.2 Excessive Reheating in VAVs Excessive reheating can be caused by deficiencies in VAV air flow rate control. The VAV-box air damper should modulate the air flow rate to its minimum amount before the reheat commences. If the air flow rate is larger than minimum amount when the reheat function is on, simultaneous heating and cooling will take place, which is prohibited by most energy codes. This can be caused by failure of the VAV box controller because of inadequate or excessive static pressure, stuck dampers or sensor errors. Since dampers and air flow rate sensors are more prone to faults, the actual air flow rate is likely to
32
deviate even further from its most efficient and optimal level. Oversizing the minimum VAV air flow rate in the design stage will also cause excessive reheating.
It is very common for air flow sensors to underestimate air flow rate. Figure 3-4 shows sensor readings versus on-site measurements of air flow rate in a public building. The four sensor readings are much lower than the on-site measurements. Both damper malfunction and inaccurate sensor measurements cause excessive air flow supply and reheating.
6000
Air flow rate (m3/h)
5000 4000 3000 2000 1000 0
Control room
Lab Sensor reading
Stair 1
Stair 2
On-site measurement
Figure 3-4 Sensor readings versus on-site measurements of air flow rate
Figure 3-5 shows the total supply air flow rate of a laboratory building versus outside air dry-bulb temperature. The mean values and standard deviation are plotted for each five-
33
degree interval of outside air temperature. The air flow rate is normalized by the max mean value, in this case, the mean value of air flow rate when outside air temperature is between 27.5°C and 32.5°C. As shown in Figure 3-5, air flow rate is correlated with outside air temperature. When outside air temperature is below 10°C, the air flow rate is about 70% to 90% of the maximum mean value observed. This indicates that the range of actual air flow rate change is very small. The VAV minimum flow rate is typically specified as a fraction of the maximum air flow rate. This fraction is often referred to as the VAV turndown ratio. The actual VAV turndown ratio on average is very likely to be over 0.7, based on the information in Figure 3-5, which indicates excessive air flow supply.
34
Mean and standard deviation of normalized air flow rate by outside air temperature
100%
90%
80%
70%
60% -15
-10
-5
0
5 10 15 20 Outside air temperature (°C)
25
30
35
Figure 3-5 Mean values and standard deviation of normalized air flow rate by outside air dry-bulb temperature
Figure 3-6 and Figure 3-7 plot the air flow rate by hour in a similar way to Figure 3-5. Average normalized hourly outside air temperature is also plotted so that the fluctuation in outside air temperature can also be taken into consideration. When outside air temperature remains more or less constant, a lower air flow rate should be required at night because the internal load is lower during the night. Figure 3-6 and Figure 3-7 show that there is a 5% to 10% change in the air flow rate between nighttime and daytime when outside air temperature is between 8°C and 16°C. This small change supports the hypothesis that the minimum air flow rate is suboptimal. 35
Mean and standard deviation of normalized air flow rate by hour
100%
95%
90%
85%
80%
0
6
12 Hour
18
24
Figure 3-6 Mean values and standard deviation of normalized air flow rate by hour when outside air temperature is between 8°C and 12°C
36
Mean and standard deviation of normalized air flow rate by hour
100%
95%
90%
85%
80%
0
6
12 Hour
18
24
Figure 3-7 Mean values and standard deviation of normalized air flow rate by hour when outside air temperature is between 12°C and 16°C
Figure 3-8 shows the amount of excessive reheating of an educational building in the summer. The VAV system operates 24 hours a day throughout the year. Excessive reheating accounts for more than half of the current reheating consumption. Sensor error accounts for the excessive air flow rate, which results in excessive reheating in this case. The amount of excessive reheating is calculated based on measurements and simulations. More details about the calculation of the amount of excessive reheating can be found in Yan et al. (2009).
37
Figure 3-8 Excessive reheating of an educational building
In Chapter 6, excessive reheating in the VAVs is selected as a fault to be detected in two studies, in order to verify the proposed fault detection method.
3.3 Uncertain Variables Related to System Controls In system operations, uncertainty may result from any deviation from the intended performance of a system. Most energy modeling assumes that systems operate under ideal conditions. Control is assumed to be precise and set-points are always met. This is not necessarily the case when systems operate under actual conditions. Deviation from set points and fluctuation both occur. If systems are assumed to operate under ideal conditions, the results are really a prediction of energy consumption of buildings that perform as intended, rather than a reflection of their performance under actual conditions. 38
In this section, observations based on on-site measurements in system operations with respect to AHU supply air temperature are used to demonstrate that both deviation from set points and fluctuation can occur in variables related to system control. AHU supply air temperature is an important control target in VAV systems. Sub-optimal AHU supply air temperature will increase energy consumption and affect thermal comfort levels. In addition, AHU supply air temperature can be measured relatively accurately, as opposed to other temperature measurements in AHUs. Measurements of mixed air temperature and temperature after preheating are taken before the air is mixed by a supply fan, with the result that a single point of measurement is not likely to represent actual temperatures. The sensor that measures supply air temperature is located on the downstream side of the supply fan, where the air is well mixed. This ensures a relatively accurate measurement. Therefore, measurements of AHU supply air temperature are used to illustrate the uncertainty in variables related to system control.
Figure 3-9 and Figure 3-10 provide two examples of the well-controlled AHU supply air temperature of two different AHUs. The hourly AHU supply air temperatures are stable. Only a very small fluctuation in temperature is observed. In both cases, the actual supply air temperature is controlled at almost exactly 12.8 ± 0.5°C. In the first case, shown in Figure 3-9, the mean temperature is 12.8°C and the standard deviation is 0.2°C. In the second case, seen in Figure 3-10, the mean temperature is 12.8°C and the standard deviation is 0.3°C. 39
300
Number of occurance
250
200
150
100
50
0 11
11.5
13 12 12.5 AHU supply air temperature (°C)
13.5
14
Figure 3-9 Histogram of AHU supply air temperature 11/1/2008-3/9/2009
250
Number of occurance
200
150
100
50
0 11
11.5
13 12.5 12 AHU supply air temperature (°C)
13.5
Figure 3-10 Histogram of AHU supply air temperature 2/8/2008 – 4/30/2008
40
14
Figures 3-11 to 3-16 provide examples of AHU supply air temperature not meeting the respective set-points. In two AHUs, shown in Figure 3-11 and Figure 3-12, the set-point is 12.8°C, although the AHU supply air temperature is mostly approximately 0.5°C to 1°C higher. The AHU supply air temperature shown in Figure 3-13 and Figure 3-15 varies across a larger range. Poor control of AHU supply air temperature could be the result of bad proportional integral derivate (PID) loop control, or caused by the malfunction of valves and dampers. An insufficient supply of chilled water could also contribute to the high supply air temperature during the summer.
180 160
Number of occurance
140 120 100 80 60 40 20 0 11.5
12
13.5 13 12.5 AHU supply air temperature (°C)
14
14.5
Figure 3-11 Histogram of AHU supply air temperature 4/8/2008 – 4/30/2008
41
Number of occurance
150
100
50
0 11.5
14.5
14
13.5 13 12.5 AHU supply air temperature (°C)
12
Figure 3-12 Histogram of AHU supply air temperature 4/8/2008 – 4/30/2008
60
Number of occurance
50
40
30
20
10
0 12.5
13
13.5
15 14.5 14 AHU supply air temperature (°C)
15.5
16
16.5
Figure 3-13 Histogram of AHU supply air temperature 3/19/2009 – 4/7/2009
42
25
Temperature (°C)
20 15 10 5 0 03/19/2009
03/21/2009 outside air
03/23/2009 mixed air
03/25/2009
03/27/2009
supply air
return air
Figure 3-14 Temperature log of outside air, mixed air, supply air and return air in the same AHU as shown in Figure 3-13.
100
Number of occurance
80
60
40
20
0 11
11.5
12
13.5 13 12.5 AHU supply air temperature (°C)
14
14.5
15
Figure 3-15 Histogram of AHU supply air temperature 7/16/2008 – 7/30/2008
43
40
Temperature (°C)
35 30 25 20 15 10 07/16/2008
07/19/2008 outside air
07/22/2008
07/25/2008
return air
07/28/2008
after preheat
07/31/2008 supply air
Figure 3-16 Temperature log of outside air, air after preheat, supply air and return air in the same AHU as shown in Figure 3-15.
Figure 3-14 plots the outside air, mixed air, supply air and return air in the same AHU as in Figure 3-13. The return air temperature is within an acceptable range, typically between 21°C and 23°C. However, several conspicuous faults in this AHU might be taking place, according to these measurements. First, the economizer is not fully functional. The ratio of outside air flow rate to total supply air is not optimal. As shown in Figure 3-14, while the system should take in 100% outside air temperature, the measurements indicate that the mixed air temperature is close to the return air temperature, which means a large portion of return air continues to be used. Second, excessive preheating may be occurring, which causes AHU supply air temperature to rise above the set-point. Third, an insufficient chilled water supply could have the result that
44
the AHU supply air temperature fails to maintain the set-point when mixed air temperature is high.
Figure 3-16 plots the outside air, mixed air, supply air, and return air in the same AHU, as shown in Figure 3-15. It can be seen that when the AHU supply air temperature rises above 12.8°C, the return air temperature sometimes exceeds 26°C, which indicates that the AHU fails to meet the cooling demand of the building and thermal comfort level is compromised.
Fluctuation in actual AHU supply air temperature and deviation from set-points could directly affect zone thermal comfort levels and system energy consumption. A low AHU supply air temperature could increase chilled water usage as well as steam usage. A high AHU supply air temperature could compromise thermal comfort levels, and might necessitate an increase in fan electricity, since a larger supply air flow rate would then be required. Even small fluctuations in the well-controlled AHU supply air temperature could still introduce uncertainty into predictions of energy consumption, particularly when considered in terms of hourly energy consumption levels. In Chapter 5, the impact of uncertain AHU supply air temperature on hourly cooling and heating will be evaluated.
45
Chapter 4 Gaussian Process Regression
Gaussian Process regression is used to predict energy consumption of existing systems and to quantify the uncertainty in predictions. In this chapter, the types of uncertainty included in the Gaussian Process modeling are discussed. This discussion is followed by a summary of the theory and implementation of Gaussian Process regression based on book chapters by Rasmussen and Williams (2006) and MacKay (2003). The analytical approach for Gaussian process modeling with noisy inputs is also summarized. The following discussion proposes several possible extensions to the standard Gaussian Process modeling method that might improve uncertainty analysis in future research studies.
46
4.1 Predicting with Gaussian Processes In the chapter on Gaussian Processes of MacKay’s book (2003), MacKay traces the first use of Gaussian Processes for time-series analysis back to 1880 (Lauritzen, 1981). Gaussian Processes for regression are believed to have been first introduced by O’Hagan (1978). There has been a surge of interest in Gaussian Process modeling following recent advances in the machine learning community (Neal, 1995; Rasmussen, 1996). Gaussian Processes have been successful in solving many real-word data modeling problems (MacKay, 1997).
Rasmussen (1996) explores the idea of replacing supervised Neural Networks with Gaussian Processes, while making a thorough comparison with other methods, including Neural Networks. Rasmussen finds that Gaussian Processes consistently outperform conventional Neural Networks, Nearest Neighbor models, and Multivariate Adaptive Regression Splines. Apart from a high level of prediction accuracy, Gaussian Processes are also relatively simple to implement and use. They are useful statistical modeling tools for automated tasks, not least because the outcomes of Gaussian Process regression come in the form of probability distributions, which take uncertainty in the modeling process into account. With certain adaptations, parameter uncertainty and parametric variability can also be integrated into predictions.
47
One could begin with the assumption that there are 𝑁 historical data points. Each point
consists of an input vector 𝐱 and a target 𝑦. Figure 4-1 summarizes the procedure of using
Gaussian Processes to predict the value of 𝑦 ∗ at a new point 𝐱 ∗ . A Gaussian Process is
trained upon the historical data. Next, it takes new inputs and outputs a predictive distribution.
Gaussian Process regression can capture various uncertainty sources. In Figure 4-1, the probability distributions of the inputs of a new point express parametric variability and/or parameter uncertainty. Probability distributions of training inputs express parameter uncertainty and observation error. Observation error refers to the measurement error or noise in temperatures, flow rate and other variables. Observation error also exists in training targets. Apart from observation error, probability distributions of training targets express residual variability. There is residual variability when the process is inherently stochastic. It is also possible that the features in the current model could not fully explain the variance in training targets. There might also be other important features that affect the outputs. If additional related features can be identified and included in the model, the residual variability can be reduced. One additional source of uncertainty is absent in Figure 4-1. Gaussian Process regression can also account for inadequacies in a model, specifically, it can take interpolation uncertainty into consideration. Gaussian Process regression is an interpolation method. The variance of a prediction depends on the
48
distance between its input point and training points. If a new input point lies beyond the scope of the training input domain, the variance in the prediction will be great.
Figure 4-1 Diagram of making predictions with uncertainty through Gaussian Process regression
4.2 Basic Ideas of Gaussian Processes In this section, the basic principles of Gaussian Processes and the mathematics used in this dissertation are briefly discussed, based largely on the work of Rasmussen and Williams (2006).
49
There are 𝑁 data points. Each point consists of input 𝐱 and target 𝑦. It is assumed that
there is a function 𝑓(𝐱) that underlies the observed data. The goal is to infer the function
from the given data. Then the 𝑓(𝐱 ∗ ) can be used to predict the value of 𝑦 ∗ at a new point
𝐱 ∗ . The prediction should be in the form of a probability distribution, which quantifies
uncertainty. 𝑁 input vectors are denoted by 𝐗 and the set of corresponding target values are denoted by the vector 𝐲. Using Bayes’ theorem, the posterior probability distribution of 𝑓(𝐱) is
𝑃(𝑓(𝐱)|𝐲, 𝐗) =
𝑃(𝐲|𝑓(𝐱), 𝐗)𝑃�𝑓(𝐱)� 𝑃(𝐲|𝐗)
(4.1)
In the regression problem, 𝑃(𝐲|𝑓(𝐱), 𝐗), the probability distribution of the target values
given the function 𝑓(𝐱) and inputs 𝐗 is usually assumed to be Gaussian.
The prior 𝑃�𝑓(𝐱)� is placed in the space of functions, without parameterizing 𝑓(𝐱)
(MacKay, 2003). A Gaussian Process can be understood as the generalization of a
Gaussian distribution over a vector space to a function space. A Gaussian distribution is fully specified by its mean and covariance matrix. Correspondingly, a Gaussian process is completely specified by a mean function and a covariance function. Usually, the mean function is taken to be zero for the purpose of notational simplicity. A covariance function 𝑘(𝐱 𝑖 , 𝐱𝑗 ) expresses the covariance between the values of the function 𝑓(𝐱) at the points 𝐱 𝑖 and 𝐱𝑗 . The choice of covariance function in this study is a Gaussian kernel, 50
where
1 𝑇 𝑘(𝐱 𝑖 , 𝐱𝑗 ) = 𝜎𝑓2 exp �− �𝐱𝑖 − 𝐱𝑗 � 𝐖−1 �𝐱 𝑖 − 𝐱𝑗 �� 2
𝐖 = diag[𝑤12 , 𝑤22 , … , 𝑤𝐷2 ]
(4.2)
(4.3)
where diag denotes diagonal matrix.
Inputs that are judged to be close to each other as a result of the covariance function are likely to have similar outputs. A prediction is made by considering the covariance between the predictive case and all the training cases (Rasmussen, 1996). For a noise-free input 𝐱 ∗ , the predictive distribution of 𝑓(𝐱 ∗ ) is Gaussian with mean 𝜇(𝐱 ∗ ) and variance 𝜎 2 (𝐱 ∗ ) (Rasmussen & Williams, 2006)
𝜇(𝐱 ∗ ) = 𝐤(𝐗, 𝐱 ∗ )T (𝐊 + σ2𝑛 𝐈)−1 𝐲
𝜎 2 (𝐱 ∗ ) = 𝑘(𝐱 ∗ , 𝐱 ∗ ) − 𝐤(𝐗, 𝐱 ∗ )T (𝐊 + σ2𝑛 𝐈)−1 𝐤(𝐗, 𝐱 ∗ )
(4.4) (4.5)
𝐈 is the unit matrix. 𝐤(𝐗, 𝐱 ∗ ) is the 𝑁 × 1 vector of covariance functions between training
inputs 𝐗 and the new input 𝐱 ∗ . 𝐊 is the 𝑁 × 𝑁 matrix of covariance functions between each pair of training inputs. σ2𝑛 denotes the variance of Gaussian noise in training targets 𝐲. 𝜎𝑓 , σ𝑛 and 𝑤1 , 𝑤2 … 𝑤𝐷 are hyperparameters to be trained in a Gaussian Process.
51
After a form of covariance function has been chosen, the undetermined hyperparameters 𝜽 must be determined from the given dataset 𝒟. Ideally, predictions would be based on the integration over the prior distribution of hyperparameters,
𝑃(𝑦 ∗ |𝐱 ∗ , 𝒟) = � 𝑃(𝑦 ∗ |𝐱 ∗ , 𝜽, 𝒟)𝑃(𝜽|𝒟)d𝜽
(4.6)
However, this integral is usually intractable, and the following two approaches are usually taken: 1. Perform the integration over 𝜽 numerically using Monte Carlo methods, and
2. Approximate the integral by using the most probable values of hyperparameters (Mackay, 2003). 𝑃(𝑦 ∗ |𝐱 ∗ , 𝒟) ≃ 𝑃(𝑦 ∗ |𝐱 ∗ , 𝒟, 𝜽MP )
(4.7)
According to Rasmussen (1996), these two approaches are usually quite close in performance. Particularly in the case of a large number of training cases, predictions using the most probable hyperparameters generally differ only slightly from the results of integrating over hyperparameters by using Monte Carlo methods. Integrating over hyperparameters using the Monte Carlo approach leads to better results for small datasets, while using the most probable hyperparameters for predictions is a better choice for intermediate and large data sizes because it is faster. Given that the size of the datasets used in this dissertation is at least intermediate, the second approach is used.
52
The most probable 𝜽 is the set of hyperparameters that maximizes the probability of the model given the data based on the computation of marginal likelihood. The Log marginal likelihood is, 1 1 𝑁 log 𝑃(𝐲|𝐗, 𝜽) = − 𝐲 T 𝐊 −1 log 2𝜋 𝑦 𝐲 − log�𝐊 𝑦 � − 2 2 2
(4.8)
where 𝐊 𝑦 = 𝐊 + σ2𝑛 𝐈 can be viewed as the covariance matrix when targets 𝐲 are noisy. 1 2
log�𝐊 𝑦 � is the complexity penalty. The conjugate gradient optimization technique is
used to search the hyperparameters that maximize the marginal likelihood in response to
the given data. Multiple local maxima may be present, each corresponding to an interpretation of the data. There is a chance that the search will result in a bad local optimum, however, practical experience suggests that this is not an insurmountable problem.
The partial derivative of the marginal likelihood with respect to a hyperparameter 𝜃𝑗 is, 𝜕𝐊 𝑦 −1 𝜕𝐊 𝑦 ∂ 1 1 log 𝑃(𝐲|𝐗, 𝜽) = 𝐲 T 𝐊 −1 𝐊 𝑦 𝐲 − tr �𝐊 −1 � 𝑦 𝑦 ∂𝜃𝑗 2 𝜕𝜃𝑗 2 𝜕𝜃𝑗
(4.9)
To compute the inverse covariance matrix 𝐊 −1 𝑦 , the Cholesky decomposition is used. This
is an exact method which has a computational cost of order 𝑁 3 . Once 𝐊 −1 𝑦 is known, the
53
computation of derivatives in Equation (4.9) requires time 𝒪(𝑁 2 ) per hyperparameter. It takes 𝒪(𝑁) operations to make a prediction after the derivatives are calculated.
The basic form of Gaussian Process regression does not include parameter uncertainty and parametric variability. Observation error is only accounted for in training targets, not in training inputs. The Matlab code written by Rasmussen and Williams (2013) supplies the learning process of basic Gaussian Process regression.
4.3 Dealing with Uncertain Inputs In the previous section, the predictive distribution from a Gaussian Process model corresponds to the noise-free input values of a new point. Parameter uncertainty and parametric variability lead to additional prediction uncertainty. Moreover, noise can come from measurements as well. In some cases, the inputs of a new point that is to be predicted are uncertain because it is not possible to know precisely what the values are. In this case, a distribution is assigned to each uncertain input as an estimate. As discussed in Chapter 2, this is called parameter uncertainty. Sometimes, it is most beneficial to investigate the impact of uncertain inputs on outputs by varying inputs according to appropriate distributions and examining the corresponding distributions of outputs. This is defined as parametric variability. To account for the parameter uncertainty and parametric variability described above, this section summarizes an analytical approach that uses Gaussian approximation to compute the mean and variance of the predictive
54
distribution with uncertain inputs when the covariance function is a Gaussian kernel (Girard et al., 2003).
To incorporate parametric variability, assuming the input distribution is Gaussian 𝐱 ∗ ~𝓝𝐱 ∗ (𝝁𝐱∗ , 𝚺𝐱∗ ), then the predictive mean 𝜇(𝝁𝐱 ∗ , 𝚺𝐱 ∗ ) and variance 𝜎 2 (𝝁𝐱 ∗ , 𝚺𝐱∗ ) of a
prediction with noisy inputs can be computed according to Equations (4.10) to (4.14) (Girard et al., 2003): 𝜇(𝝁𝐱∗ , 𝚺𝐱∗ ) = 𝐪T 𝜷
(4.10)
𝜎 2 (𝝁𝐱∗ , 𝚺𝐱∗ ) = 𝑘(𝝁𝐱∗ , 𝝁𝐱 ∗ ) + Tr[(𝜷𝜷T − (𝐊 + σ2𝑛 𝐈)−1 𝐐)] − (𝐪T 𝜷)2
(4.11)
𝜷 = (𝐊 + σ2𝑛 𝐈)−1 𝐲
(4.12)
With
1 1 𝑞𝑖 = |𝐖 −1 𝚺𝐱∗ + 𝐈|−2 𝜎𝑓2 exp �− (𝝁𝐱 ∗ − 𝐱 𝑖 )T (𝚺𝐱∗ + 𝐖)−1 (𝝁𝐱 ∗ − 𝐱𝑖 )� 2
−1 T 1 𝐱 𝑖 + 𝐱𝑗 1 𝐱 𝑖 + 𝐱𝑗 1 𝑄𝑖𝑗 = |2𝐖 −1 𝚺𝐱∗ + 𝐈|−2 𝜎𝑓2 exp �− � − 𝝁𝐱∗ � �𝚺𝐱∗ + 𝐖� � − 𝝁𝐱∗ �� 2 2 2 2
1 T ∙ 𝜎𝑓2 exp �− �𝐱 𝑖 − 𝐱𝑗 � (2𝐖)−1 (𝐱𝑖 − 𝐱𝑗 )� 2
(4.13)
(4.14)
By employing a Gaussian input distribution and using a Gaussian kernel, it is unnecessary to run additional simulations to incorporate the uncertain values of an input
55
point. It can be simply derived from the analytical expressions above. This significantly reduces the time cost of uncertainty analysis. It also allows uncertainty analysis to be derived from measured data.
Some constraints continue to remain when the predictive distribution of output is derived from the analytical expressions of Equations (4.10) to (4.14). First, the distributions of the inputs to be examined are assumed to be Gaussian. For other distributions, approximate or exact analytical expressions are also possible, but these will be different. Second, training sets need to account for most of the input domain to be examined in the study. Otherwise, prediction accuracy will be compromised and the uncertainty introduced by the modeling process will dominate. Third, since the predictive distribution includes the uncertainty of the modeling process, a comparison with the predictive distribution derived from noise-free inputs is necessary. Finally, the computational cost of the Gaussian Process is 𝑂(𝑁 3 ), where 𝑁 is the number of training points. If the number of training points needed for the model is large, the advantage of using Gaussian
Processes is less prominent, unless a more efficient algorithm is used for the inversion of the covariance matrix.
4.4 Possible Extensions This chapter summarizes the Gaussian Process modeling techniques used in this dissertation. There are three possible extensions to the specific Gaussian Processes used
56
here. These include training Gaussian Processes with noisy input to provide more comprehensive uncertainty interpolations, using more complicated covariance functions to improve prediction accuracy, and improving computational algorithms to allow Gaussian processes to be applied to large datasets.
Parameter uncertainty and parametric variability of points to be predicted can be accounted for using the Gaussian Process regression described in this chapter. However, training inputs are assumed to be noisy-free. As training inputs may also have parameter uncertainty and observation error, a more comprehensive uncertainty interpolation can be achieved if Gaussian Processes are trained with input noise. McHutchon and Rasmussen (2011) propose the use of a Taylor series with Gaussian Processes to allow training on noisy input data. The variances of training inputs are inferred from the given training data as extra hyperparameters. They are learned along with other hyperparameters by the same method of maximization of the marginal likelihood. The Matlab code provided by McHutchon (2012) can easily manage datasets with 1000 training points and 20 input features.
Gaussian kernels are selected as the covariance function in this research. However, the prediction accuracy might still be improved if more complicated covariance functions or certain extensions to the basic Gaussian kernel were applied. Alternatively, a slightly different approach might be to modify the noise model in training targets 𝐲. In this 57
dissertation, the variance in training targets 𝐲 is assumed to be input-independent
Gaussian noise σ2𝑛 , as shown in Equations (4.4) and (4.5). This could be replaced by an
input-dependent noise model 𝒩(𝐱; 𝜽) (Abrahamsen, 1997; Mackay, 2003), 𝐽
𝒩(𝐱; 𝜽) = exp ��
𝑗=1
𝛾𝑗 𝜙𝑗 (𝐱)�
(4.15)
𝛾𝑗 can be trained along with other hyperparameters. The computational cost of Gaussian Process modeling increases according to the number of variables resulting from the inversion of the covariance matrix. The Cholesky decomposition used in this research has an associated computational cost of order 𝑁 3 . It
can be time consuming for large data sets. An alternative method proposed by Skilling
−1 (1993) that makes approximations to 𝐊 −1 has an associated 𝑦 𝐲 and Trace 𝐊 𝑦
computational cost of order 𝑁 2 . This can be very useful when the number of data points is large.
58
Chapter 5 Predicting Cooling and Heating Consumption
In this chapter, two studies are performed in order to demonstrate the effectiveness of modeling through Gaussian Processes and to verify prediction accuracy. The first study compares the prediction accuracy of Gaussian Processes and Neural Networks using submetered building cooling and heating consumption. The second study demonstrates how to analyze the impact of uncertain variables related to system control on energy use by using Gaussian Processes.
5.1 Predicting Energy Use or Demand In this case study, time and weather information are used to predict building cooling and heating consumption based on historical data. This type of modeling is frequently applied 59
to energy demand prediction for smart grid technologies and energy saving verification for commissioning (Heo & Zavala, 2012). In the past, Neural Networks were most commonly used for these tasks. The reported error rates of short-term prediction (1h to 24h) using Neural Networks can be as low as 1%-5%. Long-term prediction accuracy is equally promising (Dodier & Henze, 2004). Gaussian Processes can also serve this purpose with the additional advantage that predictions made by Gaussian Processes are in the form of probabilistic distributions instead of fixed values. Therefore, the results of Gaussian Process modeling express the uncertainty of predictions, whereas this uncertainty could not be quantified explicitly and directly through Neural Networks.
In this study, data samples are collected from an on-campus laboratory building. The building is served by three primary air-handling units with heat recovery, along with radiators and VAV boxes with hot water reheat as terminal units. The metered energy use is aggregated into hourly data every five minutes. In other words, all the data samples used in the model are on an hourly basis. The targets are •
Hourly chilled water use (W/m2)
•
Hourly steam use (W/m2).
The input features include •
Outside air dry-bulb temperature (°C)
•
Humidity ratio (kg/kg)
•
Hour of day, represented by sin �
2𝜋∙hour 24
60
� and cos �
2𝜋∙hour 24
�.
It is assumed that measurements of time, temperature and humidity ratio are noise-free, while measurements of chilled water and steam use are noisy.
95% confidence region Predictive mean Observed value 100
300
Steam Use (W/m 2)
Chilled Water Use (W/m 2)
350
250
200
150
0
6
12 Hour
18
90 80 70 60 50
24
0
6
12 Hour
18
24
Figure 5-1 24-hour prediction of chilled water and steam use
Figure 5-1 shows the 24-hour prediction of chilled water and steam use by a Gaussian Process (Equations (4.4) and (4.5)) trained by 216 hourly data points. The solid line indicates the predictive mean, the gray area includes values within a 95% confidence region, compared with the observed values, shown as dots. Most of the predictive means are close to the observed values. Observation error, residual variability and interpolation uncertainty are included in the predictions.
In order to evaluate the prediction accuracy, Gaussian Process modeling is tested on metered chilled water and steam use and the prediction results are compared with those of Neural Networks. Neural network training is implemented through the Matlab (version 61
R2011a) Neural Network Toolbox. As shown in Figure 5-2, in this model, there is one hidden layer with 15 neurons. The activation equation in the hidden layer is sigmoid, and linear in the output layer. The training algorithm is Levenberg-Marquardt backpropagation.
Figure 5-2 Structure of Neural Network used in the study
To compare the accuracy of Gaussian Processes with Neural Networks, ten-fold crossvalidations are performed on three types of prediction tasks, including 24-hour prediction, 72-hour prediction and 9-day prediction. The coefficient of determination is used to compare the accuracy of the predictions of Gaussian Processes and Neural Networks, respectively. The coefficient of determination 𝑅2 is ∑𝑖(𝑦𝑖 − 𝑓𝑖 )2 𝑅 =1− ∑𝑖(𝑦𝑖 − 𝑦�)2 2
62
(5.1)
where the values 𝑦𝑖 are observed values of targets, the values 𝑓𝑖 are predicted values. For Gaussian Processes, values 𝑓𝑖 are the predicted mean values. 𝑦� is the mean value of the
observed targets. The more accurately a model predicts future outcomes, the closer the value of 𝑅2 is to 1. A larger 𝑅2 value indicates a smaller sum of squared errors of
prediction.
Metered chilled water and steam use over a period of four months is used in this study. Ten groups of ten-fold cross-validation are performed for 24-hour prediction, three groups for 72-hour prediction and one group for 9-day prediction. The overall 𝑅2 value is used for the purpose of comparison. The results are shown in Figure 5-3.
Steam Use
R2 1.00
R2 1.00
0.95
0.95
0.90
0.90
0.85
0.85
0.80
0.80
0.75
0.75
0.70
24-hour
72-hour
0.70
9-day Neural Network
Chilled Water Use
24-hour 72-hour Gaussian Process
9-day
Figure 5-3 Comparison of 𝑹𝟐 values of Gaussian Processes to Neural Networks
63
As seen in Figure 5-3, Gaussian Processes outperform Neural Networks when predicting chilled water use 24 hours in advance. 𝑅2 values of the two modeling methods are similar
for 72-hour prediction and 9-day prediction. It can be concluded from the crossvalidations above that the predictive accuracy of Gaussian Processes is close to that of the more widely used Neural Networks approach. For short-term prediction, the accuracy of Gaussian Processes is even higher than that of Neural Networks. More careful research design for future comparative studies might be necessary in order to generalize the conclusions of this experiment. Nevertheless, this experiment makes it possible to get an idea of how well Gaussian Processes will perform on other datasets with similar characteristics, which holds considerable promise for future research.
5.2 Evaluating the Impact of Uncertain Inputs The input values associated with predictions can arise from estimations or measurements corrupted with noise. Furthermore, input variables themselves can be intrinsically nondeterministic. Therefore, it makes more sense to assign probability distributions over the domains of plausible values than to assign fixed single-point values. In some cases, it is desirable to investigate the impact of uncertain inputs on outputs by allowing inputs to vary in their domains. For example, in order to make real-time predictions for the energy demand of the next 24 hours, it is necessary to use the next 24-hour weather forecast. Weather forecasting involves uncertainty. Several other random factors affect a prediction. Human behavior is stochastic. System control also contributes randomness to
64
the process. Gaussian Processes with uncertain inputs, as shown in Equations (4.10) and (4.11), incorporate the Gaussian noise of inputs into predictions. Therefore, Gaussian Processes can take parameter uncertainty and parametric variability into account.
In this case study, the impact of variance in AHU supply air temperature on chilled water use and steam use is examined. The system being studied is an AHU VAV system with terminal reheat for an office building that runs 24 hours a day. The AHU supply air temperature from one summer month, measured hourly, is available for study. The histogram is shown in Figure 5-4. The set-point of AHU supply air temperature is 11.1°C (52°F). The mean value of measured hourly AHU supply air temperature is almost the same as the set-point. However, a standard deviation of 1.1°C is observed. The AHU supply air temperature varies from 9°C to 15°C. Poor PID control, or an insufficient or excessive supply of chilled water could account for the deviation from the set-point. AHU supply air temperature is a system control related factor. The wide range of variation in actual AHU supply air temperature directly affects system energy use. Gaussian Process regression is built on the available data points and the input distribution is plugged into Equations (4.10) and (4.11) to get the predictive distribution of energy use directly.
65
200
Frequency
150
100
50
0
9
10
11 12 13 AHU Supply Air Temperature (°C)
14
15
Figure 5-4 Histogram of measured AHU supply air temperature
The input features of the Gaussian Process in this case study include time, outside air temperature and humidity, and data from one month of measured AHU supply air temperature. The outputs are cooling and reheating consumption. The training inputs are treated as noise-free, while training targets are treated as noisy. The training 𝑅2 is 0.9808
for cooling and 0.9987 for reheating. Then, for each point, 𝓝(11.1,1. 12 ) is used as the
input distribution of AHU supply air temperature. The predictive distributions of hourly
cooling and reheating are modeled according to Equations (4.10) and (4.11). Additional uncertainty in predictions is introduced by the variance in AHU supply air temperatures.
Figure 5-5 shows the predictive distributions of cooling and reheating over the course of 48 hours. In this time period, the outside air dry-bulb temperature is between 24°C and 32°C from 8:00 – 20:00 and between 20°C and 26°C during the night. The results are
66
compared with the predictive distributions derived from the noise-free input of AHU supply air temperature, which is consistently assumed to be 11.1°C. With a variance of 1. 12 in AHU supply air temperature, the predictive means stay almost the same, while the region of 95% confidence expands during certain time periods. The dark area is the additional uncertainty introduced by the variance of AHU supply air temperature.
95% confidence region of noisy SAT prediction
120
35
110
30
100
25
Reheating (W/m 2)
Cooling (W/m 2)
95% confidence region of noise-free SAT prediction Predictive mean
90 80 70 60 50
20 15 10 5
0
6
12
18
24 Hour
6
12
18
0
24
0
6
12
18
24 Hour
6
12
18
24
Figure 5-5 Predictive distributions of hourly chilled water use which include the uncertainty introduced by the variance in AHU supply air temperatures
Figure 5-5 shows that, during working hours, the variation in AHU supply air temperature has almost no effect on cooling and reheating. In summer, during working hours, the amount of chilled water needed to process the cooling load does not change with AHU supply air temperature. When the cooling load is large, a higher AHU supply air temperature results in a larger supply air flow rate, and the amount of chilled water
67
needed to process the air remains the same. The reverse is also true. Due to the large cooling load, little reheating is needed, and cooling and heating is hardly affected by AHU supply air temperature. At night, the outside air temperature drops and the internal load is minimal. When the cooling load decreases, the supply air flow rate is fixed at its minimum setting. Therefore, increasing the AHU supply air temperature reduces cooling and reheating. A low AHU supply air temperature will increase cooling consumption, and additional reheating is necessary to compensate for the excessive cooling.
A standard deviation of approximately 1°C in AHU supply air temperature accounts for a standard deviation as large as 5-8% of the predictive mean values of cooling and approximately 20-25% of reheating during certain hours at night. This information will help optimize AHU supply air temperature and analyze cost-effectiveness in commissioning. Targeting a more precise control of AHU supply air temperature and increasing AHU supply air temperature at night, when the outside temperature is low, will conserve both cooling and heating consumption.
The example above shows how Gaussian Processes may be used to study uncertainty introduced by uncertain inputs. Assuming that the input distributions are Gaussian, the predictive distribution can be computed directly without Monte Carlo experiments. It is necessary for the training set to cover most of the input domain. Otherwise, the uncertainty introduced by the modeling process itself would be too large. Usually, this is not an issue if data is generated from simulations. It might, however, be more challenging 68
if a Gaussian Process is built based on observations from actual performance values. The example above uses measured AHU supply air temperature to ensure a realistic pattern, while simulated data by EnergyPlus is used to determine the energy use for cooling and reheating because metered data is not available.
69
Chapter 6 Applications in Fault Detection
In this chapter, a framework for fault detection that uses Gaussian Processes to predict baselines is developed and verified using simulated data. Bayes classifiers and probabilistic graphical models are introduced into the proposed framework in order to detect whether faults have occurred in different system components.
6.1 Bayesian FDD Method Many fault diagnostic and detection (FDD) tools use model-based methods, as discussed in Chapter 2. Observations from an actual process are compared with the outputs from a baseline model. A fault is indicated when the difference between the model outputs and observations is greater than a threshold. The model-based FDD method can be employed to detect excessive building energy consumption, especially for continuous 70
commissioning during the lifecycle of a building. After commissioning, faults are corrected and systems operate normally. However, some faults might reoccur after a certain period of time and cause an increase in energy consumption. One goal of the research presented in this dissertation is to develop an automated FDD method for continuous commissioning. The FDD method should be able to detect the increase in energy consumption due to system faults without sending false alarms when the increase in energy consumption actually lies within the range of the uncertainty.
Inaccurate baseline predictions will cause model-based FDD tools to malfunction. Including uncertainty in baseline predictions is crucial to decision making in fault detection. In order to determine the threshold for whether a fault occurs, modeling uncertainty must be considered. Simulation models based on physical principles are not ideal for fault detection. Such models are too expensive, as they require a deep understanding of the system and model parameters are difficult to estimate. Moreover, physics-based models usually assume that systems are operating under ideal conditions as opposed to reflecting actual system operations, and therefore do not include uncertainties in their predictions. Gaussian Process modeling is a promising candidate for modeling baselines because it is able to predict actual system performance based on historical data in an inexpensive way, and because it can quantify prediction uncertainty in the form of a Gaussian distribution.
71
Figure 6-2 illustrates the proposed FDD method in order to detect excessive building energy use by employing both a Gaussian Process and a Bayes classifier. For an existing building, data is collected during normal operations, for example, for the first few months following commissioning. Using that data as a training set, a Gaussian Process is built to predict baseline consumption, that is to say, it is a prediction of energy consumption assuming normal operations. When it is no longer certain whether faults have reoccurred, the Gaussian Process is used to predict baseline consumption. Then, the baseline consumption and observed energy consumption are input into a Bayes classifier to determine whether the observed energy consumption is excessive. After more data is accumulated, patterns can be derived based on primary results for the purpose of more advanced fault detection. This dissertation concentrates on the first part, primary fault detection, in order to detect whether faults have occurred and if they have caused excessive energy consumption.
72
Figure 6-1 Proposed Bayesian FDD method
The Bayes classifier in the proposed method is a simple probabilistic classifier based on Bayes’ theorem. The three classes for energy consumption are labeled as normal, faulty, and the gray area in between. The probability 𝑃 of an observation that belongs to a class can be computed using Bayes’ theorem as shown in Equation (6.1) 𝑃(𝐶 = 𝑘|𝑌) =
𝑃(𝑌|𝐶 = 𝑘)𝑃(𝐶 = 𝑘) = 𝑘)𝑃(𝐶 = 𝑘)
∑𝐾 𝑘=1 𝑃(𝑌|𝐶
(6.1)
where 𝐶 is the class variable and 𝑌 is energy consumption. 𝑘 = 1, 2, 3 indexes the three classes as normal, in-between and faulty, respectively.
The outputs of the trained Gaussian Process regression are used to compute the conditional probability of observed energy consumption given the class label 𝑃(𝑌|𝐶 = 𝑘).
As described in the previous chapters of this dissertation, the output of Gaussian Process
73
modeling includes a mean value 𝜇 and a standard deviation 𝜎. If a system performs in the same way as when the training data is collected, there is an approximately 68% chance that the observed energy consumption will fall within one standard deviation of the mean value. The standard deviation includes uncertainty caused by interpolation as well as the underlying randomness in system operations. The parameters for the baseline distribution (the normal class) are 𝑌|𝐶 = 1 ~ 𝓝 (𝜇, 𝜎 2 )
(6.2)
where 𝜇 and 𝜎 are derived from the Gaussian Process. The mean value of the Gaussian
distribution for the second class is assigned to be one standard deviation larger than that of the normal class, and two standard deviations larger for the faulty class, 𝑌|𝐶 = 2 ~ 𝓝 (𝜇 + 𝜎, 𝜎 2 )
𝑌|𝐶 = 3 ~ 𝓝 (𝜇 + 2𝜎, 𝜎 2 )
(6.3) (6.4)
Then, to determine whether the current energy consumption is excessive, the class assignment 𝑘 with the highest posterior probability 𝑃(𝐶 = 𝑘|𝑌) is picked: 𝐶 = arg max 𝑃(𝐶 = 𝑘|𝑌) 𝑘
(6.5)
If the prior 𝑃(𝐶 = 𝑘) for all three classes are equal, then it will be classified as faulty when the observed energy consumption is higher than 𝜇 + 1.5𝜎, because the posterior probability 𝑃(𝐶 = 𝑘|𝑌) is the highest when 𝑘 = 3, as illustrated in Figure 6-3.
74
Figure 6-2 Posterior distributions of three classes when their priors are equal
A large 𝜎 indicates high levels of uncertainty in the baseline prediction. The proposed
FDD method will rarely send an alarm when there is little confidence in the baseline prediction. Here, it is proposed that the mean value of the Gaussian distribution for the faulty class is two standard deviations higher than the mean value of the Gaussian distribution for the normal class, which creates a balance between the false positive errors and the false negative errors. The size of the difference between these two mean values can be chosen based on different preferences, fewer false positive errors (false alarms), or fewer false negative errors. A difference lower than two standard deviations between the mean values of the normal and faulty classes will raise more false alarms, while a difference higher than two standard deviations between the two classes will ignore more faulty conditions. Improving the accuracy of Gaussian Process modeling could help reduce both types of error. For example, choosing the proper training sample size and
75
including important features can improve the accuracy of mean value predictions and reduce modeling uncertainty. As a result, more faulty conditions will be recognized and some false alarms might be avoided.
The prosed FDD method is tested on synthetic data generated by EnergyPlus. The energy consumption of a typical office building with four floors is simulated through EnergyPlus. The layout of each floor is shown in Figure 6-4. The internal load density settings are shown in Table 6-1. Figure 6-5 shows a one-week sample of the plug-in load schedule used in the energy model. The electric equipment usage is assumed to be high in the daytime on working days, and low at night and on weekends. Random elements are added to the schedule in order to make the energy model more realistic.
76
Figure 6-3 Floor plan of the simulated building
Table 6-1 Internal load density settings in the energy model Lighting (W/m2) People (m2 per person) Plug and Process (W/m2)
20 9.01
30
77
1.00 0.90 0.80 0.70 0.60 0.50 0.40 0.30 0.20 0.10 0.00
0 6 12 18 0 6 12 18 0 6 12 18 0 6 12 18 0 6 12 18 0 6 12 18 0 6 12 18
Sun
Mon
Tue
Wed
Thu
Fri
Sat
Figure 6-4 One-week sample of the plug-in load schedule used in the energy model
The building is served by AHUs. The terminal units are VAV boxes with reheat. In order to provide a realistic model, the system parameters are calibrated to match the pattern and magnitude of energy consumption with metered data from similar HVAC systems.
Figure 6-6 shows the metered cooling and heating consumption of a building with a similar system type to the simulated building. The metered energy consumption, measured every five minutes, is aggregated into hourly data, and the data is grouped according to outside air dry-bulb temperature. The mean and standard deviation of each temperature interval are plotted in Figure 6-6. The simulated cooling and heating consumption are plotted in Figure 6-7 in the same way. The pattern and magnitude of metered and simulated cooling and heating are to some extent similar. The highest
78
cooling consumption is approximately 90 W/m2, and it decreases steadily as the outside air temperature drops, but relatively more rapidly when the outside air temperature is between 14°C and 18°C. Cooling consumption continues even when the system should be able to utilize free cooling to the fullest extent (when the outside air temperature is below 10°C). The heating consumption steadily decreases as the outside air temperature increases. Heating consumption continues to occur in the summer. In general, the system in the simulation model is configured based on the energy audit and sensor readings from the building commissioning project. The key parameter that has been fine-tuned to match the energy consumption magnitude is the VAV turn-down ratio. Reheating is observed throughout the year in metered data, which indicates an oversized VAV turn-down ratio. As described in Chapter 3, this can be caused by stuck VAV dampers, faulty air flow rate sensors or carbon dioxide concentration sensors, and oversizing during the design stage. The economizer’s settings are also adjusted in the simulation to match the pattern of cooling consumption when the outside air temperature approaches the economizer’s upper and lower temperature limits and the AHU supply air temperature.
79
Means and Standard Deviation by Temperature 90 Cooling Heating
80 70
W/m2
60 50 40 30 20 10 0 -10
0
5
10
30 25 20 15 ° C) Temperature ( Outside air temperature (°C)
35
40
Figure 6-5 Metered cooling and heating consumption of a building with similar system type as the simulated building
80
Means and Standard Deviation by Temperature 90 Cooling Heating
80 70 60
W/m 2
50 40 30 20 10 0 -10
0
5
10
15
20
25
30
35
40
Temperature (°C) (°C) Outside air temperature
Figure 6-6 Simulated cooling and heating by EnergyPlus
Two sets of simulated cooling and heating consumption are generated through EnergyPlus: one set as energy consumption under normal operations, and the other set as energy consumption under faulty operations. These are referred to as the “normal dataset” and the “faulty dataset,” respectively. Both datasets consist of the following variables: •
Outside air dry-bulb temperature of the current hour (°C)
•
Outside air humidity ratio (kg/kg)
•
Electricity consumption of lighting and plug-ins of the current hour (kJ)
•
Electricity consumption of lighting and plug-ins of the previous hour (kJ)
•
Heating consumption of the current hour (kJ).
81
For Gaussian Process training and predicting, weather and electricity consumption are inputs, and cooling and heating consumption are targets. In Chapter 5, the hour of day is used as an indicator of internal load attributed to occupants, lighting and plug-ins for the Gaussian Process prediction. This is because metered hourly electricity consumption is not available in that dataset. Here, electricity consumption of lighting and plug-ins is used directly because it is available in the synthetic dataset and because it can be acquired if electricity meters are properly configured. The heat balance in buildings is not completely steady-state. Weather conditions, internal load, and the state of HVAC systems in the previous hour can affect the cooling and heating consumption of the current hour, especially when there is a sudden change in temperature. Including the electricity consumption of lighting and the plug-ins of the previous hour as inputs for Gaussian Process training and predictions significantly improves the accuracy of heating prediction.
The normal dataset features a model with a VAV turn-down ratio of 0.3. In this study, data from three months of normal operations is used to train a Gaussian Process. In practice, such data could be collected during or after commissioning if steps are taken to ensure that there are no faults in the system. Next, a fault is introduced into the system to generate the faulty dataset. The VAV turndown ratio is increased from 0.3 to 0.6 in three of the twenty VAV terminal boxes to mimic a fault that could be caused by stuck dampers or faulty air flow sensors. This causes a 17% increase in the total minimum air flow rate setting as compared with that under normal operations. 82
The fault detection procedure is shown in Figure 6-8. The simulated data is gathered for nine months when there are faults in system operations. While weather conditions and electricity consumption are fed into the trained Gaussian Process, hourly predictions of cooling or heating consumption are made. The predictions are used as the baseline consumption levels, and these are compared with observed cooling or heating consumption values. The Bayes Classifier described in Equations (6.1) to (6.5) is used to determine whether the hourly energy consumption is excessive. In this study, as shown in Table 6-2, 65% of hourly heating consumption is determined to be faulty.
Figure 6-7 Process of detecting excessive cooling or heating consumption using Gaussian Process
Table 6-2 Percentage of class assignments Normal
In-between
Faulty
7.9%
27.1%
65.0%
83
It is to be expected that some data points are classified as normal. In this case, the fault only affects system operations when the faulty VAV terminal boxes need reheating and cause excessive heating. This is most likely to occur when it is cool or cold outside, and/or if the internal load is low. Figure 6-9 shows the percentage of alarm occurrence for each outside air temperature interval, and Figure 6-10 shows the percentage of alarm occurrence for each hour. More alarms are triggered at night, when the internal load is low, and/or when the outside air temperature is low. This preliminary result can be used for further FDD. The method has also been tested on the nine-month simulated heating consumption of the normal dataset. The false positive rate is found to be 5.6%.
100% 80% 60% 40% 20% 0%
0
5
10 15 20 25 Outside air dry-bulb temperature (°C)
30
Figure 6-8 Percentage of alarm occurrence versus outside air temperature
84
35
100% 80% 60% 40% 20% 0%
1
3
5
7
9
11
13 Hour
15
17
19
21
23
Figure 6-9 Percentage of alarm occurrence versus the hour of day
6.2 Multi-level Fault Detection The case study in Section 6.1 uses the proposed Bayesian FDD method to detect excessive heating on the whole building level.
Excessive whole-building heating
consumption might indicate one or several faults on the system component level. Typical possible faults include (but are not limited to) cooling and heating counteraction in AHUs and excessive reheating in the VAV boxes. As described in Section 3.2, cooling and heating counteraction can be caused by sensor and/or valve malfunction in AHUs. Excessive reheating typically results from an excessive air flow rate due to sensor and/or damper malfunction in the VAV boxes. Heating in AHUs and reheating in VAVs are usually not sub-metered separately. However, faults in AHUs and VAVs can be distinguished more easily if the concept of probabilistic graphical models, yet another machine learning technique, is introduced into fault detection.
85
Fault in VAV
Other factors (weather, load, SAT, RAT)
Airflow rate
Fault in AHU
FVAV
O
Q
Heating
FAHU
H Figure 6-10 Graphical model representation of possible faults that result in excessive heating
The graphical model in Figure 6-11 shows the relationship of two typical types of faults that result in excessive heating consumption. The faults in the VAV boxes cause excessive air flow rate. The faults in the AHUs cause cooling and heating counteraction. Both excessive air flow rate and cooling and heating counteraction eventually cause excessive overall heating consumption. Air flow rate is a function of weather, zone load, AHU supply air temperature (SAT) and zone temperature (return air temperature, RAT). Heating consumption is also a function of weather, zone load, SAT and RAT. Weather, 86
SAT and RAT measurements are typically recorded, and heating consumption is usually metered. Metered electricity and weather data can reflect zone load. If air flow rate is not observed, it is difficult to tell if detected levels of excessive heating consumption are due to faults in the VAVs, faults in the AHUs, or both. If air flow rate is observed, the values of air flow rate along with the other factors shown in Figure 6-11 can be used to determine whether the faults in VAVs that result in excessive air flow rate have occurred. The values of air flow rate, metered heating consumption and other factors shown in Figure 6-11 can be used to detect the faults in AHUs that result in excessive heating consumption. Expressed in the terminology of probabilistic graphical models, when air flow rate is observed, there is no active path between faults in the VAVs and faults in the AHUs, and therefore they are conditionally independent. Bayes Classifiers can be used independently on the VAV level and the AHU level to detect two types of faults.
As shown in Figure 6-11, 𝑂 is used to denote the factors including weather, zone load, AHU supply air temperature and return air temperature, 𝑄 to denote air flow rate, 𝐻 to
denote heating consumption, 𝐹VAV to denote faults in the VAVs, and 𝐹AHU to denote
faults in the AHUs, as shown in the diagram in Figure 6-11. The values of 𝑂, 𝑄 and 𝐻 are continuous. 𝐹VAV and 𝐹AHU have three classes, 𝐹 = 1, 2, 3, which correspond to normal,
in-between and faulty classes, as already shown above in Equation (6.1). The procedure of multi-level fault detection is described as follows. First, measurements of 𝑄 and 𝑂 are
used to train a Gaussian Process, in which measurements of 𝑂 are training inputs and 87
measurements of 𝑄 are training targets. For each new input point 𝑂, the trained Gaussian
Process is used to predict the baseline 𝜇𝑄 (𝑂) and to estimate the uncertainty 𝜎𝑄 (𝑂).
Then, the distributions of air flow rate 𝑄 conditioned on three states of 𝐹VAV and values of 𝑂 can be calculated according to Equations (6.6) to (6.8), 𝑄|𝐹VAV = 1, 𝑂 ~ 𝓝 (𝜇𝑄 (𝑂), 𝜎𝑄2 (𝑂))
(6.6)
𝑄|𝐹VAV = 3, 𝑂 ~ 𝓝 (𝜇𝑄 (𝑂) + 2𝜎𝑄 (𝑂), 𝜎𝑄2 (𝑂))
(6.8)
𝑄|𝐹VAV = 2, 𝑂 ~ 𝓝 (𝜇𝑄 (𝑂) + 𝜎𝑄 (𝑂), 𝜎𝑄2 (𝑂))
(6.7)
Just as in Equations (6.3) and (6.4) above, the mean value of the Gaussian distribution for the in-between class is assigned to be one standard deviation larger than that of the normal class, and two standard deviations larger for the faulty class. Given the observed value of 𝑄, the posterior probabilities of 𝐹VAV = 1, 2,3 can be calculated using Equation (6.9),
𝑃(𝐹VAV = 𝑘|𝑂, 𝑄) =
𝑃(𝑄|𝐹VAV = 3 ∑𝑘=1 𝑃(𝑄|𝐹VAV
𝑘, 𝑂)𝑃(𝐹VAV = 𝑘) = 𝑘, 𝑂)𝑃(𝐹VAV = 𝑘)
(6.9)
Then it is possible to determine whether faults have occurred in the VAVs by picking the class assignment 𝑘 with the highest posterior probability 𝑃(𝐹VAV = 𝑘|𝑂, 𝑄), as shown in Equation (6.10)
𝐹VAV = arg max 𝑃(𝐹VAV = 𝑘|𝑂, 𝑄) 𝑘
(6.10)
Similarly, it is possible to determine whether faults have occurred in the AHUs by using Equations (6.11) to (6.15).
88
𝐻|𝐹AHU = 1, 𝑂, 𝑄 ~ 𝓝 (𝜇𝐻 (𝑂, 𝑄), 𝜎𝐻2 (𝑂, 𝑄))
(6.11)
𝐻|𝐹AHU = 2, 𝑂, 𝑄 ~ 𝓝 (𝜇𝐻 (𝑂, 𝑄) + 𝜎𝐻 (𝑂, 𝑄), 𝜎𝐻2 (𝑂, 𝑄))
(6.12)
𝐻|𝐹AHU = 3, 𝑂, 𝑄 ~ 𝓝 (𝜇𝐻 (𝑂, 𝑄) + 2𝜎𝐻 (𝑂, 𝑄), 𝜎𝐻2 (𝑂, 𝑄))
(6.13)
𝑃(𝐹AHU = 𝑘|𝑂, 𝑄, 𝐻) =
𝑃(𝐻|𝐹AHU = 3 ∑𝑘=1 𝑃(𝐻|𝐹AHU
𝑘, 𝑂, 𝑄)𝑃(𝐹AHU = 𝑘) = 𝑘, 𝑂, 𝑄)𝑃(𝐹AHU = 𝑘)
𝐹AHU = arg max 𝑃(𝐹AHU = 𝑘|𝑂, 𝑄, 𝐻) 𝑘
(6.14)
(6.15)
These procedures are summarized in Figure 6-12. As discussed above, 𝐹VAV and 𝐹AHU are
conditionally independent when 𝑄 is observed, and therefore two Bayes Classifiers can be used independently to determine the class assignment of 𝐹VAV and 𝐹AHU .
89
𝑂, 𝑄 in normal conditions as training data Observed 𝑂
Gaussian Process
𝜇𝑄 𝑂 , 𝜎𝑄 𝑂 Observed 𝑄
Bayes Classifier
𝐹VAV
𝑂, 𝑄, 𝐻 in normal conditions as training data Observed 𝑂, 𝑄
Gaussian Process
𝜇𝐻 𝑂, 𝑄 ,𝜎𝐻 𝑂, 𝑄 Observed 𝐻
Bayes Classifier
𝐹AHU
Figure 6-11 Procedures of multi-level fault detection
The method above is tested on the same energy model in Section 6.1, and system measurements such as air flow rate, supply air temperature and return air temperature are included in the fault detection. Considering the uncertainty typically present in system control, noise is added to the supply air temperature according to the observations described in Chapter 3. The mean value of supply air temperature is 12.5°C, and the standard deviation is 0.2°C. The distribution of supply air temperature is shown in Figure 6-12.
90
25% 20% 15% 10% 5% 0%
11.8
12.0
12.2
12.4 12.6 12.8 Supply air temperature (°C)
13.0
13.2
Figure 6-12 Distribution of supply air temperature in the energy model
Two scenarios were tested and verified. In January, normal system operations were assumed for both scenarios. In February, for the first scenario, faults were only introduced to the VAVs. The faults introduced to the VAVs were the same as those in the case study in Section 6.1. For the second scenario, faults were introduced to both the VAVs and the AHUs. The multi-level fault detection results for these two scenarios are shown in Table 6-3 and Table 6-4. The results of 𝐹VAV class assignments are the same for
both scenarios, while the results of 𝐹AHU class assignments are different. As shown in Table 6-3, 92.9% of the hourly air flow rate is classified as faulty in both scenarios when there are faults in the VAVs. Fault detection was also tested on a normal dataset when no
91
faults were present. The false alarm rate is 11.3%. As shown in Table 6-4, 63.0% of the hourly heating consumption is classified as faulty in scenario two, where faults in the AHUs are present. 20.1% of the hourly heating consumption in scenario one is classified as faulty. Since there are no faults in the AHUs in scenario one, 20.1% is considered a false alarm.
Table 6-3 Percentage of class assignments for 𝐹VAV Normal
In-between
Faulty
2.0%
5.1%
92.9%
Table 6-4 Percentage of class assignments for 𝐹AHU Normal
In-between
Faulty
Scenario 1
63.1%
16.8%
20.1%
Scenario 2
16.0%
21.0%
63.0%
The fault detection on the AHU level is less accurate than that on VAV level, partly because there is a high degree of interpolation uncertainty in baseline predictions. Air flow rate is a key input in heating consumption predictions on the AHU level fault detection. Figure 6-13 shows the histogram of normalized air flow rate in training and testing datasets. Faults in VAVs exist in the testing datasets, but not in the training
92
datasets. Therefore, the air flow rate in the testing dataset is larger than that in the training dataset. As the testing points with large air flow rate are distant from most training points, their prediction uncertainties are large. Compared with the uncertainty magnitude, the amount of heating and cooling counteraction introduced in the simulation is relatively small. Figure 6-14 shows the histogram of the amount of cooling and heating counteraction in the AHUs in the scenario two. Figure 6-15 shows the mean value of standard deviation of heating consumption predictions and the percentage of faulty class assignment in each interval of normalized air flow rate in scenario two. When the prediction uncertainty is large, 𝐹AHU is less likely to be classified as faulty. 500
Training
Testing
Number of points
400 300 200 100 0
0.70
0.75
0.80 0.85 0.90 Normalized air flow rate
0.95
1.00
Figure 6-13 Histogram of normalized air flow rate in training and testing datasets
93
35% 30% 25% 20% 15% 10% 5% 0%
0.0 0.5 1.0 1.5 2.0 2.5 3.0 3.5 4.0 4.5 5.0 Increase in heat consumption due to cooling and heating counteraction in AHUs (W/m2)
Figure 6-14 Histogram of the amount of cooling and heating counteraction in AHUs in scenario two
94
73.3%
Mean value of σ (W/m2)
7.0 6.0
62.8%
60.0%
5.0 42.1%
4.0
34.4%
3.0 2.0
12.5%
1.0 0.0
0.0% 0.70
0.75 Mean value of σ
0.80 0.85 0.90 Normalized air flow rate
0.95
1.00
Percentage of faulty class assignment
Figure 6-15 Uncertainty magnitude and percentage of faulty class assignment versus normalized air flow rate in scenario two
The case study above shows how Gaussian Process regression can serve as a baseline model for multi-level fault detection. Gaussian Process modeling is able to function even when the training dataset is unable to include the entire input domain of the testing dataset, although the rate of false positives or false negatives may be higher in that case.
95
Chapter 7 Conclusion
This dissertation introduces the use of Gaussian Processes to predict the cooling and heating consumption of existing buildings. Gaussian Processes are data-driven models. Unlike physics-based simulations, Gaussian Processes are based on observed system performance, which makes it unnecessary to configure and calibrate numerous parameters that are difficult to estimate and would otherwise be required. Unlike other data-driven models such as Neural Networks, the outputs use mean and variance instead of point estimation to produce predictive distributions. By assuming Gaussian input distributions, parameter uncertainty and parametric variability can be included in the predictions analytically. In contrast to traditional uncertainty analysis approaches, using Gaussian Processes can capture uncertainties in the modeling process in addition to
96
parameter uncertainty and parametric variability. Furthermore, this dissertation has investigated the uncertainty of variables related to system control. Since Gaussian Processes not only produce mean values as an estimate for predictions, but also offer a measure of confidence in those predictions, this additional information could improve baseline predictions in fault detection.
In this dissertation, Gaussian Process regression is used to predict cooling and heating consumption of existing buildings based on historical data. The prediction accuracy of Gaussian Processes is compared to that of Neural Networks. An extension of Gaussian Processes in the future could improve prediction performance. Training Gaussian Processes with noisy input can provide more comprehensive uncertainty interpolation. Using more complicated covariance functions and noise models might improve prediction accuracy. Selecting the right input features and the appropriate size of training datasets is crucial to prediction accuracy. A topic for future research might include identifying the most suitable input features and training size for building energy use prediction.
The impact of the variance in AHU supply air temperature on cooling and heating consumption has been evaluated as a demonstration of how Gaussian Processes may be used to compute parametric variability of system control related variables. In addition to considering AHU supply air temperature, it would be beneficial to study the uncertainty
97
introduced by the non-ideal control of air mixing in AHUs, air flow rate and reheating in VAV terminal units, and their effects on electricity, heating and cooling energy use.
Gaussian Processes are used to predict baselines in fault detection, and a Bayesian classifier is used to detect excessive hourly energy consumption. The proposed method can be expanded to develop more advanced FDD tools. The fault detection results obtained in this study are independent hourly results. Future studies could consider decisions based on hourly results in a specific window of time in addition to the timeseries characteristics of system operations. Furthermore, additional techniques could be introduced into the existing Bayesian FDD method, as illustrated in Figure 7-1. The training datasets used in this research consist solely of observations from normal operations. System measurements from functional performance testing could be included in the training datasets. In functional tests, faulty operations are created to test system response. Since system measurements from faulty operations expand the input domain of the training dataset, the interpolation uncertainty can be reduced and the false negative rate will decrease. The probabilistic graphical model can be expanded to include more relationships among system components, and rule-based methods can be integrated into the current statistical method to improve fault detection accuracy.
98
Normal operations Gaussian Process
Bayes Classifier Expanded PGM Rule-based Method
Functional Test
Fault Detection
Figure 7-1 Possible extension of the proposed fault detection method
In the research presented in this dissertation, an initial step is taken to verify the proposed fault detection method by using synthetic data. Further research is necessary in order to test this method with measured data.
99
Bibliography
Abrahamsen, P. 1997. A review of Gaussian random fields and correlation functions. Norsk Regnesentral/Norwegian Computing Center. Brambley, M.R., and S. Katipamula. 2004. Beyond commissioning. Richland, WA (US): Pacific Northwest National Lab, PNNL-SA-41228. Bruton, K, P. Raftery, N. Aughney, M. Keane, and D. O’Sullivan. 2012. Development of an automated fault detection and diagnosis tool for AHU’s. Paper presented at the Twelfth International Conference for Enhanced Building Operations, Manchester, UK. Claridge, D.E. 1998. A perspective on methods for analysis of measured energy data from commercial buildings. Journal of Solar Energy Engineering 120 (3): 150-155. Cohen, D., and M. Krarti. 1995. A neural network modeling approach applied to energy conservation retrofits. Paper presented at Fourth International Conference on Building Simulation.
100
Crawley, D.B., J.W. Hand, M. Kummert, and B.T. Griffith. 2008. Contrasting the capabilities of building energy performance simulation programs. Building and Environment 43 (4): 661-673. de Wit, S. 2004. Uncertainty in building simulation. In Advanced building simulation., eds. A. M. Malkawi, G. Augenbroe, p25, Taylor & Francis. Diamond, R. C. 2004. An R&D guide and multiyear plan for improving energy use in existing commercial buildings. Lawrence Berkeley National Laboratory: Lawrence Berkeley National Laboratory, LBNL-56173. Dodier, R.H. and Henze, G.P. 2004. Statistical analysis of neural networks as applied to building energy prediction. Journal of Solar Energy Engineering 126: 592. DOE (U.S Department of Energy). 1998. Building commissioning: The key to quality assurance. U.S Department of Energy, DOE/EE--0153. Domínguez-Muñoz, F., J.M. Cejudo-López, and A. Carrillo-Andrés. 2010. Uncertainty in peak cooling load calculations. Energy and Buildings 42 (7): 1010-1018. EIA (U.S. Energy Information Administration). 2012. Annual energy outlook 2012. Washington: U.S. Energy Information Administration Office of Integrated and International Energy Analysis, U.S. Department of Energy, DOE/EIA-0383(2012). Forester, J. 2003. A data model for capturing life-cycle data for re-use during building commissioning. ASHRAE Transaction 109 (1): 655-660. Girard, A., C.E. Rasmussen, J. Quinonero-Candela, and R. Murray-Smith. 2003. Gaussian process priors with uncertain inputs: Application to multiple-step ahead time series forecasting. Paper presented at Neural Information Processing Systems, Vancouver, Canada.
101
Hamby, D.M. 1995. A comparison of sensitivity analysis techniques. Health Physics 68 (2): 195-204. Haves, P., T. Salsbury, D.E. Claridge, and M. Liu. 2001. Use of whole building simulation in on-line performance assessment: Modeling and implementation issues. Paper presented at Seventh International IBPSA Conference Building Simulation, Rio de Janeiro, Brazil. Helton, J.C. 1993. Uncertainty and sensitivity analysis techniques for use in performance assessment for radioactive waste disposal. Reliability Engineering & System Safety 42 (2-3): 327-367. Heo, Y., R. Choudhary, and G.A. Augenbroe. 2012. Calibration of building energy models for retrofit analysis under uncertainty. Energy and Buildings 47: 550-560. Heo, Y. and V.Zavala. 2012. Gaussian process modeling for measurement and verification of building energy savings. Energy and Buildings 53: 7-18
House, J.M., H. Vaezi-Nejad, and J.M. Whitcomb. 2001. An expert rule set for fault detection in air-handling units. ASHRAE Transactions 107(1): 858-874. Hunt, W.D., and G.P. Sullivan. 2002. Assessing the potential for a FEMP operations and maintenance (O&M) program to improve energy efficiency. Pacific Northwest National Laboratory, Richland, WA. PNNL-14076. Kaldorf, S., and P. Gruber. 2002. Practical experiences from developing and implementing an expert system diagnostic tool. ASHRAE Transactions 108(1): 826840.
102
Katipamula, S., and M.R. Brambley. 2005. Review Article: Methods for fault detection, diagnostics, and prognostics for building systems—A review, Part I. HVAC&R Research 11, no. 1: 3-25. Kennedy, M.C., and A. O'Hagan. 2001. Bayesian calibration of computer models. Journal of the Royal Statistical Society: Series B (Statistical Methodology) 63 (3): 425-464. Kissock, J.K., T.A. Reddy, and D.E. Claridge. 1998. Ambient-temperature regression analysis for estimating retrofit savings in commercial buildings. Journal of Solar Energy Engineering 120 : 168. Kleijnen, J.P.C. 1997. Sensitivity analysis and related analyses: A review of some statistical techniques. Journal of Statistical Computation and Simulation 57 (1): 111142. Lauritzen, S.L. 1981. Time series analysis in 1880, a discussion of contributions made by T. N. Thiele. ISI Review 49: 319-333. Liddament, M.W. 1999. Technical synthesis report: Real time simulation of HVAC systems for building optimisation, fault detection and diagnostics . Coventry, the United Kingdom: Air Infiltration and Ventilation Centre (ESSU). Liu, M., and D.E. Claridge. 1998. Use of calibrated HVAC system models to optimize system operation. Journal of Solar Energy Engineering 120: 131. Lomas, K. J., and H. Eppel. 1992. Sensitivity analysis techniques for building thermal simulation programs. Energy and Buildings 19 (1): 21-44. Luskay, L. 2003. Identifying building design information necessary for commissioning and proper system operation. ASHRAE Transactions 109 (1): 639-654.
103
MacKay, D.J.C. 2003. Information theory, inference and learning algorithms. Cambridge University Press. MacKay, D.J.C. 1997. Gaussian Processes-a Replacement for Supervised Neural Networks? McHutchon, A. 2012. NIGP Matlab code. Version 11/07/2012. McHutchon, A, and C.E. Rasmussen. 2011. Gaussian process training with input noise. Paper presented at Twenty-Fifth Annual Conference on Neural Information Processing Systems, Sierra Nevada, Spain. Mills, E., N. Bourassa, M.A. Piette, H. Friedman, T. Haasl, T. Powell, and D.E. Claridge. 2005. The cost-effectiveness of commissioning new and existing commercial buildings: Lessons from 224 buildings. Paper presented at National Conference on Building Commissioning, New York. Morris, M.D. 2006. Input screening: Finding the important model inputs on a budget. Reliability Engineering & System Safety 91 (10-11): 1252-1256. Neal, R.M. 1995. Bayesian Learning for Neural Networks. PhD. Thesis, University of Toronto. O'Hagan, A. 1978. On curve fitting and optimal design for regression. Journal of the Royal Statistical Society, B 40: 1-42. O'Neill, Z., M. Shashanka, X. Pang, P. Bhattacharya, T. Bailey, and P. Haves. 2011. Real time model-based energy diagnostics in buildings. Paper presented at 12th Conference of International Building Performance Simulation Association, Sydney, Australia.
104
PECI (Portland Energy Conservation, INC). 2003. Methods for automated and continuous commissioning of building systems. Air-Conditioning and Refrigeration Technology Institute, ARTI-21CR/610-30040-01. Piette, M.A., S.K. Kinney, and P. Haves. 2001. Analysis of an information monitoring and diagnostic system to improve building operations. Energy & Buildings 33 (8): 783-791. Rasmussen, C.E. 1996. Evaluation of Gaussian Processes and other methods for nonlinear regression. PhD Thesis, University of Toronto. Rasmussen, C.E., and C.K.I. Williams. 2013. GPML Matlab code. Version 3.2. Rasmussen, C.E., and C.K.I. Williams. 2006. Gaussian Processes for machine learning. MIT Press. Saltelli, J. 1990. Non-parametric statistics in sensitivity analysis for model output: A comparison of selected techniques. Reliability Engineering & System Safety 28 (2): 229-253. Skilling, J. 1993. Bayesian numerical analysis. In Physics and Probability, ed. by W. T. Grandy, Jr. and P. Milonni. Cambridge University Press. Stum, K. 2000. Commissioning tools for managing design, construction and implementation. Paper presented at 8th National Conference of Building Commissioning, Kansas City, Missouri. Wang, H.T., Y.M. Chen, C.W.H. Chan, and J.Y. Qin. 2011. A model-based online fault detection method for air handling units of real office buildings. Applied Mechanics and Materials 90: 3061-3067.
105
Westphalen, D., and S. Koszalinski. 1999. Energy Consumption Characteristics of Commercial Building HVAC Systems. Volume II: Thermal Distribution, Auxiliary Equipment, and Ventilation. Arthur D. Little Inc (ADLI) 20: 33745-00. Xiao, F., and S. Wang. 2009. Progress and methodologies of lifecycle commissioning of HVAC systems to enhance building sustainability. Renewable and Sustainable Energy Reviews 13 (5): 1144-1149. Yan, B., A.M. Malkawi, and Y. K. Yi. 2011. Case study of applying different energy use modeling methods to an existing building. Paper presented at 12th Conference of International Building Performance Simulation Association, Sydney, Australia. Yan, B., A.M. Malkawi, Y. Zhang, and J. Xia. 2009. Case study of energy diagnosis simulation of VAV AHU system controls. Paper presented at Eleventh International IBPSA Conference, Glasgow, Scotland. Yang, X., X. Jin, Z. Du, and Y. Zhu. 2011. A novel model-based fault detection method for temperature sensor using fractal correlation dimension. Building and Environment 46, no. 4: 970-979.
106
Index
Bayes classifier, v, 6, 70 Commissioning, 11, 12, 13, 104, 105 Data-driven, 17, 18, 21 Fault detection, v, 6, 14, 15, 16, 19, 71, 72, 83, 87, 90, 91, 92, 95, 98 Functional performance testing, 14 Gaussian Process regression, iv, v, 2, 3, 5, 24, 46, 47, 48, 54, 73, 95 Gaussian Processes, 2, 21, 47, 48, 49, 56, 57, 60, 62, 63, 64, 65, 68, 96, 98, 104, 105 Interpolation uncertainty, 3, 21, 48, 61, 92 Model inadequacy, 20 Observation error, 20, 48, 54, 61 Parameter uncertainty, 19 Parametric variability, 20, 57 Probabilistic graphical models, 6 Residual variability, 20 107
Sensitivity analysis, 1, 23, 102, 105
108