Business Intelligence maturity models (Lahrmann, Marx, Winter, & Wortmann, 2010) and Nikolay ..... assessment; 3= Assessment by certified practitioners).
Politecnico di Torino Porto Institutional Repository [Article] A benchmarking framework for product lifecycle management (PLM) maturity models Original Citation: Enrico Vezzetti, Maria Grazia Violante, Federica Marcolin (2013). A benchmarking framework for product lifecycle management (PLM) maturity models. In: INTERNATIONAL JOURNAL, ADVANCED MANUFACTURING TECHNOLOGY. - ISSN 0268-3768 Availability: This version is available at : http://porto.polito.it/2522090/ since: December 2013 Publisher: Springer Published version: DOI:10.1007/s00170-013-5529-1 Terms of use: This article is made available under terms and conditions applicable to Open Access Policy Article ("Public - All rights reserved") , as described at http://porto.polito.it/terms_and_conditions. html Porto, the institutional repository of the Politecnico di Torino, is provided by the University Library and the IT-Services. The aim is to enable open access to all the world. Please share with us how this access benefits you. Your story matters.
(Article begins on next page)
A benchmarking framework for Product lifecycle management (PLM) maturity models Abstract Product lifecycle management (PLM) is increasingly important for organizations acting in a dynamic and competitive markets since PLM can improve decision-making and reduce costs by taking advantage of the efficiencies and effectiveness coming from improved market intelligence and collaboration of partners. In the last years academics as well as practitioners and consultants have developed a wide range of maturity models for the purpose of measuring and describing certain aspects of PLM “maturity”. The PLM maturity models permit to assess the relative position of companies on their road to complete PLM implementation. However, it is a tough job for the company to select the most appropriate PLM maturity model, as each maturity model has different attributes. Since, to our knowledge, no benchmarking for PLM maturity models exists to date, the rising number of maturity models implicates problems with respect to retrievability and reusability. With the aim to enhance the time consuming and exhausting search and selection process of appropriate assessment models, a benchmarking framework for PLM maturity models is presented in this paper.
Keywords Product lifecycle management (PLM), maturity models, capability maturity model (CMM)
1. Introduction In current industrial production, new, better and increasingly complex products must be introduced to markets more quickly, with more profit and less labour, and the lifecycle of each product must be better controlled from financial and environmental perspectives (Silventoinen, Papinniemi, & Lampela, 2009). The company is unable to react quickly enough to changes that have taken place in the market, in technology, in the supply network, or in customer demands. Furthermore, mistakes or shortcomings that have been perceived in the products or product designs reach the market because the company cannot react to them quickly enough. The slowness of the process means that the company is unable to bring its products to market in rhythm with customers’ wishes, market changes and set timetables, or to collect the greatest possible margin on its products. In this situation, Product Lifecycle Management (PLM) is an essential tool for coping with the challenges of more demanding global competition and ever-shortening product and component lifecycles (Silventoinen et al., 2009). In addition, PLM is the business activity of managing, in the most effective way, company’s products all the way across their lifecycles; from its product design to its disposal. PLM adoption includes very extensive changes in intra- and inter-organizational practices and requires new types of skills and capabilities, and more than that, even large cultural and strategic changes (Kärkkäinen, Pels, & Silventoinen, 2012). How and at what level each company carries out its own Product Lifecycle Management implementation always depends upon the viewpoint. Experience shows that the time and resources needed for the deployment of the system in a company can vary from several months to several years. Naturally, the time varies depending on the size of the company, the approach taken to the project, and the chosen system (for example a standard software package vs. tailoring). A good tool for understanding and describing the current AS-IS situation can be for example a PLM maturity model. One of the best practical applications of the maturity models can be to determine the maturity or readiness of a large international corporation for a corporate-wide PLM
development program. PLM maturity models, often at least partly based on the thinking of CMM (Capability Maturity Modelling) originally used in software process facilitation, can be used to make the implementation of better-approachable PLM and a more carefully planned and coordinated process. This is done, for example, by evaluating the current status of PLM progress, by benchmarking the progress of PLM implementation between companies, by helping companies to establish their own PLM strategies and goals, as well as by helping them to choose the next steps on improving their PLM infrastructure and practices (R Batenburg, Helms, & Versendaal, 2006; Kärkkäinen et al., 2012; Pels & Simons, 2008; Saaksvuori & Immonen, 2008). Different ways to approach the PLM maturity assessment have been developed with various purposes. To illustrate these available maturity model approaches we have realized a “benchmarking framework” with the aim to map the main elements of PLM models and compare the features and qualities of current PLM maturity frameworks.
2. Maturity models In an organization, the PLM implementation is a very extensive change process which cannot be carried out in a single step, but should be divided and managed in a series of smaller stages. It requires various changes not only at the IT systems level, but often also at the strategic level, and at the process level, and further, at the level of reward and incentive systems and individual persons’ skills and capabilities (Kärkkäinen, Myllärniemi, Okkonen, & Silventoinen, 2009). Key challenge in any implementation process can be seen via organizational readiness, say maturity, to change the way it operates (Kärkkäinen et al., 2009). Maturity thus implies an evolutionary progress in the demonstration of a specific ability or in the accomplishment of a target from an initial to a desired or normally occurring end stage (Fraser, Moultrie, & Gregory, 2002). In general, the idea of maturity is presented by sketching a number of growth stages that depict the potential-upward development or performance of organizations during several sequential periods of time (Ronald Batenburg & Versendaal, 2008). Some major indicators of the organization’s improved maturity are related to predictability, control and effectiveness (Mark C Paulk, Weber, Curtis, & CHRISSIS, 1995). First, as maturity increases, the differences between targeted and actual results decrease across projects, which indicates an improved predictability (Mark C Paulk et al., 1995). Second, the variability of actual results around targeted results decreases along the maturity increase, indicating increased control (Mark C Paulk et al., 1995). Third, in overall, the targeted results improve as the maturity of the organization increases, indicating improved effectiveness (Mark C Paulk et al., 1995). Thus, the overall maturity indicators and individual maturity dimensions of PLM should reflect the above three indicators in the context of PLM maturity (Mark C Paulk et al., 1995). According to Mettler, all maturity models share the common property of defining a number of dimensions at several stages of maturity, with a description of characteristic performance at various levels of granularity (Mettler, 2011). Basic components of maturity models are: (1) a number of levels (typically three to six), (2) a descriptor for each level, (3) a generic description or summary of the features of each level as a whole, (4) a number of dimensions, (5) a number of elements or activities for each dimension, and (6) a description of each element or activity as it might be performed at each level of maturity (Fraser et al., 2002). The research of Wendler (Wendler, 2012) shows a wide set of application domains when talking about maturity models. The application field is heavily dominated by the software development (Jiang, Klein, Hwang, Huang, & Hung, 2004; Oshana & Linger, 1999; M. Paulk, 1993; Mark C. Paulk, 2001; Subramanian, Jiang, & Klein, 2007), software improvement process (Bilotta & McGrew, 1998; Dekleva & Drehmer, 1997; Fauzi et al., 2009; Hansen, Rose, & Tjørnehøj, 2004; Niazi, Wilson, & Zowghi, 2005; Saiedian & Chennupati, 1999; Sun & Liu, 2010; TWAITES & SIBILLA, 2002) because the dissemination and success of maturity models emerged out of the software industry. Other examples of application domains are the Governmental (Andersen & Henriksen, 2006; Davison, Wagner, & Ma, 2005; Gottschalk, 2008, 2009; Gottschalk & Tolloczko,
2007), public sector (Pullen, 2007), public security (Gottschalk & Tolloczko, 2007), safety culture (Andrade & Marinho, 2010; Fleming, 2001; Hudson, 2001), medical sector (Fitterer & Rohner, 2010; Mc Caffery & Coleman, 2007; van de Wetering & Batenburg, 2009; Williams, 2008), education (Aytes & Beachboard, 2007; Drinka & Yen, 2008), project management (Bahli, 2004; Cooke‐Davies, 2004; Crawford, 2006; Grant & Pennypacker, 2006; Hillson, 2003; Jugdev & Thomas, 2002; Kwak & Ibbs, 2000; Lee & Anderson, 2006; Mullaly, 2006; Pullen, 2007), supply chain management (Lahti, Shamsuzzoha, & Helo, 2009; Lockamy III & McCormack, 2004; Mortensen, Freytag, & Arlbjørn, 2008; Oliveira, McCormack, & Trkman, 2012; Plomp & Batenburg, 2010; Trkman, Ladeira, De Oliveira, & McCormack, 2012), Enterprise resource planning (ERP) systems (Harigopal & Satyadas, 2001; Holland et al., 2000; Lester, Wilkie, McFall, & Ware, 2009; Nightingale & Mize, 2002; Parthasarathy & Ramachandran, 2008), and knowledge management (Gallagher & Hazlett, 2000; Hsieh, Lin, & Lin, 2009; Khatibian & Jafari, 2010; Klimko, 2001; Kruger & Snyman, 2005; Paulzen & Perc, 2002; Pee & Kankanhalli, 2009). However, until today the development and application of maturity models was spread out to nearly any conceivable domain. Some examples of very specialized application domains are innovation activities (Berg, Pihlajamaa, Poskela, & Smedlund, 2006), mechanical design (Egan, Ritchie, & Gardiner, 2005), consulting services (Simon, Schoeman, & Sohal, 2010), construction processes (Davis & Walker, 2009; Hutchinson & Finnemore, 1999; Jeong, Kagioglou, Haigh, Amaratunga, & Siriwardena, 2006; Sarshar et al., 2000).
2.1. Maturity models history Within the field of information systems, the Nolan model is often quoted as the origin of the maturity perspective (Rocha, 2011). After a research into the use of IST in large United States organizations, Richard Nolan proposed an evolutionary model initially containing four stages of maturity (Nolan, 1973). He later added one and then two more stages to the initial model (R. L. Nolan, 1975; Richard L Nolan, 1982; Richard L. Nolan, 1982). Simultaneously, Crosby in 1979 proposed his so called quality management process maturity grid, which categorized best practices along five maturity stages and six measurement categories (Crosby, 1979). As for information systems planning, Earl’s model of learning curves with respect to IT can be considered as one the first examples IT-specific extensions to Nolan’s model (Earl, 1989)). Since then, both the original Nolan and Earl models have been revised, extended, specified and modified, in line with progress made in the field of information systems and software engineering (Ronald Batenburg & Versendaal, 2008; Galliers & Sutherland, 1991; Rocha, 2011). The revised “stages of growth” model by Galliers and Sutherland (1991) is meant to overcome some of the limitations by introducing a means of bringing together a range of key elements associated with the operation and management of an organization generally (Fraser et al., 2002; Galliers & Sutherland, 1991). The revised model of Galliers and Sutherland (1991) can be represented as six stages, each with its particular set of conditions associated with the seven “S” elements. The seven elements are strategy, structure, systems, staff, style, skills, and superordinate goals. The six stages of the revised model are: ad hocracy, foundations, centralized dictatorship, democratic dialectic and cooperation, entrepreneurial opportunity, and integrated harmonious relationships (Fraser et al., 2002). After 1990’s, other models have been proposed, including a new model of Nolan with nine maturity stages justified by the progress that has occurred in the area of IST and management methods (Mutsaers, van der Zee, & Giertz, 1998; R. Nolan & Koot, 1992; Rocha, 2011). In this latter case, an example is the model with nine maturity stages, which combines the stages theory with critical success factors (Khandelwal & Ferguson, 1999). When talking about maturity models, most people first think of Capability Maturity Model Integration (CMMI) that has become an established model in the field of information systems development (Fraser et al., 2002). The first version of CMMI model was the Capability Maturity Model (CMM) published in 1989 by Watts Humphrey, and later by the Software Engineering
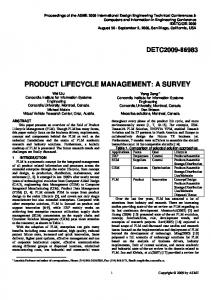
Institute (SEI) at Carnegie Mellon. By January of 2013, the entire CMMI product suite was transferred from the SEI to the CMMI Institute, a newly created organization at Carnegie Mellon (Fraser et al., 2002). It is composed of five maturity levels (Initial, Repeatable, Defined, Managed, Optimized). With the exception of Level 1, each maturity level is composed of several key process areas that identify a cluster of related activities that, when performed collectively, achieve a set of goals considered important for establishing process capability at that maturity level (Fig. 1). Each key process area is organized into five sections called common features. The common features specify the key practices that, when collectively addressed, accomplish the goals of the key process area. It is designed to measure, monitor and evaluate the professional development and engineering of software and many related domains such as IT-governance, project management, people management with the assumption that the higher the level, the more mature and the higher the performance of an organization (Ronald Batenburg & Versendaal, 2008).
Figure 1 –The Capability Maturity Model with associated Key Process Areas According to the Wendler, CMMI is the only ‘‘standard’’ maturity model really noticed within the academic community. Other models developed by standardizing organizations or interest groups like ISO 9000, SPICE, the OMG’s Business Process Maturity Model, or CobiT’s Maturity Model have been rarely addressed in research contributions (Wendler, 2012). The ISO 9000 series of standards is specified by the International Organization for Standardization (ISO) and establishes an effective quality system for manufacturing and service industries; ISO 9001, one of the ISO 9000
series of standards, deals specifically with software development and maintenance. SPICE (Software Process Improvement and Capability dEtermination) is an international framework for assessment of software processes developed jointly by the ISO (International Organization for Standardization) and the IEC (International Electrotechnical Commission). SPICE is specified in ISO/IEC 15504. OMG’s Business Process Maturity Model: Object Management Group (OMG) is an international, not-for-profit collaborative industry consortium that develops and maintains several key specifications used in BPM (Business Process Maturity) tools (Kärkkäinen et al., 2009). COBIT (Control Objectives for Information and related Technology) framework was published by the IT Governance Institute and the Information Systems Audit and Control Association (ISACA). It was designed to help implement governance and control over technology processes and systems and to allow managers to bridge the gap between control requirements, technical issues and business risks (Silventoinen et al., 2009). CMMI is mostly used within the area of model application and within case studies (Dangle, Larsen, Shaw, & Zelkowitz, 2005; Oshana & Linger, 1999), as a measurement tool within empirical studies (Bilotta & McGrew, 1998; Dooley, Subra, & Anderson, 2001), or as a reference for comparisons and mapping (Ferreira, Machado, & Paulk, 2011; Mills, Braun, & Marohl, 2002). Moreover, it has a great influence on other newly developed maturity models adapting the structure (Heck, Klabbers, & van Eekelen, 2010) and/or transferring the content of CMMI to other research domains (Bahli, 2004; Martin, Hatzakis, Lycett, & Macredie, 2005; Vadapalli & Nazareth, 1998).
3. Maturity Models in the PLM domain When a company is planning to deploy PLM or to implement a PLM system, maturity assessment is one of the main themes to be considered by the company. With a maturity model, the company readiness to develop, implement or extend the use of PLM is measured (Silventoinen et al., 2009). Assessing an organization’s readiness for PLM requires assessment of all the elements of PLM: technology, not only enabling technology, but its infrastructure, processes, people and practices (Silventoinen et al., 2009). This assessment needs to be done using a systematic and understandable framework that compares where we are now (called “AS–IS situation”) and where we need to be in the future (named “TO BE situation”) (Silventoinen et al., 2009). PLM-related research is relatively young. In the literature there can be found different maturity modelling approaches that are directly or at least quite closely related to the important aspects of PLM implementation. Concerning the maturity levels, the carried out literature study reveals that one relatively commonly used maturity assessment procedure in PLM context is based on CMM /CMMI (capability maturity model) whose origin is in software maturity evaluation. With this approach the maturity is supposed to develop through a set of maturity levels, which can be measured along a set of maturity dimensions. Other maturity models approaches are the PLMIG model, RACE, and the most widely academically studied Batenburg model (Pels & Simons, 2008; Silventoinen et al., 2009). After 1990 product development capabilities came in the picture and the need rose to assess and compare product development processes. One of the most widely accepted methods is the Readiness for Concurrent Engineering (RACE) assessment. An interesting lesson from this research is that the highest maturity level is not necessarily the optimal maturity level. The highest level is only optimal for the development of complex products in mature technology. For the development of highly innovative products with novel technologies working at the lowest level might be much more effective. On basis of RACE the RapidPDM project (Dunne, 2001) developed a methodology and tool to assess the readiness of a product development organisation to adopt Product Data Management (Pels & Simons, 2008). However, this assessment was not intended to compare organisations, but to assess what PDM functionalities and practices would be most effective for the business drivers of a particular company (Pels & Simons, 2008).
3.1 Batenburg proposal
The Batenburg PLM framework is designed to assess the PLM achievements of individual companies or business units of a company (R Batenburg et al., 2006). In such an assessment the PLM maturity for each individual business dimension is determined. The Batenburg maturity model applies four maturity levels: Ad hoc (where there is no vision available for PLM and there are no consistent PLM processes and supporting systems), Departmental (where PLM is seen as data management problem that should be dealt with on departmental level that starts to implement PLM systems), Organizational (where PLM is interpreted as a business problem that requires a corporate vision and an integral approach and PLM systems are integrated with other major enterprise systems, such as ERP) and Inter-organizational (where PLM is seen as a business problem that spans the complete product lifecycle and PLM systems are integrated with those of the suppliers to enable collaboration) on five business dimensions: Strategy& Policy, Monitoring & Control, Organisation&Processes, People&Culture and Information Technology (R Batenburg et al., 2006; Kärkkäinen et al., 2012). The PLM framework developed by Batenburg has been applied to define a PLM roadmap for individual companies. The PLM roadmap process phases include: (a) Current PLM maturity and alignment, (b) Benchmark maturity, (c) Desired PLM maturity and alignment, (d) Identify items to be improved, (e) Define PLM roadmap.
3.2 Saaksvuori and Immonen proposal The roadmap process is one of the tools that companies, especially SMEs, could use in their PLM implementation project covering parts of the readiness & design and the implementation preparation phase. The idea of the PLM maturity model by Saaksvuori and Immonen refers to the generic maturity model CMM combined with the COBIT framework (Saaksvuori & Immonen). The Saaksvuori and Immonen model describes, on a rough level, how a company and its management team can develop and extend the use of a corporate-wide PLM concept and related processes and information systems. The origin of the model lies in the idea of phases or stages, which a company usually goes through as it adapts to new cultural issues, processes, management practices, business concepts, and modes of operation. These stages represent the organizational growth, learning, and development that occur as new methods implemented in large corporations (R Batenburg et al., 2006; Saaksvuori & Immonen; Silventoinen et al., 2009). The framework of Saaksvuori and Immonen identifies five stages: Unstructured (where there are no defined approaches concerning lifecycle management; all lifecycle and product management issues are resolved by individuals on a case-by-case basis ), Repeatable but intuitive (where Lifecycle and product management processes have left to individuals, there is not any formal development, definition, training, or communication of standard processes), Defined (where the PLM processes or basic PLM concepts are not best-ofthe-breed, nor are they uniform throughout the corporation, however they are formalized), Managed and measurable (where PLM processes and concepts are under constant improvement and provide best practices) and Optimal (PLM processes and concepts have been refined to the level of best practice, based on continuous improvement and benchmarking with other organizations) (R Batenburg et al., 2006; Saaksvuori & Immonen; Silventoinen et al., 2009).
3.3 Stark proposal Another contribution is by Stark who defined a maturity model for Product Data Management (PDM), which is an important component of PLM (Stark, 2011). The model is composed of six maturity stages: Traditional, Archipelago of PLM Islands, Frontier-crossing PLM, Enterprise-wide, Patchwork and Enterprise-wide, Enterprise-deep. For each of these stages he described particular features from three different viewpoints: the company, the product development process and PDM. He also developed a questionnaire based on this model on basis of which a company can be assessed with respect to PDM maturity. The assessment is used to determine the current situation of a company. The known current situation in an organisation can define a future situation that is maturity stage and develop a strategy on how to achieve that. According to Stark, the PLM
implementation approach that a company develops will depend to some extent on how far the company has evolved through the six levels (Stark, 2011). The targeted future situation and the activities that a company at level 1 needs to carry out, for example, will not be the same as those for a company at level 3. However, the process for moving forward does not depend on a company’s level of evolution. It is a generic five-step process applicable at each level that is: (1) understand the current (as-is) situation, (2) understand the desired future (to-be) situation, (3) develop an Implementation Strategy to go from the current to the future situation, (4) develop detailed implementation plans corresponding to the Implementation Strategy and (5) implement the plans.
3.4 Schuh proposal The central point of framework proposed by Schuh consists of a set of lifecycle oriented business process reference models which links the necessary fundamental concepts, enterprise knowledge and software solutions to effectively deploy PLM (Schuh, Rozenfeld, Assmus, & Zancul, 2008; Silventoinen et al., 2009). Schuh et al. have implemented a framework that comprehends seven maturity elements of PLM: the PLM definition (that provides the boundaries within which the reference models are detailed); the PLM foundation (based on the specification of the fundamental concepts for the PLM implementation); the set of process reference models (that vary according to a group of features of a company, i.e. sector, size, order type..., which coherently define typical industrial enterprises); the vendor neutral software description (that lists the software requirements needed to support process activities); the PLM software support (that identify the profiles of specific software solutions); the knowledge base (that supplies the necessary material to support training); the PLM benefits (like reducing time-to-market, improving product functionality and increasing ability of customizing resulting from changes within the company’s processes after PLM implementation) (Schuh et al., 2008; Silventoinen et al., 2009). Schuh et al. have proposed a PLM process oriented framework that can be applied to guide PLM implementation at the industry (Schuh et al., 2008). Companies aiming to implement PLM can refer to the provided conceptual framework to establish their own framework, linking the company elements in a comprehensive PLM environment (Schuh et al., 2008; Silventoinen et al., 2009). Therefore, the following ten steps are necessary. (a) Define the goal of the PLM implementation: according to the PLM definition companies can identify the most important points to focus on. (b) Analyze the existent PLM foundation: the ability of the current product structure to support PLM must be analyzed and if necessary enhanced. (c) Rank processes: the processes to be implemented can be selected from the PLM process list, considering company's aims and expected benefits. (d) Identify company maturity level (as-is process): comprehends the mapping of company current processes (only for the previously selected processes). (e) Select an appropriate reference model: from the provided set of reference models it is possible to identify the process type that best suits company's features. (f) Customize reference model: although processes that target different kinds of company are available, processes must still be refined to reflect very specific business needs. The customized processes picture the to-be PLM scenario. (g) Specify requirements for system selection: the vendor neutral software requirement catalogue related to the already configured processes provides the system specification. (h) Select software solution: based on previously defined requirements and considering detailed software profiles. (i) Define the evolution path and implement software solution: the differences between the asis and to-be processes allow the definition of implementation roadmaps, including the necessary implementation of the selected software solution.
(j) Teach employees: the knowledge base connection to the processes indicates the new necessary qualification and provide the necessary training material and context.
3.5 Kärkkäinen proposal The previous PLM maturity models do not adequately consider the aspect of customer orientation and customer needs. According to Kärkkäinen et al.(Kärkkäinen et al., 2012) and Silventoinen et al.(Silventoinen et al., 2009), PLM implementation affects closely the customers’ operation and brings changes to customers’ processes. So for these authors, the advancement in the PLM maturity stages should take better into consideration the development of the customers’ PLM maturity stage, as well. This indicates a strong motivation to evaluate and enhance the customer-orientation in both the generic PLM context and in the context of PLM maturity modelling (Kärkkäinen et al., 2012). Kärkkäinen et al. introduce a novel PLM maturity dimension that we consider as an important addition to current PLM maturity models. They define the maturity of customer dimension, and they provide preliminary maturity level descriptions for this dimension. In the level descriptions of maturity in customer dimension they discern the following main levels, namely Chaotic, Conscientious, Managed, Advanced and Integration stages, and distinguish some major themes that are essential in the maturity descriptions: (a) level of proactivity (company’s capability of understanding the future in the sense of customer dimension), (b) extent of coordination (extensiveness of intra- and inter-organizational systems in the customer respect), (c) extent of integration (level of integration that the company can do between customer knowledge and related organizational processes and ICT tools as well as between different product lifecycle phases), and (d) quality and type of customer knowledge (variety and richness of customer knowledge (explicit/ tacit, structured/unstructured, etc.) that the company is able to gather and transfer to all necessary persons).
3.6 Terzi S. proposal In 2012 Terzi S. defines a model of assessment for the new product development process that provides a snapshot of the company in order to offer a starting point for further analysis and the definition of a strategy for improvement in its processes of engineering and innovation (Frigerio, Rossi, & Terzi, 2012). The proposed model identifies three aspects of investigation: Organization, Process and Knowledge Management, divided into nine sub-areas totals. The model elaborates the five levels of maturity usually defined in the literature, identified by the acronym Climb: Chaos (initial level of maturity: the new product development process is usually unstructured and chaotic and the organization usually does not have a stable development environment), Low (the organization defines the objective time that the new product development process should pursue, so the projects developed by the organization ensure that the requirements are fulfilled and the process is planned, executed, measured and monitored), Intermediate (when all objectives defined for the Low level of maturity are respected adding the objective of budget; at this point the process SNP is usually well structured within the organization), Mature (an organization has achieved all the objectives defined for the previous levels and in addition all sub-processes that contribute to performance and the creation of value for the S new product development process are defined), Best Practice (an organization has achieved all the objectives defined for the previous levels ―level 2, 3 and 4― and the process improves continuously through analysis of variance on the results; the continuous improvement of the results of the process is achieved through incremental and innovative maneuvers of the technologies used).
3.7 Outline of the paper The previous studies demonstrate that, even though the topic of maturity modelling has been shown to be a useful approach in facilitating PLM implementation in many ways, it is still partly in initial stages in defining PLM maturity and in implementing a “standard" PLM maturity model. In fact maturity models are a new concept in the field of PLM implementation. They are not under a
standard and they have different frameworks and serve to the companies as scale for the appraisal of their position on the evolution path. The maturity model is a supportive tool to assess the as-is situation of a company, derive and prioritize improvements measures and subsequently control the progress of their implementation. It offers criteria and features that need to be fulfilled to reach a particular maturity level. During a maturity appraisal, a snap-shot of the organization regarding the given criteria is made. Based on the results of the as-is analysis, recommendations for improvement measures can be derived and prioritized in order to reach higher maturity levels. Comparing the models can help the organizations in selecting and utilizing suitable maturity model, the researchers in the development of new ones, potential users or model developers to better understand the concepts behind the selected maturity models. Our research in the literature has found that very few comparisons between maturity models have been carried out till now and these are too fragmentary, hardly usable by a novice user who wants to implement a PLM maturity model in his/her enterprise. In literature we have found a gap in the development of frameworks for comparison and classification of PLM maturity models: a preliminary study can be found in the Silventoin et al. study (Silventoinen et al., 2009). In other contexts, very detailed comparative frameworks have been created such as the framework for information system maturity models proposed by Mettler et al. (Mettler, 2009) and that for e-business and e-commerce maturity models proposed by Jones et al (Jones et al.). Our benchmarking framework permits to highlight the strengths and weaknesses of the existing PLM maturity models and to develop a set of guidelines to support or as a starting point for the development of a PLM maturity model more sharable within the industrial field.
4. Methodology: Design of the benchmarking framework In order to design an assessment of the maturity models in the PLM domain, the first step has been to select some models for comparison. In this regards we have decided to focus on the recent and well-known PLM maturity models for which a detailed documentation is available. Some models have been excluded from the comparison since they are the precursors of more recent models (as for example Starks, 2005) or since they are based on other existing models (as for example the frameworks of Pels and Simons (Pels & Simons, 2008) and Silventoinen (Silventoinen et al., 2009) that are related to the Batenburg model). The second step has been to select the variables for comparing maturity models with each other. To structure the benchmarking framework we have considered different elements taking in account and the cue from the dimensions of Mettler’s classification system (Mettler, 2009) and Fraser’s studies (Fraser et al., 2002) and adapting them to the PLM context. In literature we have found that the classification system proposed by Mettler was used by Lahrmann et al. for the classification of Business Intelligence maturity models (Lahrmann, Marx, Winter, & Wortmann, 2010) and Nikolay Petrachkov for E-business Maturity Models (Petrachkov, 2012). The benchmarking framework consists of three parts: the first one considers the general model attributes; in the second part there are the attributes relating to the design of the model and in the last one there are the attributes concerning the application of the model. The general model attributes are used to describe the basic features of a maturity model (table 1). The purpose of these selected attributes is to provide users as well as model developers a first overview of the maturity model relating to its name, source, the year of publication, description of business dimensions, the maturity levels and the generality of the sample that has tested the application of the maturity model (for some models we have not found this information from the literature, so we have supposed that the model was not tested). Table 1 - General maturity model attributes Attribute Category
Description
Sub category
Name Primary source
Name of the maturity model References are cited the author's surname
Origin
Academic or practice
Year of publication
The publication date of the maturity model
Business Dimensions
Maturity levels
One idea of maturity models is to enable balanced development in different areas concerned. In the PLM model, the most significant areas are identified as the dimensions of the model A maturity level represents a new level of organizational capability achieved by the transformation of one or more domains of an organization’s process.
Testing
If the maturity model was tested in the industrial context
Number of questions
It specifies the number of questions for each business dimensions
Guidelines for the PLM implementation
Some maturity models specify some guidelines for the PLM implementation
-Number of Business Dimensions
-Number of maturity levels -Further themes identified in the maturity levels (where existent) Total number of respondents or sample (indicates the total number of industry that have tested the maturity model) Basic features of the participants’ organizations (specify the type and the number of industry that have tested the maturity model)
Attributes relating to the design of the model. All models are characterized by meta-model or model schema such as a defined number of dimensions or process areas at several discrete stages or levels of maturity, with a description of characteristic performance at various levels of granularity (table 2). These attributes, such as concept of maturity (the focus of the maturity model), composition (refers to its design), mutability (refers to change in the maturity model due to improvement in technologies, and development of new best practices), give details on the structure and the form of the maturity model (Mettler, 2009). Table 2 – Maturity model design attributes
Attribute Category
Attribute Name
Concept of maturity
Process maturity
Object maturity
People capability
Customer dimension
Composition of the maturity model
Maturity grids
Likert-like questionnaires
CMM-like models
Mutability
Form
Functioning
Description to which extent a specific process is explicitly defined, managed, measured, controlled, and effective to which extent a particular object like a software product, a company report or similar reaches a predefined level of sophistication to which extent the workforce is able to enable knowledge creation and enhance proficiency if the aspect of the customer orientation and customer needs is considered in the maturity model illustrates a number of levels of maturity in a simple, textual manner (normally not exceeding a few pages of text) are comparable with maturity grids, but the focus is more inclined on to scoring specific statements of “good practice” and not to describing the overall levels of maturity are based upon a more formal architecture, specifying a number of goals and key practices to reach a predefined level of sophistication, are the most complicated, because a number of different scales might be used refers to the meta-model or model schema of the maturity model, the descriptions of maturity levels or dimensions refers to the functionality of the model e.g. how maturity is assessed, the scoring method
Attributes concerning the application and use of the model are attributes such as method of application (refers to the usage of the model for the purposes of assessment (how data is collected to assess the maturity of a specific domain is an important criterion for the selection of a model), support of application (refers to the provision of the materials on usage of the maturity model), and practicality of evidence (refers to the type of recommendation that can be derived from application of the maturity model) (table 3) (Mettler, 2009). Table 3 – Maturity model use attributes
Attribute Category
Attribute Name Self-assessment
Method of application
Third-party assisted assessment Assessment by certified practitioners
Support of application
Description the model can be developed to use by the company itself the model can be developed to use for the assessment of the company by a third-party the model can be developed for usage by the certified practitioner (like CMMI).
No supporting materials Textual description or handbook Software assessment tool Implicit improvement activities
Practicality of evidence Explicit recommendations
i.e. a general recommendation on the tacit assumption of the predefined goals or maturity levels i.e. telling exactly what to do in order to enhance a particular activity, process or skill
5. Validation After having specified the attributes of PLM maturity model, we have validated the selected PLM maturity models. With data that we have found in literature, we have filled the tables relating to the general attributes (table 4), the design attributes (table 5) and use attributes (table 6).
Table 4 - General maturity model attributes
Attribute Category Name Primary source Origin Year of publication
Model Batenburg PLM framework for the assessment and guidance of PLM implementations. (R Batenburg et al., 2006) Academic
Schuh
Saaksvuori
Stark
Terzi
(Stark, 2011) Consultant
Karkkainen Defining the Customer Dimension of PLM Maturity (Kärkkäinen et al., 2012) Academic
Process oriented framework to support PLM implementation
Product Lifecycle Management
Product Lifecycle Management
(Schuh et al., 2008) Academic
(Saaksvuori & Immonen) Academic
2006
2008
2004
2011
2012
2012
Benchmarking dei Processi di Sviluppo Prodotto (Frigerio et al., 2012) Academic
1. Process 2. Structures 3. IT systems 4. PLM strategy 5. People in PLM change management
1. Company 2. Product development 3. PDM
1 Strategy & Policy 2 Management & Control 3 Organization & Processes 4 People & Culture 5 Information Technology 6 Customer orientation
1 Organization 1.1 Work Organization 1.2 Roles and coordination 1.3 Skills and Competences 2 Process 2.1 Process Management 2.2 Activities and value 2.3 Decision Making Factors 2.4 Methods 3 Knowledge Management 3.1 Computerization 3.2 Formalization
7 Primary
5 Primary
3 Primary
6 Primary
3 Primary 9 Secondary
Maturity levels
I Ad Hoc II Departmental III Organizational IV Inter-organizational
/
I Unstructured II Repeatable but intuitive III Defined IV Managed and measurable V Optimal
I. Traditional II Archipelago of PLM Islands III Frontiercrossing PLM IV Enterprise Wide V Patchwork VI Enterprise Wide Enterprise Deep
I Chaotic II Conscientious III Managed IV Advance V Integration
I Chaos II Low III Intermediate IV Mature V Best Practice
Further themes in the maturity levels
/
/
/
/
Number of maturity levels
4 Primary
/
5 Primary
6 Primary
Guidelines for the PLM implementation
(a) Current PLM maturity and alignment, (b) Benchmark maturity, (c) Desired PLM maturity and alignment, (d) Identify items to be improved, (e) Define PLM roadmap.
/
a. define the goal of the PLM implementation, b. Analyze the existent PLM foundation, c. Rank processes, d. Identify company maturity level (as-is process), e. Select an appropriate reference model,
a. understand the current (as-is) situation, b. understand the desired future (tobe) situation, c. develop an Implementation Strategy to go from the current to the
Business Dimensions
Number of Business Dimensions
1 Strategy & Policy 2 Management & Control 3 Organization & Processes 4 People & Culture 5 Information technology
5 Primary
1.PLM definition 2.PLM foundation 3. the set of process reference models 4. vendor neutral software description 5 PLM software support 6. PLM knowledge base 7. PLM benefits
a. Level of proactivity; b. Extent of coordination; c. Extent of integration, d. Quality and type of customer knowledge; 5 Primary 3 Secondary
/
5 Primary
Testing of the maturity model Number of questions Total number of respondents (sample)
Basic features of the participants’ organizations (Type and Number of industry respondents)
f. Customize reference model, g. Specify requirements for system selection, h. Select software solution, i. Define the evolution path and implement software solution, j. Teach employees.
future situation, d. develop detailed implementation plans corresponding to the Implementation Strategy; e. implement the plans.
yes
not available
not available
not available
not available
yes
40
/
/
/
/
42
23
/
/
/
/
25
Medium size (15-1,000 employees) - Equipment and transport companies (3) - ICT solution providers (1) - Product software companies (6) - Financial services (1)
mid-size companies (15-1,000 employees) -industrial machinery (5) -Fashion (3) /
/
/
/
large (>1000 employes) -Aerospace (3) - Home appliances (3) -Defence (4) -Automotive (3) -Electronics (4)
Large size (Over 1,000 employees) - Equipment and transport companies (5) - ICT solution providers (5) - Product software companies (1) - Financial services (1)
Table 5 – Maturity model design attributes Attribute Category
Concept of maturity
Composition Mutability
Attribute Name Process Object People Customer Maturity grid Likert-like questionnaire CMM-like Form
Batenburg
Schuh
Model Saaksvuori
Karkkainen
Terzi
Stark
Functioning
Table 6 – Maturity model use attributes Attribute Category
Method of application
Support of application Practicality of evidence
Attribute Name Self-assessment Third-party assisted assessment Assessment by certified practitioners No supporting materials Textual description or handbook Software assessment tool Implicit improvement activities Explicit recommendations
Batenburg
Schuh
Model Saaksvuori Stark
Karkkainen
Terzi
6. Results In order to get an overview about the maturity models in PLM domain, we have grouped the attributes into five aggregated categories: (1) Detail level, (2) Testing, (3) Effectiveness, (4) Application, (5) Addressed domain (table 7). Then, the relative weight of each attribute was defined according to the type of the attribute. Table 7 – Aggregated categories Detail level
Testing
Effectiveness
Application
Addressed domain
Business dimensions and their number
Basic features of the participants’ organizations (Type and Number of industry respondents)
Practicality of evidence
Support of application
Concept of maturity
Number of questions
Guidelines for the PLM implementation
Method of application
Maturity levels and their number Further themes in the maturity levels Composition
Mutability
For example the aggregate category named “Detail Level” groups attributes such as “Business dimensions and their number”, “Maturity levels and their number”, “Further themes in the maturity levels” and “Composition” (Table 8). Then, for the attributes “Business dimensions and their number”, “Maturity levels and their number” and “Further themes in the maturity levels” we have assigned a value considering the information obtained by the maturity models for those attributes. So in these cases, we have inserted the number of business dimensions, the number of maturity levels, the number of further themes related to every model. For example, for the Batenbug model, the number of “Business dimension” is 5 (see table 4), so this number is assigned as relative weight in table 8. The maximum weight assigned to the “Business dimensions and their number” is 9 because it is the max number among 5 =Batenburg, 7 =Schuh, 5= Saaksvuori, 3= Stark, 6 = Karkkainen, 9 =Terzi. For the attribute “Composition” we have assigned a weight (from 1 to 3) on the basis of the complexity of the type of composition (so 1 is the assigned weight to Maturity grid; 2 is the assigned weight to Likert-like questionnaire and 3 is the assigned weight to CMM-like). Table 8 – “Detail Level”: attributes and weights Max weigh
Attribute
Batenburg Schuh Saaksvuori Stark Karkkainen Terzi
9
Business dimensions and their number
5
7
5
3
6
9
8
Maturity levels and their number
4
0
5
6
8
5
4
Further themes in the maturity levels
0
0
0
0
4
0
3
Composition
2
1
1
2
2
2
Using the radar plot (fig. 2) it is possible to visualize the final score of the aggregate category “Detail Level” for each maturity model. In this case for each model the values shown in the radar have been obtained by normalizing the previous values (see table 8) by the maximum weight of each attribute. Detail Level
Batenburg 1,00 0,90 0,80 0,70 0,60 Terzi
Schuh
0,50 0,40 0,30 0,20
Business dimensions and their number Maturity levels and their number Further themes in the maturity levels Composition
0,10 0,00
Karkkainen
Saaksvuori
Stark
Figure 2 – Results of “Detail Level” for each maturity model The aggregate category named “Testing” groups attributes such as “Number of questions”, “Total number of respondents” (Table 9). Then, for the attributes “Number of questions” and “Total number of respondents” we have assigned a value considering the information obtained by the maturity models for those attributes. So in these cases, we have inserted the number of questions and the total number of respondents related to every model. Table 9 –“Testing”: attributes and weights Max weigh Attribute 42 25
Number of questions Total number of respondents
Batenburg
Schuh
Saaksvuori Stark Karkkainen Terzi
40
0
0
0
0
42
23
0
0
0
0
25
Using the radar plot (fig. 3) it is possible to visualize the final score of the aggregate category “Testing” for each maturity model. In this case for each model the values shown in the radar have obtained by normalizing the previous values (see table 9) by the maximum weight of each attribute.
Testing
Batenburg 1,00 0,90 0,80 0,70 0,60 Terzi
Schuh
0,50 0,40 0,30 0,20 0,10
Number of questions Total number of respondents
0,00
Karkkainen
Saaksvuori
Stark
Figure 3 –Results of “Testing” for each maturity model The aggregate category named “Effectiveness” groups attributes such as “Practicality of evidence”, “Guidelines for the PLM implementation” (Table 10). For the attribute “Practicality of evidence” we have assigned a weight on the basis of the type of recommendation specified by the maturity model (1= only Implicit improvement activities or Explicit recommendations; 2= both). For the attribute “Guidelines for the PLM implementation” we have inserted the number of guidelines related to each model. Table 10 –“Effectiveness”: attributes and weights Max weigh Attribute
Batenburg Schuh Saaksvuori Stark Karkkainen Terzi
2
Practicality of evidence
1
1
1
1
1
1
10
Guidelines for the PLM implementation
5
0
10
5
0
0
Using the radar plot (fig. 4) it is possible to visualize the final score of the aggregate category “Effectiveness” for each maturity model. In this case for each model the values shown in the radar have obtained by normalizing the previous values (see table 10) by the maximum weight of each attribute.
Effectiveness
Batenburg 1,00 0,90 0,80 0,70 0,60 Terzi
0,50
Schuh
0,40 0,30 0,20 0,10 Practicality of evidence Guidelines for the PLM implementation
0,00
Karkkainen
Saaksvuori
Stark
Figure 4 –Results of “Effectiveness” for each maturity model The aggregate category named “Application” groups attributes such as “Support of application”, “Method of application” and “Mutability” (Table 11). For the attribute “Support of application” we have assigned a weight on the basis of the type of support specified by the maturity model for its usage (1= No supporting materials; 2= Textual description or handbook; 3= Software assessment tool). For the attribute “Method of application” we have assigned a weight on the basis of the way of assessment specified by the maturity model (1= Self-assessment; 2= Third-party assisted assessment; 3= Assessment by certified practitioners). For the attribute “Mutability”, we have assigned a weight on the basis of type of description defined by the maturity model (1= only Form; 2= Both Form and Functioning). Table 11 –“Application”: attributes and weights Max weight 3 3 2
Attribute Batenburg Schuh Saaksvuori Stark Karkkainen Terzi Support of application 3 1 1 1 1 1 Method of application 1 1 1 1 1 1 Mutability 2 1 1 1 1 2
Using the radar plot (fig. 5) it is possible to visualize the final score of the aggregate category “Application” for each maturity model. In this case for each model the values shown in the radar have obtained by normalizing the previous values (see table 11) by the maximum weight of each attribute.
Application
Batenburg 1,00 0,90 0,80 0,70 0,60 Terzi
Schuh
0,50 0,40 0,30 0,20 0,10
Support of application Method of application Mutability
0,00
Karkkainen
Saaksvuori
Stark
Figure 5 –Results of “Application” for each maturity model The aggregate category named “Addressed domain” groups the attribute “Concept of maturity” (Table 12). For this attribute we have assigned a weight on the basis of the type of topic assessed by the maturity model (1= one domain among process, object, people or customer; 2= two domains among process, object, people or customer; 3= three domains among process, object, people or customer, 4= all domains). Table 12 - “Addressed domain”: attributes and weights Max Weight 4
Batenburg Concept of maturity
3
Schuh 3
Saaksvuori
Stark
Karkkainen
Terzi
3
3
4
4
Using the radar plot (fig. 6) it is possible to visualize the final score of the aggregate category “Addressed domain” for each maturity model. In this case for each model the values shown in the radar have obtained by normalizing the previous values (see table 12) by the maximum weight of each attribute.
Addressed Domain
Batenburg 1,00 0,90 0,80 0,70 0,60 Terzi
Schuh
0,50 0,40 0,30 0,20 0,10 0,00
Concept of maturity
Karkkainen
Saaksvuori
Stark
Figure 6 –Results of “Addressed domain” for each maturity model In order to compare all the maturity models we have reported two benchmarks: the first one is a detailed benchmarking that compares the models according to the aggregated categories and the second one compares the models. In the first case we have reported the final score of each aggregate category for each maturity model (fig. 7). In the second one for each model we have computed the total score obtained by the sum of final scores of each category by attributing the same importance to each factor (fig. 8). In fact, the survey administered to some maturity models users showed that in our case there are not aggregate categories more important than others. So it has been therefore reasonable to assign the same weight to each category (Table 13). Table 13 –Benchmarking of the PLM maturity models Batenburg
Schuh
Saaksvuori
Stark
Karkkainen
Terzi
Detail level Testing Effectiveness Application Addressed domain
1,72 1,87 1,00 2,33 0,75
1,11 0,00 0,50 1,17 0,75
1,51 0,00 1,50 1,17 0,75
1,75 0,00 1,00 1,17 0,75
3,33 0,00 0,50 1,17 1,00
2,29 2,00 0,50 1,67 1,00
total score
7,67
3,53
4,93
4,67
6,00
7,46
Detailed Benchmarking Batenburg 3,50 3,00 2,50 2,00 Terzi
Schuh 1,50 1,00 Detail level Testing Effectiveness Application Addressed domain
0,50 0,00
Karkkainen
Saaksvuori
Stark
Figure 7 – “Detailed Benchmarking” of the PLM maturity model Benchmarking Batenburg 25,00%
20,00%
15,00% Terzi
Schuh 10,00%
5,00%
0,00%
Karkkainen
total score
Saaksvuori
Stark
Figure 8 – Benchmarking of the PLM maturity models It has been possibly noted that for each model one or more aggregated attributes are more important than others. For instance for the maturity model of Batenburg, all aggregated attributes have
obtained high results, while models such as Schuh, Saaksvuori, Stark and Karkkainen have the aggregated attribute “testing” with a low result. Looking at the analysed maturity models, it turned out that the majority of them rely on a conceptual design (see aggregated attribute “testing” of Figs. 3 and 7). Although a conceptual development is often appropriate, demonstrating the usefulness of the developed model is inevitable. However, in line with the results obtained by Wendler (Wendler, 2012), the aggregated attribute “testing” of Figs. 3 and 7 illustrates that empirical validation or other proof methods are rarely used within a conceptual design. In fact, none of the Schuh, Saaksvuori, Stark and Karkkainen maturity models were validated. When new maturity models are developed, it is normally not sufficient to construct them in terms of content and structure. To ensure their applicability and benefits, they have to be tested, for instance, by proof of concept or by real life applications. The results of these tests or evaluations may have influence on the model again. This ‘‘logical’’ procedure could be a useful contribution to guide researchers in their actions. In our case an example is given by the Karkkainen model where we have obtained high results of “Detail Level” demonstrating the high quality of its construct in terms of structure (see results of detail level in fig. 2) and the absence of its validation (see results of “Testing” in fig. 3). Another important component of the maturity models refers to the measured objects, the capabilities, like conditions, processes, organizational units or application targets. Maturity models that refer to only one capability are called one-dimensional. In our case all PLM maturity models are multidimensional (see the results of the “Addressed domain” in fig. 6 and 7). From the benchmarking of figure 8, it is possible to see the total score obtained by each model. It can be seen that the models proposed by Batemburg and Terzi result to be the most complete models from every front, while Saaksvuori, Stark and Karkkainen have almost obtained the same results. In these models, to test their applicability and search for improvements, an ongoing validation may be an added value and it may take place while using the maturity models in real environments.
Conclusions The main objective of using PLM Maturity Assessment is to make the implementation of PLM better approachable and a more carefully planned process. Therefore, companies have more difficulty in relating to their position in PLM selection. Of the many studies on maturity models in IS context and on the PLM, in general, found in literature, only few discuss maturity or road mapping approaches in the context of PLM. In order to solve this problem, we have proposed a benchmarking framework for PLM maturity models taking into account the general model attributes relating to the basic features of the model, such as name, origin, year of the publication, the maturity model design attributes (relating to the construction and organisation of the model) and the maturity model use attributes, such as application method or tool support. In doing so, we expect to reach the following prospective effects: (1) the enhancing of the retrievability and reusability by simply listing the basic features of the maturity models: in this way they will be precisely described, making them communicable, and therefore retrievable and reusable, (2) the reduction of the time spent for searching specific maturity models, (3) the facilitation to take decisions concerning the make or buy of a maturity model, (4) the identification of the similarities and differences between the multiple models, (5) the development of a new maturity model that integrates similar models in a common model base. The need for and the development of new maturity models will certainly not diminish in the future, given that these models help managers to balance divergent objectives with regard to obtaining and retaining competitive advantage, assembling new products and services, reducing costs and time to market, and enhancing quality. However, the development of a “standard model” can reduce the problems implicating by a rising number of maturity models. Nevertheless, we are aware that the proposed features can be extensively enhanced since this study is limited in that it was exclusively constructed by means of reviewing literature and web resources. At the moment the value of the proposed classification system is that it could be an useful tool to systematise the search and selection process of the most appropriate PLM maturity model. This study may deliver a good starting point when looking for existing PLM maturity models. Its added value may increase, if the classification structure is integrated, for example, in a generic methodology for the development of new maturity models. From the results of our benchmarking, it is possible to note that the models of Batemburg and Terzi result to be the most complete models from every front. By applying and validating these models, their authors have to ensure the applicability and benefits of their models. These tests or evaluations have influenced positively the results of the benchmarking.
References Andersen, K. V., & Henriksen, H. Z. (2006). E-government maturity models: Extension of the Layne and Lee model. Government Information Quarterly, 23(2), 236-248. Andrade, J. C. S., & Marinho, M. M. d. O. (2010). A safety culture maturity model for petrochemical companies in Brazil. Safety Science, 48(5), 615-624. Aytes, K., & Beachboard, J. (2007). Using the information orientation maturity model to increase the effectiveness of the core MBA IS course. Journal of Information Technology Education, 6, 371-385. Bahli, B. (2004). Toward a capability maturity model for the management of outsourcing information services. Batenburg, R., Helms, R., & Versendaal, J. (2006). PLM roadmap: stepwise PLM implementation based on the concepts of maturity and alignment. International Journal of Product Lifecycle Management, 1(4), 333-351. Batenburg, R., & Versendaal, J. (2008). Maturity matters: Performance determinants of the procurement business function. Paper presented at the Proceedings of the 16th European Conference on Information Systems. Galway, Ireland. Berg, P., Pihlajamaa, J., Poskela, J., & Smedlund, A. (2006). Benchmarking of quality and maturity of innovation activities in a networked environment. International Journal of Technology Management, 33(2), 255-278. Bilotta, J. G., & McGrew, J. F. (1998). A Guttman scaling of CMM level 2 practices: Investigating the implementation sequences underlying software engineering maturity. Empirical Software Engineering, 3(2), 159-177. Cooke‐Davies, T. (2004). Project management maturity models. The Wiley guide to managing projects, 1234-1255. Crawford, J. K. (2006). The project management maturity model. Information Systems Management, 23(4), 50-58. Crosby, P. B. (1979). Quality is free: The art of making quality certain (Vol. 94): McGraw-Hill New York. Dangle, K. C., Larsen, P., Shaw, M., & Zelkowitz, M. V. (2005). Software process improvement in small organizations: a case study. Software, IEEE, 22(6), 68-75. Davis, P., & Walker, D. (2009). Building capability in construction projects: a relationship-based approach. Engineering, Construction and Architectural Management, 16(5), 475-489. Davison, R. M., Wagner, C., & Ma, L. C. (2005). From government to e-government: a transition model. Information Technology & People, 18(3), 280-299. Dekleva, S., & Drehmer, D. (1997). Measuring software engineering evolution: A Rasch calibration. Information Systems Research, 8(1), 95-104. Dooley, K., Subra, A., & Anderson, J. (2001). Maturity and its impact on new product development project performance. Research in Engineering Design, 13(1), 23-29. Drinka, D., & Yen, M. Y.-M. (2008). Controlling Curriculum Redesign with a Process Improvement Model. Journal of Information Systems Education, 19(3), 331-342. Dunne, K. (2001). PDM implementation methodology. RapidPDM consortium (ESPRIT Project 26892) Documented implementation methodology, including implementation planning model, D72-D73. Earl, M. J. (1989). Management strategies for information technology: Prentice-Hall, Inc. Egan, I., Ritchie, J., & Gardiner, P. (2005). Measuring performance change in the mechanical design process arena. Proceedings of the Institution of Mechanical Engineers, Part B: Journal of Engineering Manufacture, 219(12), 851-863. Fauzi, S. S. M., Nasir, M., Nuraminah, R., Jusoff, K., Azam, N. A. A., & Ismail, M. H. (2009). The Implementation of Software Process Improvement Models. International Review on Computers and Software (I. RE. CO. S.), 4(3).
Ferreira, A. L., Machado, R. J., & Paulk, M. C. (2011). Supporting audits and assessments in multimodel environments Product-Focused Software Process Improvement (pp. 73-87): Springer Berlin Heidelberg. Fitterer, R., & Rohner, P. (2010). Towards assessing the networkability of health care providers: a maturity model approach. Information Systems and E-Business Management, 8(3), 309-333. Fleming, M. (2001). Safety culture maturity model. Fraser, P., Moultrie, J., & Gregory, M. (2002). The use of maturity models/grids as a tool in assessing product development capability. Paper presented at the Engineering Management Conference, 2002. IEMC'02. 2002 IEEE International. Frigerio, G., Rossi, M., & Terzi, S. (2012). SVILUPPO NUOVO PRODOTTO-Benchmarking dei processi di Sviluppo Prodotto. Sistemi e Impresa(3), 40. Gallagher, S., & Hazlett, S.-A. (2000). Using the knowledge management maturity model (KM3) as an evaluation tool. Paper presented at the Conference on Knowledge Management Concepts and Controversies. Galliers, R., & Sutherland, A. (1991). Information systems management and strategy formulation: the ‘stages of growth’model revisited. Information Systems Journal, 1(2), 89-114. Gottschalk, P. (2008). Maturity model for email communication in knowledge organizations: The case of police investigations. International journal of law, crime and justice, 36(1), 54-66. Gottschalk, P. (2009). Maturity levels for interoperability in digital government. Government Information Quarterly, 26(1), 75-81. Gottschalk, P., & Tolloczko, P. C. (2007). Maturity model for mapping crime in law enforcement. Electronic Government, An International Journal, 4(1), 59-67. Grant, K. P., & Pennypacker, J. S. (2006). Project management maturity: an assessment of project management capabilities among and between selected industries. Engineering Management, IEEE Transactions on, 53(1), 59-68. Hansen, B., Rose, J., & Tjørnehøj, G. (2004). Prescription, description, reflection: the shape of the software process improvement field. International Journal of Information Management, 24(6), 457-472. Harigopal, U., & Satyadas, A. (2001). Cognizant enterprise maturity model (CEMM). Systems, Man, and Cybernetics, Part C: Applications and Reviews, IEEE Transactions on, 31(4), 449-459. Heck, P., Klabbers, M., & van Eekelen, M. (2010). A software product certification model. Software Quality Journal, 18(1), 37-55. Hillson, D. (2003). Assessing organisational project management capability. Journal of Facilities Management, 2(3), 298-311. Holland, C. P., Light, B., Beck, P., Berdugo, Y., Millar, R., Press, N., & Setlavad, M. (2000). An international analysis of the maturity of enterprise resource planning (ERP) systems use. Hsieh, P. J., Lin, B., & Lin, C. (2009). The construction and application of knowledge navigator model (KNM™): An evaluation of knowledge management maturity. Expert Systems with Applications, 36(2), 4087-4100. Hudson, P. (2001). Aviation safety culture. Paper presented at the Safeskies Conference, Canberra, Australia. Hutchinson, A., & Finnemore, M. (1999). Standardized process improvement for construction enterprises. Total Quality Management, 10(4-5), 576-583. Jeong, K. S., Kagioglou, M., Haigh, R., Amaratunga, D., & Siriwardena, M. L. (2006). Embedding good practice sharing within process improvement. Engineering, Construction and Architectural Management, 13(1), 62-81. Jiang, J. J., Klein, G., Hwang, H.-G., Huang, J., & Hung, S.-Y. (2004). An exploration of the relationship between software development process maturity and project performance. Information & Management, 41(3), 279-288.
Jugdev, K., & Thomas, J. (2002). Project management maturity models: The silver bullets of competitive advantage. Project Management Journal, 33(4), 4-14. Kärkkäinen, H., Myllärniemi, J., Okkonen, J., & Silventoinen, A. (2009). Assessing maturity requirements for implementing and using product lifecycle management. Paper presented at the The 9th International Conference on Electronic Business, Macau. Kärkkäinen, H., Pels, H., & Silventoinen, A. (2012). Defining the Customer Dimension of PLM Maturity. In L. Rivest, A. Bouras & B. Louhichi (Eds.), Product Lifecycle Management. Towards Knowledge-Rich Enterprises (Vol. 388, pp. 623-634): Springer Berlin Heidelberg. Khandelwal, V. K., & Ferguson, J. R. (1999). Critical success factors (CSFs) and the growth of IT in selected geographic regions. Paper presented at the System Sciences, 1999. HICSS-32. Proceedings of the 32nd Annual Hawaii International Conference on. Khatibian, N., & Jafari, H. A. (2010). Measurement of knowledge management maturity level within organizations. Business Strategy Series, 11(1), 54-70. Klimko, G. (2001). Knowledge management and maturity models: Building common understanding. Paper presented at the Proceedings of the 2nd European Conference on Knowledge Management. Kruger, C., & Snyman, M. M. M. (2005). Formulation of a strategic knowledge management maturity model. SA Journal of Information Management, 7(2). Kwak, Y. H., & Ibbs, C. W. (2000). Calculating project management's return on investment. Project Management Journal, 31(2), 38-47. Lahrmann, G., Marx, F., Winter, R., & Wortmann, F. (2010). Business intelligence maturity models: an overview. Paper presented at the VII conference of the Italian chapter of AIS (itAIS 2010). Italian chapter of AIS, Naples. Lahti, M., Shamsuzzoha, A., & Helo, P. (2009). Developing a maturity model for Supply Chain Management. International Journal of Logistics Systems and Management, 5(6), 654-678. Lee, L. S., & Anderson, R. M. (2006). An exploratory investigation of the antecedents of the IT project management capability. e-Service Journal, 5(1), 27-42. Lester, N., Wilkie, F., McFall, D., & Ware, M. (2009). Investigating the role of CMMI with expanding company size for small‐to medium‐sized enterprises. Software Process: Improvement and Practice. Lockamy III, A., & McCormack, K. (2004). The development of a supply chain management process maturity model using the concepts of business process orientation. Supply Chain Management: An International Journal, 9(4), 272-278. Martin, V. A., Hatzakis, T., Lycett, M., & Macredie, R. (2005). Cultivating knowledge sharing through the relationship management maturity model. Learning Organization, The, 12(4), 340-354. Mc Caffery, F., & Coleman, G. (2007). The need for a software process improvement model for the Medical Device Industry. Mettler, T. (2009). A design science research perspective on maturity models in information systems. Universität St. Gallen, St. Gallen, Switzerland, Technical Report BE IWI/HNE/03. Mettler, T. (2011). Maturity assessment models: a design science research approach. International Journal of Society Systems Science, 3(1), 81-98. Mills, P., Braun, L., & Marohl, D. (2002). COMPARISON OF EPA'S QMS TO SEI'S CMMI SM. Quality Assurance: Good Practice, Regulation, and Law, 9(3-4), 165-171. Mortensen, M. H., Freytag, P. V., & Arlbjørn, J. S. (2008). Attractiveness in supply chains: a process and matureness perspective. International Journal of Physical Distribution & Logistics Management, 38(10), 799-815. Mullaly, M. (2006). Longitudinal analysis of project management maturity. Project Management Journal, 37(3), 62. Mutsaers, E.-J., van der Zee, H., & Giertz, H. (1998). The evolution of information technology. Information Management & Computer Security, 6(3), 115-126.
Niazi, M., Wilson, D., & Zowghi, D. (2005). A maturity model for the implementation of software process improvement: an empirical study. Journal of Systems and Software, 74(2), 155-172. Nightingale, D. J., & Mize, J. H. (2002). Development of a lean enterprise transformation maturity model. Information, Knowledge, Systems Management, 3(1), 15-30. Nolan, R., & Koot, W. (1992). Nolan Stages Theory Today: A framework for senior and IT management to manage information technology. Holland Management Review, 31, 1-24. Nolan, R. L. (1975). Thoughts about the fifth stage. SIGMIS Database, 7(2), 4-10. doi: 10.1145/1017570.1017571 Nolan, R. L. (1982). Managing the crises in data processing: Reprint Service, Harvard business review. Nolan, R. L. (1982). Managing the Data Resource Function: West Publishing Co. Oliveira, M. P. V. d., McCormack, K., & Trkman, P. (2012). Business analytics in supply chains– The contingent effect of business process maturity. Expert Systems with Applications, 39(5), 5488-5498. Oshana, R. S., & Linger, R. C. (1999). Capability maturity model software development using cleanroom software engineering principles-results of an industry project. Paper presented at the System Sciences, 1999. HICSS-32. Proceedings of the 32nd Annual Hawaii International Conference on. Parthasarathy, S., & Ramachandran, M. (2008). Requirements engineering method and maturity model for ERP projects. International Journal of Enterprise Information Systems (IJEIS), 4(4), 1-14. Paulk, M. (1993). Capability maturity model for software: Wiley Online Library. Paulk, M. C. (2001). Extreme programming from a CMM perspective. Software, IEEE, 18(6), 1926. Paulk, M. C., Weber, C. V., Curtis, B., & CHRISSIS, M. (1995). The capability maturity model: Guidelines for improving the software process (Vol. 441): Addison-wesley Reading, MA. Paulzen, O., & Perc, P. (2002). A maturity model for quality improvement in knowledge management. Paper presented at the Enabling Organisations and Society through Information Systems, Proceedings of the 13th Australasian Conference on Information Systems (ACIS 2002). Pee, L., & Kankanhalli, A. (2009). A model of organisational knowledge management maturity based on people, process, and technology. Journal of Information & Knowledge Management, 8(02), 79-99. Pels, H. J., & Simons, K. (2008). PLM maturity assessment. Paper presented at the ICE 2008 The 14th International Conference on Concurrent Enterprising: Concurrent Innovation: a New Wave of Innovation in Collabarative Networks, Lisbon, Portugal, June. Petrachkov, N. (2012). Development of a Situational Maturity Model for E-business. Plomp, M. G., & Batenburg, R. S. (2010). Measuring chain digitisation maturity: An assessment of Dutch retail branches. Supply Chain Management: An International Journal, 15(3), 227237. Pullen, W. (2007). A public sector HPT maturity model. Performance Improvement, 46(4), 9-15. Rocha, Á. (2011). Evolution of Information Systems and Technologies Maturity in Healthcare. International Journal of Healthcare Information Systems and Informatics (IJHISI), 6(2), 2836. Saaksvuori, A., & Immonen, A. Product lifecycle management. 2004: Springer, Berlin. Saaksvuori, A., & Immonen, A. (2008). Understanding the product lifecycle. Product Lifecycle Management, 191-206. Saiedian, H., & Chennupati, K. (1999). Towards an evaluative framework for software process improvement models. Journal of Systems and Software, 47(2), 139-148.
Sarshar, M., Haigh, R., Finnemore, M., Aouad, G., Barrett, P., Baldry, D., & Sexton, M. (2000). SPICE: a business process diagnostics tool for construction projects. Engineering Construction and Architectural Management, 7(3), 241-250. Schuh, G., Rozenfeld, H., Assmus, D., & Zancul, E. (2008). Process oriented framework to support PLM implementation. Computers in industry, 59(2–3), 210-218. doi: http://dx.doi.org/10.1016/j.compind.2007.06.015 Silventoinen, A., Papinniemi, J., & Lampela, H. (2009, 06/2009). A Roadmap for Product Lifecycle Management Implementation in SMEs. Paper presented at the The XX ISPIM Conference Simon, A., Schoeman, P., & Sohal, A. S. (2010). Prioritised best practices in a ratified Consulting Services Maturity Model for ERP consulting. Journal of Enterprise Information Management, 23(1), 100-124. Stark, J. (2011). Product Lifecycle Management Product Lifecycle Management (pp. 1-16): Springer London. Subramanian, G. H., Jiang, J. J., & Klein, G. (2007). Software quality and IS project performance improvements from software development process maturity and IS implementation strategies. Journal of Systems and Software, 80(4), 616-627. Sun, Y., & Liu, X. F. (2010). Business-oriented software process improvement based on CMMI using QFD. Information and software technology, 52(1), 79-91. Trkman, P., Ladeira, M. B., De Oliveira, M. P. V., & McCormack, K. (2012). Business Analytics, Process Maturity and Supply Chain Performance. Paper presented at the Business Process Management Workshops. TWAITES, G., & SIBILLA, M. L. (2002). Software engineering in an SEI level-5 organization. International Journal of Reliability, Quality and Safety Engineering, 9(04), 347-365. Vadapalli, A., & Nazareth, D. (1998). Software Reuse Management: Development of a Model in the Context of the Capability Maturity Model. van de Wetering, R., & Batenburg, R. (2009). A PACS maturity model: a systematic meta-analytic review on maturation and evolvability of PACS in the hospital enterprise. International Journal of Medical Informatics, 78(2), 127-140. Wendler, R. (2012). The maturity of maturity model research: A systematic mapping study. Information and software technology, 54(12), 1317-1339. doi: http://dx.doi.org/10.1016/j.infsof.2012.07.007 Williams, P. (2008). A practical application of CMM to medical security capability. Information Management & Computer Security, 16(1), 58-73.