Differently, in case of yield crisis, it is possible to enable the diagnosis ..... CALL. Classification Routine. Search in the HT space for the considered fault .... Embedded High Density SRAM, IEEE International Test Conference, 1998, pp. 1112- ...
A BIST-based Solution for the Diagnosis of Embedded Memories Adopting Image Processing Techniques D. Appello, A. Fudoli, V. Tancorre STMicroelectronics Cornaredo, Italy
P. Bernardi, F. Corno, M. Rebaudengo, M. Sonza Reorda Politecnico di Torino Dipartimento di Automatica e Informatica Torino, Italy
Abstract This paper proposes a new solution for the diagnosis of faults into embedded RAMs, currently under evaluation within STMicroelectronics. The proposed scheme uses dedicated circuitry embedded in a BIST wrapper, and an ATE test program to schedule the data extraction flow and to analyze the gathered information. Testing is performed exploiting a standard IEEE 1149.1 TAP, which allows the access to multiple memory cores with a P1500 compliant solution. The approach aims at implementing a low-cost solution to diagnose embedded RAMs with the goal to minimize the ATE costs and the time required to extract the diagnostic information. In our approach, the ATE drives the diagnostic scheme and performs the classification of faults, allowing the adoption of low-cost equipments. The proposed solution allows a scalable extraction of test data, whose amount is proportional to the available testing time. In order to accelerate fault classification, image processing techniques have been applied. The Hough transform has been adopted to analyze the bitmap representing the faulty cells. Experimental results show the advantages of the proposed approach in terms of time required to complete the diagnostic process.
1. Introduction The market demand for highly integrated solutions in a single chip is constantly growing. Today very deep sub-micron (VDSM) technologies allow the integration on a single chip of entire systems (Systems-on-a-Chip, or SOC). These devices typically embed unstructured logic blocks (micro-cores, DSP-cores, glue logic), a large spectrum of analog functions blocks, and memories. As far as memories are concerned the following points are worth to be underlined: •
the percentage of area of the SOC occupied by memories is growing
•
memories are usually the densest circuitry implemented, and therefore the most critical in terms of defectiveness. These two facts pushed researchers to develop solutions able to reduce the impact of defectiveness
introducing new techniques in order to improve the yield [1-11], possibly exploiting some redundancy repair capabilities, also.
1
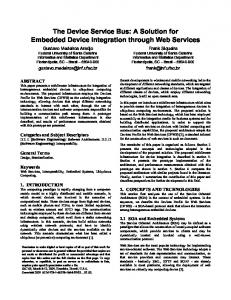
Nevertheless, also to facilitate the effectiveness of repair, the overall defect level should be kept under control, and therefore requires the ability to deeply analyze the root cause of failures. This process typically requires a physical failure analysis (FA) on the parts. Despite the growth in the complexity of performing FA on VDSM technologies, FA of memories is simpler than analyzing unstructured logic because fault localization is theoretically possible. This means that, at least, the search space of the defect on the silicon can be restricted to a limited area, based on the deterministic information provided by analysis of the circuit behavior when a test sequence is applied. There are other important factors limiting the effectiveness of failure analysis. FA is by nature a costly activity, and also requires a significant amount of time to be completed. Therefore, to optimize the overall process, the importance of focusing first on the most relevant sources of failures is essential. The use of statistical tools, applied over large databases of information usually helps. To follow this approach, the efficient combination of several factors is required; such as exploiting data coming from a massively produced memory, collecting relevant data, keeping under control testing time and, more in general, keeping under control the cost of test. The solution described in this paper aims at satisfying the requirements of the manufacturing and of the engineering phase. These steps of the device development and manufacturing flow are sensible to testing time and test data volume. Testing time directly affects the test costs also reducing the overall efficiency of the manufacturing environment. Test data volume determines two major drawbacks. The first one concerns some more test time overhead, due to transfer of large amount of data, if the full bitmap is extracted, and its management within the manufacturing environment. Furthermore, any extracted bitmap requires a post-processing with oriented tools, in order to achieve the desired fault classification. Referring to the typical yield trend shown in Fig. 1, we will point out how our technique applies well especially during product yield crisis, i.e., the period during the engineering phase when the yield presents anomalous low figures. Our solution is compatible with a go-no-go test approach, which can be adopted when the yield is acceptable, giving up to an efficient testing time and to a reduced test data volume. Differently, in case of yield crisis, it is possible to enable the diagnosis approach allowing on-chip fault classification capabilities. This will determine some penalty from the point-of view of testing time, but since the reasonable increase of test data volume, allows a fast analysis of the fault population.
2
Yield
Continuous Improvement
Stability
100% Fab Base Line
Crisis
Time Figure 1: Yield behavior during the engineering phase.
Traditionally, the test of memories (both stand-alone and embedded) has been performed using dedicated hardware available on the ATE. This normally requires some DFT, allowing the direct access from the chip boundary to the embedded memory relevant signals. Test application is normally performed using dedicated HW/SW ATE options, usually able of generating in an algorithmic way the test stimuli and responses. One of the advantages of external testing is the ability of the ATE to collect all (or most) of the failure information, and then, to allow reconstructing their topological location (bitmap). Despite the fact that analyzing fail bit-maps is a powerful way for the advanced diagnosis of memories, its usage presents also some drawback: the size of bit-maps extracted from ATE is difficulty manageable in a manufacturing environment (for collection and analysis), testing time and test cost can become relevant issues. External test of memories is nowadays being replaced by BIST for many different reasons. Consequently, diagnosis must cope with this scenario. In our previous work [2] it has been pointed out how BIST can be used for memory diagnosis through some design for diagnosis effort. This paper focuses on two main aspects: the partitioning of diagnosis resources between the device and the ATE, and the problem of fault classification. We are facing the latter issue by exploiting some techniques inherited from image processing, such as the adaptive Hough transform [13-14]. The main advantage of the Hough transform technique is that it is tolerant to gaps in boundary descriptions and is relatively unaffected by image noise. The goal is to extract from the test manufacturing flow relevant data, allowing analyzing the failure population and individuating the most relevant failure causes with a reduced application time without gathering the complete failure bit-map. The paper is organized as follows: Section 2 describes the overall test architecture. Section 3 describes the image processing algorithm adopted to minimize the diagnosis application time. Section 4 reports some experimental results. Section 5 draws some conclusions. 3
2.
Test Architecture The STMicroelectronics design flow includes BIST solutions for testing embedded memories since
several years; for example, BIST for RAMs adopted a March algorithm and included both a test and a debug mode. The latter was intended to allow the extraction of detailed diagnostic information from faulty chips, and was based on letting each BIST module evolve in single-step mode and produce complete information about the output behavior of the RAM after each step of the implemented March test. The existing solutions had some limitations, like the long time required for extracting all the required information for diagnosis, the dependency on ATE performance features and the difficult extendibility to SOCs including multiple BIST cores. The main idea behind our work is to extract from the BIST diagnostic structures a sufficient amount of information to achieve fault classification and identification. The constraints we had while defining our solution are: •
a limited increase in the amount of area overhead
•
a modular approach, suitable to be supported by most design automation tools
•
a scalable solution, allowing a flexible definition of the quantity of diagnostic information to be extracted, thus budgeting the testing time
•
the usage of low-performance HW ATE, leveraging instead software resources, available through the system workstation. This Section describes the hardware architecture (outlined in Fig. 2) devised to support the test and
diagnosis of the memory core. A more detailed description and analysis has been presented in [2]. The test architecture of each memory core is organized in the following two layers: •
Diagnostic BIST: this layer is in charge of executing the diagnostic test algorithm on the embedded RAM and of gathering diagnostic information
•
Wrapper: this interface is IEEE P1500 [14] compliant; it wraps the Diagnostic BIST module and is in charge of managing the test communications with the outside world, i.e., receiving commands and sending return information concerning results of the test algorithm executed on the memory. For test purposes the whole chip can be accessed through a IEEE 1149.1 compliant TAP. The TAP
Controller decodes the commands sent by the ATE through the TAP and sends them to the selected
4
core through the TAM; it also allows the ATE to access the test and diagnosis information gathered by each wrapper. TAP TAP Controller TAM
Wrapper Diagnostic BIST
Core
Core
Memory
Figure 2: Test and diagnosis system architecture.
2.1. Diagnostic BIST module This module implements the BIST algorithm performing either pure test or diagnostic test. The memory may work in a normal and in a test mode. When in test mode, the module implements a classical March algorithm. With respect to a normal BIST, this module implements some additional features and generates additional information which can be exploited for diagnosis. Its architecture is relatively independent on the implemented algorithm, which can be selected according to the existing goals in terms of test and diagnostic capabilities, and to the constraints on time and area costs. For the purpose of the adopted approach, the test algorithm is divided into basic steps, each corresponding to a single access in memory (either for a read or a write operation). The module has been implemented so that it can execute the following operations: •
set up the number of steps the March algorithm must run for
•
activate the March algorithm execution
•
provide the information about the last detected error, if any, thus allowing to know which locations have been possibly affected by a fault. These diagnostic information are updated at the end of every single step and include •
the incremental number of detected errors (from the reset)
•
the ordinal number of the step where the last error has been detected
5
•
the faulty world, corresponding to the exor between the word read from the memory and the expected one when the last error was detected
•
restart the March algorithm from the beginning
•
provide the status of the March algorithm (e.g., completed, running, paused, etc. ).
2.2. Wrapper The Wrapper contains the circuitry necessary to implement either the test or the diagnosis facilities supported by the BIST module, and to interface it with the TAP controller through a serial TAM. The Wrapper is compliant with the suggestions of the P1500 standardization group [14]. In addition to the mandatory components it includes the following user Data registers: •
WBCDR (Wrapper BIST Control Data Register): through it the wrapper receives the commands (e.g., BIST reset, programming the number of steps to be executed by the March algorithm) to be sent to the Diagnostic BIST module
•
WDR (Wrapper Data Register): it is an I/O buffer register. According to the command written in WBCDR the outside world may execute one of the following operations: •
read from WDR the diagnostic information (i.e., the number of detected errors, the step corresponding to the last detected error and the faulty word) coming from the Diagnostic BIST module
•
write in WDR the number of steps to be executed by the March algorithm.
In Fig. 3 the overall adopted Wrapper architecture is reported.
WSI
T A P C O N T R O L L E R
W B C D R
WRCK WRSTN ShiftWR UpdateWR CaptureWR
Instr. Decoder SelectWIR
W I R
W B Y
W D R
D B I S T
B I S T
MEMORY
CORE
WSO
WRAPPER
Figure 3: The proposed Wrapper Architecture.
6
W B R
2.3. The TAP Controller The IEEE 1149.1 compliant TAP Controller plays the role of interfacing the ATE with the wrappers, and hence with the BIST module existing within each memory core. The instructions supported by the TAP Controller allow to control the execution of the diagnosis (e.g., starting the March algorithm, putting the BIST into the reset state, loading the number of operations to be executed by the March algorithm), to poll the status of each core and to read the diagnostic information (the number of detected errors, the step corresponding the last detected error, etc.). The list of instructions supported by the TAP controller is reported in Table 1. Instructions
TAP Instructions description
RESET
Force the BIST module into the reset state
RUNBIST
Force the BIST module into the test mode and starts the March algorithm from the beginning
LOADSTEPS
Loads the number of operations to be executed by the March algorithm; by default this number is equal to the number of operations required by a single and complete element of the adopted March algorithm
READSTATUS
Reads from the core the status register and verifies whether the March algorithm finished its task (either because it reached its end, or because it executed the specified number of operations)
READRESULT
Reads from the core the register containing the information about the last error detected by the March algorithm
READERROR
Reads from the core the register containing the number of errors detected by the March algorithm
Table 1: TAP instructions.
3. Fault Classification In this paper we propose to apply the Hough transform (HT) [13-14] to a partial failure bitmap in order to reduce the number of BIST runs and to estimate the presence of a fault according to a predefined fault dictionary. The adopted fault dictionary includes, for the considered memory under test, the most relevant failure patterns, defined considering experimental analysis on real cases. Fig. 4 shows the basic elements of the dictionary composed of the single fault (spot), the whole column faulty, the whole row faulty, a group of contiguous cells faulty (cluster). While a subset of errors is captured from the BIST execution, a Hough transform (HT) is applied in the space indicated by the models of the fault dictionary. The Hough transform can be used to isolate 7
features of a particular shape within an image. It is most commonly used for the detection of regular curves such as lines, circles, ellipses, etc. Despite its domain restrictions, the Hough transform retains many applications, as most manufactured parts contain feature boundaries, which can be described by regular curves. The main advantage of the Hough transform technique is that is particularly robust to missing and contaminated data.
sp ot
c lu s te r
c o lu m n
ro w
Figure 4: An example of a fault dictionary.
Hough transform allows mapping the features recognized in an image space into a set of points into a parameter space. In the classical image processing case the images are captured from a camera, and a filtering is required to extract the interesting features before the HT application. Furthermore, it is necessary to cope with the presence of noise, which reduces the ability to identify features. The straight-line representation is a classical example, indeed very useful also in our case. In the image space, a line is represented by a collection of (x,y) coordinates. In the HT, these points can be mapped into a polar representation (ρ,θ). For each fault described into the dictionary, a specific HT should be computed, determining an array representing the specific Hough transformed space. The analysis of the peaks into the arrays (also called voting technique) allows identifying the most probable fault candidate.
8
Run BIST and collect errors information
Identify BIST parameters and run a BIST session
Not Found
Adaptive Hough transform
Vote among fault patterns Found Classified Faults
Figure 5: Flow chart of the fault classification process
The analysis starts considering a subset of the failures recognized by the BIST execution, mapped into our virtual image, that is a partial bitmap representation. HT and the voting technique are applied. This coarse classification of the fault is then refined through an inverse mapping to the data point that may belong to the fault shape. A successive BIST execution, gathering further failure information, may allow confirming the first hypothesis. The approach also consists in matching one (or more) of the candidates described in the dictionary with the available failure location [15]. From an image processing theory point of view, the technique can be classified under the problem of recognizing predefined patterns of occluded objects into binary images. The orthogonal nature of the pseudo-images and the intrinsic absence of capturing noise offered the ability to achieve high efficiency in the classification. Furthermore, the effectiveness of the methodology is improved, accumulating the results over a large population, and analyzing the statistical computed data. Figure 6 reports a block diagram showing the overall process of fault classification. Figure 5 offers a more detailed diagram of the Hough transform process, applied to the fault dictionary shown in Fig. 4. The HT in the “spot” space is actually the space itself. In this case the classification aims at recognizing the presence of isolated faulty cells in the subset of localized faults. The following HT, for rows and columns space, determines two vectors of size row and column, respectively, whose analysis leads to identifying the concerned faulty shapes. HT in the cluster space is obtained starting from the row and column space transform.
9
Execute the BIST and collect fail information Classification Routine
Search for SPOT failures Eliminate them from the list
Search in the HT space for the considered fault for maximum
Consider fault type #2 from the dictionary: ROW Compute HT to the row space
Select a candidate and validate it extracting other data from BIST execution
CALL Classification Routine Consider fault type #3 from the dictionary: COLUMNS Compute HT to the row space
Confirmed?
Y
N
CALL Classification Routine
Classification data
Consider fault type #4 from the dictionary: CLUSTER Compute HT to the row space
RETURN
CALL Classification Routine
Figure 6: Detailed flow chart for the fault classification process
4. Experimental Results This Section presents the results obtained in a project developed and still undergoing at STMicroelectronics. The architecture is currently being evaluated on a sample chip including two 16K×16 bits embedded memories. The chip has been manufactured using a mixed/power BCD6 0.35 µm library. The area overhead introduced by the BIST and DBIST modules amounts to less than 2% of the memory area, that of the wrapper to about 1%, that for the TAP controller to less than 1%. In order to evaluate the effectiveness of the proposed approach a set of different lots of wafers has been considered. The obtained results applying a diagnostic test process to these dices are reported in Tab. 2, where the first column reports the progressive number of the lot, the second column represents the number of tested dices, the two last columns show the number and the percentage of faulty dices, respectively. Lot # 1 2 3 4 5 6 7 Total
Tested dices 639 635 1,466 1,039 964 1,143 1,405 7,291
Faulty
[%]
127 233 358 602 279 359 268 2,226
19.8 36.6 24.4 57.9 28.9 31.4 19.0 30.5
Table 2: Test results on different lots of dices.
10
The bi-dimensional adaptive Hough transform represented an effective solution able to classify the faults starting from a limited amount of failure data collected. This allowed a significant reduction in testing time for diagnosis, limiting the number of BIST runs. Lot # 1 2 3 4 5 6 7 Total
Faulty dices 127 233 358 602 279 359 268 2,226
ND 3 7 12 23 18 48 10 121
S 77 151 242 383 158 311 257 1,579
C 22 27 43 74 39 0 0 205
R 0 0 1 0 0 0 0 1
Cl 0 0 0 0 0 0 0 0
RC 0 0 0 0 0 0 0 0
SC 4 10 10 19 15 0 0 58
SR 0 0 0 0 0 0 0 0
SCl 0 0 0 0 0 0 0 0
SCR 0 0 0 0 0 0 0 0
NC 21 38 50 103 49 0 1 262
Tab. 3: Fault classification results. Tab. 3 reports the results obtained with our experiments. The analysis has been done considering only the faulty chips among the lots reported in Tab. 2. The BIST is run a first time and the number of errors is read at the end of the test execution. The first run is enough to diagnose the following cases: •
Not Diagnosable chip (column ND in Tab. 3): if the number of detected error exceeds a predefined threshold (in our case study it was set up to 30,000). This situation corresponds to a destroyed chip and can be caused by a harmful defect
•
Spot faulty chip (column S in Tab. 3): if the number of detected errors is equal to 1. Running the BIST for further K times, the algorithm can start the classification over a larger
number of topologically mapped failures. The considered fault dictionary is composed of the following fault types (the symbol reported refers to the corresponding column in Tab. 3): •
Spot (S)
•
Column (C)
•
Row (R)
•
Cluster (Cl)
•
Row+Column (RC)
•
Spot+Row (SR)
•
Spot+Column (SC)
•
Spot+Cluster (SCl)
11
•
Spot+Row+Column (SRC) The value MAX - K represents the number of iterations required to confirm the fault pattern
selected by the voting scheme. The values K and MAX should be chosen considering technological information, memory topology, test time constraint and size of the failure buffer available on board. In our case study the values of K and MAX have been set to 15 and 20, respectively. After MAX iterations of the BIST execution some chips cannot be classified to any of the fault types defined in the fault dictionary (column NC in Tab. 3). These cases correspond to more complex fault types (e.g., a pair of cells or an incomplete column). The complete execution of the diagnosis process, applying the proposed approach based on the Hugh transform on the full list of faulty dices analyzed in Tab. 3 and 4, requires 13,530 BIST iterations. Tab. 4 summarizes the results obtained by means of the diagnosis approach obtained following the proposed approach based on the Hough transform and reporting that a limited set of faulty chips (corresponding to 11.7% among the total number of faulty chips) cannot be classified among the fault classes defined in the adopted fault dictionary. Lot #
Faulty dices
Classified [%]
1 2 3 4 5 6 7 Total
127 233 358 602 279 359 268 2,226
81.1 80.7 82.7 79.1 76.0 86.6 95.9 83.0
Not Diagnosable [%] 2.4 3.0 3.3 3.8 6.4 13.4 3.7 5.3
Not Classified [%] 16.5 16.3 14.0 17.1 17.6 0.0 0.4 11.7
Tab. 4: Fault classification summary. The proposed technique guarantees that the accuracy of the method, i.e., the reduction of the percentage of unclassified faults, depends mainly on the accuracy of the adopted fault dictionary. A more detailed analysis of the set of unclassified faults, based on the algorithm presented in [2], showed that the largest part of unclassified faults is the pair of contiguous bit cells. Tab. 5 showed the obtained results on 2 lots of 281 faulty dices considering an extended fault dictionary including also the following ones: •
Horizontal Pair (HP)
•
Vertical Pair (VP)
12
•
Spot+Vertical Pair (SV)
•
Spot+Horizontal Pair (SH). Lot
1 2 Total
Faulty dices 60 221 281
ND
S
C
R
Cl
RC
SC
SR
SCl
SCR
HP
VP
SV
SH
NC
1 18 19
24 78 102
12 53 65
0 0 0
0 0 0
0 0 0
3 6 9
0 0 0
0 0 0
0 0 0
0 0 0
9 34 43
9 25 34
0 1 1
2 6 8
Tab. 5: Test case considering an enriched fault dictionary. The preliminary results, shown in Tab. 5, are very promising and figure out a limited number of unclassified faults (NC) correspondent to 2,8% cases among the total number of faulty chips. In order to evaluate the effectiveness of the proposed approach another set of experiments has been executed on the same set of faulty dices considered in Tab. 3 and 4, adopting the pseudo-exhaustive diagnostic algorithm presented in [2], where a complete BIST execution is first done and if the number of detected errors exceeds a threshold number, the chip is considered not diagnosable, otherwise all the information concerning the detected errors are collected. This method allows reducing to 0 the number of not classified dices, but the global number of BIST iterations required to complete the diagnosis corresponds to 479,283 times, which is about 35 times higher than the number of iterations required by the proposed approach. The trade-off between the accuracy and the diagnostic application time justifies the goodness of the proposed approach.
5. Conclusions We described a method for achieving fault classification and localization for embedded memories tested through BIST within a test-manufacturing environment. Industrial constraints asked for a scheme allowing a scalable and modular extraction of fault diagnosis information in the available testing time. Full deterministic failure bit-maps can be extracted, with some penalties for the testing time, but this is a solution suitable for the engineering phase. Both in the manufacturing mode and in the engineering one, we only used low-cost resources on board of ATE. A diagnosis resource partitioning approach has been used, between the DUT and the ATE computer, where we implemented our diagnostic flow. Fault classification has been achieved using adaptive Hough transform inherited from image processing. Future works will address further advances in design for diagnosis techniques. The improvement of the proposed architecture will incorporate some of the fault classification structures, aimed to improve the overall efficiency and effectiveness of the approach. We also intend to focus on improving the
13
classification efficiency of faults that are not actually classified (considering an extended fault dictionary including pairs of faulty bit cells).
6. References [1]
E. Nelson, J. Dreibelbis, R. McConnell, Test and Repair of Large Embedded DRAMS: part 2, IEEE International Test Conference, 2001, pp. 173-181
[2]
D. Appello, F. Corno, M. Giovinetto, M. Rebaudengo, M. Sonza Reorda, A P1500 compliant architecture for BIST-based Diagnosis of embedded RAMs, IEEE Asian Test Symposium, 2001, pp. 97-102
[3]
C.-T. Huang, J.-R. Huang, C.-F. Wu, C.-W. Wu, T.-Y. Chang, A programmable BIST core for embedded DRAM, IEEE Design and Test of Computers, Vol. 16, No. 1, pp. 59-70, 1999
[4]
R. David, A. Fuentes, Fault Diagnosis of RAM’s from Random Testing Experiments, IEEE Transactions on Computer, 1990, Vol. 39, no. 2, pp. 220-229
[5]
R. Treuer, V. Agarwal, Built-In Self Diagnosis for Repairable Embedded RAMs, IEEE Design and Test of Computers, 1993, Vol. 10, no. 2, pp. 24-33
[6]
L. Shen, B. Cockburn, An Optimal March Test for Locating Faults in DRAMs, IEEE International Workshop on Memory Testing, 1993, pp. 61-66
[7]
V.N. Yarmolik, Y.V. Klimets, A.J. van de Goor, S.N. Demidenko, RAM diagnostic tests, IEEE International Workshop on Memory Technology, Design and Testing, 1996, pp. 100-102
[8]
T. Bergfeld, D. Niggemeyer, E. Rudnick, Diagnostic testing of embedded memories using BIST, IEEE Conference on Design, Automation and Test in Europe 2000, pp. 305-309
[9]
C.-F. Wu, C.-T. Huang, C.W. Wang, K.-L. Cheng, C.-W. Wu, Error Catch and Analysis for Semiconductor Memories Using March Tests, IEEE/ACM International Conference on Computer Aided Design 2000, pp. 468-471
[10] J.-F. Lu, C.-W. Wu, Memory Fault Diagnosis by Sindrome Compression, IEEE Design, Automation and Test in Europe, 2001, pp. 97-101 [11] H.Kim, Y. Zorian, G. Komoriya, H. Pham, F. Higgins, J. Lewandowski, Built-In Self-Repair for Embedded High Density SRAM, IEEE International Test Conference, 1998, pp. 1112-1119
14
[12] J. Illingworth, J. Kittler, The Adaptive Hough Transform, IEEE Transactions on Pattern Analysis and Machine Intelligence, Vol. PAMI-9, No. 5, September 1987, pp. 690-698 [13] C. Derek, W. Pao, Hon F. Li, Shapes Recognition Using Straight Line Hough Transform: Theory and Generalization, IEEE Transactions on Pattern Analysis and Machine Intelligence, Vol. 14, No. 11, November 1992, pp. 1076-1089 [14] E.J. Marinissen, Y. Zorian, R. Kapur, T. Taylor, L. Whetsel, Towards a Standard for Embedded Core Test: An Example, IEEE International Test Conference, 1999, pp. 616-627 [15] M. Gharavi-Alkhansari, A Fast Globally Optimal Algorithm for Template Matching Using LowResolution Pruning, IEEE Transactions on Image Processing, Vol. 10, No. 4, April 2001, pp. 526533
15