Acta Scientiarum http://www.uem.br/acta ISSN printed: 1806-2563 ISSN on-line: 1807-8664 Doi: 10.4025/actascitechnol.v35i3.16210
A bootstrapped neural network model applied to prediction of the biodegradation rate of reactive Black 5 dye Kleber Rogério Moreira Prado1, Jorge Marcos Rosa2, José Carlos Curvelo Santana1, Elias Tambourgi3, Wonder Alexandre Luz Alves1 and Fabio Henrique Pereira1* 1 Programa de Pós-graduação em Engenharia de Produção, Universidade Nove de Julho, Av. Francisco Matarazzo, 612, 05001-100, São Paulo, São Paulo, Brazil. 2Faculdade de Tecnologia SENAI Antoine Skaf, São Paulo, São Paulo, Brazil. 3Departamento de Engenharia de Sistemas Químicos, Faculdade de Engenharia Química, Universidade Estadual de Campinas, Campinas, São Paulo, Brazil. *Author for correspondence. E-mail:
[email protected]
ABSTRACT. Current essay forwards a biodegradation model of a dye, used in the textile industry, based on a neural network propped by bootstrap remodeling. Bootstrapped neural network is set to generate estimates that are close to results obtained in an intrinsic experience in which a chemical process is applied. Pseudomonas oleovorans was used in the biodegradation of reactive Black 5. Results show a brief comparison between the information estimated by the proposed approach and the experimental data, with a coefficient of correlation between real and predicted values for a more than 0.99 biodegradation rate. Dye concentration and the solution’s pH failed to interfere in biodegradation index rates. A value above 90% of dye biodegradation was achieved between 1.000 and 1.841 mL 10 mL-1 of microorganism concentration and between 1.000 and 2.000 g 100 mL-1 of glucose concentration within the experimental conditions under analysis. Keywords: resampling, pattern recognition, textile dyes, treatment of effluents, simulation.
Um modelo de rede neural Bootstrap aplicado na predição da taxa de biodegradação do corante reactive Black 5 RESUMO. Este trabalho propõe um modelo de projeção da biodegradação de um corante, utilizado no processo industrial têxtil, baseando-se em rede neural apoiada por reamostragem bootstrap. A rede neural com bootstrap é usada para gerar estimativas que se aproximem dos resultados obtidos em uma experiência intrínseca na qual se aplicou um processo químico. Pseudomonas oleovorans foi utilizado na biodegradação do reactive Black 5. Os resultados mostram uma breve comparação entre a informação estimada pelo método proposto e os dados experimentais, com um coeficiente de correlação entre os valores reais e previstos para a taxa de biodegradação, acima de 0,99. A concentração de corante e o pH da solução não tiveram interferência nos valores de índice de biodegradação. Um valor superior a 90% de biodegradação do corante foi alcançado entre 1,000-1,841 mL 10 mL-1 de concentração de microorganismos e 1,000-2,000 g 100 mL-1 de concentração de glucose, na condição experimental deste estudo. Palavras-chave: reamostragem, reconhecimento de padrões, corantes têxteis, tratamento de fluentes, simulação.
Introduction The treatment of effluents in textile industries has become a very important issue. There are over 100,000 commercially available dyes and more than 7x10⁷ tons of dyestuff produced annually worldwide (AKHTAR et al., 2005; ROBINSON et al., 2001). These dyes are widely used in a number of industries, such as textiles, food, cosmetics and printing, although the textile industry is the greatest consumer of dyes (PANDEY et al., 2007). In Brazil, there are 5,000 textile industries distributed into large (11%); small (21%) and very small (68%) companies. Whereas the Brazilian textile sector occupies 5th place in direct jobs and 6th in Acta Scientiarum. Technology
turnover, the production of dye in Brazil reaches 26,500 ton per year (SILVEIRA et al., 2009b; ULSON DE SOUZA et al., 2007). Moreover, it is estimated that at least 20% of textile dyes in the dyeing process are discharged into effluents due to losses during the process for color fixing to the fibers. The removal of these compounds from industrial waste is one of the major environmental problems faced by the textile sector. In fact, the nontreatment of these effluents may cause serious risks to the environment and, consequently, to the whole productive chain. Therefore, the development of effluent treatment technologies is currently of great relevance due to increasing ecology conscienceMaringá, v.35, n. 3, p. 565-572, July-Sept., 2013
566
awareness and to strict environmental law. Further, when companies implement new and efficient systems of effluent treatment, they show a proactive and committed stance towards environmental problems by assessing and eliminating its negative externalities. In other words, they refrain from causing impacts from their production process and, by becoming sustainable, no water consumption and discharge of polluting effluent occur. However, the treatment of effluents by textile industries becomes more complicated with the common use of several other chemicals with different composition, such as moisturizers, colorants, electrolytes, dispersers, pH controllers, stabilizers and others used during the coloring process. The main techniques in the literature on effluent treatment are adsorption, precipitation, biological and chemistry degradation, electrochemistry and photochemistry. Currently, the most popular methods of color removal from wastewater involve physical and chemical processes that, besides being expensive, usually include the formation of a concentrated sludge that creates a secondary and highly significant disposal problem (CHANG; KUO, 2000). Although integrated chemical methods seem to be feasible for the treatment of such wastewater, biological methods should preferably be used when costs and technical advantages are taken into account (YU et al., 2010). Environmental biotechnology is constantly trying to find more and more solutions for the biological treatment of dye-contaminated wastewater. Although numerous microorganisms are capable of decolorizing dyes, only a few are able to mineralize these compounds into CO2 and H2O (JUNGHANNS et al., 2008). Although under aerobic conditions, azo dyes are not easily metabolized by bacteria (ROBINSON et al., 2001), several bacterial strains, including Pseudomonas oleovorans, may enzymatically reduce under anaerobic conditions the azo bonds in the dye molecule to produce colorless by-products (SILVEIRA et al., 2009b). Due to the toxicity and low biodegradability of azo dyes, it is suggested that more effective treatment methods, such as advanced oxidation processes (AOPs), should be employed for the destruction of these compounds in wastewater (KIM et al., 2004; MOHAJERANI et al., 2011). However, the main costs of the Fenton reaction process with H2O2 are disadvantageous. Further, the addition of Fe2+ produces a brown turbidity that causes the combination of hydroxyl radical. Fe2+ reacts with Acta Scientiarum. Technology
Prado et al.
hydroxyl radicals as a scavenger and since this contaminant should be removed from the effluent the process becomes more expensive still (KIM et al., 2004). Due to these issues, several researches have been carried out to find an efficient approach to simulate different process for the degradation of azo dyes (ALEBOYEH et al., 2008; BALAN et al., 1999; CEYLAN, 2008; DANESHVAR, et al., 2006; GUIMARÃES; SILVA, 2007; GUIMARÃES et al., 2008; MOHAJERANI et al., 2011; SOLEYMANIA et al., 2011; ZAREI et al., 2010). Consequently, the use of artificial neural network models is widespread and shows good results in the prediction of degradation rates under different conditions. However, neural networks are limited by the size of the experimental data set. Neural network experiments are conducted by using a division of the available data into training, selection, and test sets (PANCHAL et al, 2011). Unfortunately, the determination of constant values from experimental procedure has many limitations. In such cases, the initial collected data set is often very small, the magnitude of variable effects is sometimes ambiguous and data collection costs are high. Data division into multiple subsets is therefore very unproductive since less data are produced than those expected for a single subset. An alternative method to overcome these problems is the use of a re-sampling approach such as the bootstrap method based on an imitation of a probabilistic process and on the information supplied by a given small set of random samples. Research has shown the feasible of the bootstrapping technique for estimating objects out of sample by redrawing small subsets (EFRON, 1979; EFRON; GONG, 1983). However, the use of this approach to estimate dye biodegradation rate is practically nonexistent. Coupling bootstrap and artificial neural networks has produced some improved prediction models in different areas (FRANKE; NEUMANN, 2000; LAJBCYGIER; CONNOR, 1997). Through such an approach, the bootstrap method is used to create several designed data sets to train different neural networks. This approach identifies the distribution of a statistical estimation for the construction of confidence intervals for values that are being predicted (in this case, dye biodegradation rate). Of course, decisions based upon a number of experiments with different subsets may produce much more reliable results and may at least mitigate the sampling bias. The latter issue is an important Maringá, v. 35, n. 3, p. 565-572, July-Sept., 2013
Biodegradation prediction bootstrapped neural network model
problem in the neural network approaches and an inevitable consequence of the limited number of samples that it is possible to record in a real experiment (FRANKE; NEUMANN, 2000; LAJBCYGIER; CONNOR, 1997). In current assay, the bootstrap method has been applied within a neural network context to create an improved dye biodegradation prediction model. Pseudomonas oleovorans was used in the biodegradation of reactive Black 5 and the predicted results of the designed model and the experimental data were compared to validate the proposed numerical approach.
567
method (Winkler method) was used to determine OD concentration on zero and five day times for the measurement of BOD5 content. The titrating metric method (Walkley-Black method) was employed to determine TOC content. All methods are shown in APHA (1995). x1
The microorganism Pseudomonas oleovorans (CMAI 703) was obtained from the Brazilian Collection of Industrial and Environmental Microorganisms of the State University of Campinas, Campinas, São Paulo State, Brazil. The Reactive Black 5 was obtained from the Department of Chemical Engineering of the Federal University of Sergipe, Brazil. Glucose, mono- and di- basic potassium phosphate were provided by Merck (Darmstadt, Germany). Design and Experimental System
Table 1 shows the experimental design 24-1 drawn up to study the effect of dye (Cdye, mg L-1), glucose (Cglucose, g 100 mL-1), microorganism (Cmo, mL L-1) concentrations and pH (pH) on dye biodegradation (%Biod) at initial time. Experimental studies were carried out in 250-mL conical flasks containing mineral medium and inoculated with Pseudomonas oleovorans at 180 rpm, room temperature and pressure at 27°C and 1 atm respectively, in an orbital shaker, for seven days. The samples were then centrifuged and dye biodegradation were estimated every 4 hours by a spectrophotometer at 600 nm (SILVEIRA et al., 2009b). When the sample was digested, COD material in that sample was oxidized by the dichromate ion. This procedure resulted in the change of chromium from the hexavalent (VI) to the trivalent (III) state. The two chromium species exhibited a color and absorbed light in the visible region of the spectrum. The dichromate ion (Cr2O72-) absorbed strongly in the 400 nm region, whereas the chromic ion (Cr3+) absorbed much less. On the other hand, in the 600 nm region, the chromic ion absorbed strongly and the dichromate ion had a near zero absorption (Standard Method 5220 D). The iodine-metric Acta Scientiarum. Technology
(1)
0.0500
x2 pH 7.000
(2)
x3
(C mo 1.000) 0.500
(3)
x4
(C Glu cos e 1.0000) 0.500
(4)
Material and methods Material
(C dye 0.1000)
The biodegradation index was given by % Bio
(C dye (initial ) Cdye (end )) Cdye ( Initial )
*100
(5)
The Proposed Bootstrapped Neural Network prediction model
The bootstrap method is based on the imitation of the probabilistic process using the information from a given small set of random samples. Given an original (small) dataset, the method estimates the standard error of some parameter of interest using the samples as an approximation of the population. Specifically, it takes samples with replacement from the original dataset to approximate samples from the population. A simple algorithm to illustrate the bootstrap method may be defined by the three steps below (JOHNSON, 2001): (1) Sample values with replacement from the original data and compute the parameter of interest p. (2) Repeat step (1) from a moderate to a great number of times, B, to come up with bootstrap estimates p1, p2,...., pB . (3) Use the standard deviation of the B estimates in step (2) to estimate the probability distributions describing the prediction process, the standard error, and the confidence interval. In this case, the original data set obtained from the experimental design was used to generate thirty-bootstrapped-data set for training feedforward neural networks. The artificial neural network may be defined as a set of mathematical methods and computational algorithms designed to simulate the process of information handling and the knowledge acquisition on the human brain. Maringá, v. 35, n. 3, p. 565-572, July-Sept., 2013
568
Prado et al.
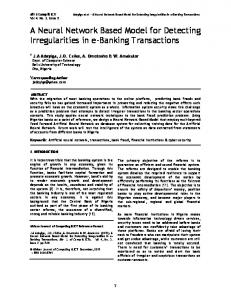
Since it is inspired by human brain biology, the neural network has basic elements such as artificial neurons, synapses, neural weights, transfer functions and others (HAYKIN, 1999). The artificial neurons are grouped into layers and connected in parallel. The first layer of the neural network is called the input layer and it has a number of neurons equal to the number of independent variables. Similarly, the last is the output layer and its neurons return the correspondent values of the dependent variables. Depending on the problem, one or more hidden layers may be located between the input and output layers. The number of neurons in these hidden layers may also be defined according to the problem and the computations performed by an artificial neuron are determined by the transfer functions they apply. Therefore, the number of layers, the number of nodes in each layer and the transfer function define the configuration of a neural network. In the Neural Network training process, the input variables (concentrations of dye, pH, microorganism and glucose) are normalized within the 0-1 range and are connected to the hidden neurons by weights and bias. The neurons of the network subsequently receive this input signal and transform it into output signal that is transmitted to the next neuron in the processing direction, according to the input-output behavior defined by the transfer function. This process is accomplished in an iterative way in order to find a set of connection weights and biases that minimize the mean square error between the observed and the predicted output in the output layer. In current assay, the bootstrap method has been used to generate thirty data sets for the neural network training. In this phase, neural networks were used with two hidden layers, 5 neurons in both layers, and bootstrapped training sets with 100 samples with replacement. Such configuration of the neural networks was reached experimentally for values within the 1-5, 2-15 and 20-100 range for number of layers,
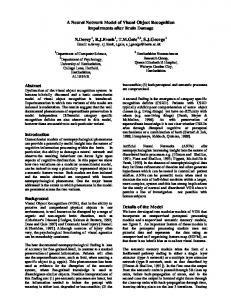
number of neurons in hidden layers and bootstrap sample size, respectively. Figure 1 shows the neural network configuration. The number of neural networks was chosen to ensure a statistical estimation precision of about 8% with 95% confidence rate. Further, tangent sigmoid as transfer function and gradient descent with momentum back-propagation training with 0.2 of learning rate were employed (HAYKIN, 1999). A sensitivity analysis was also performed to quantify the effect of each input variable on the network output. The sensitivity analysis approach, proposed by Fish and Blodgett (2003) and Delen et al. (2006), was adopted in current investigation. The basic idea of this method was to disturb one input variable value within a reasonable interval while keeping all the other variables unchanged. At the same time, the corresponding variation of network output was recorded and the effect of changing a single explanatory variable on the network output was found. The model selection was also guided by the simple strategy of directly focusing on the increase of the coefficient of correlation between the outcomes and their predicted values, taking all the difficulties of this task into consideration (CURRY; MORGAN, 2006). After the training, the neural networks were used to generate new data sets to improve the original set. This second step determined all the output values for dye biodegradation. The mean value of the output from the 30 bootstrapped neural networks was used as a predicted value of response biodegradation rate. The resulting prediction, based on a number of experiments with different subsets, may produce much more reliable results and may at least mitigate the sampling bias, which is an important problem in the neural network approaches and is an inevitable consequence of the limited number of samples that it is possible to record in a real experiment. Figure 2 illustrates the whole prediction process.
Cdye(g L-1) pH Cmo(mL L-1) Cglucose(mL L-1)
Figure 1. The neural network configuration. Acta Scientiarum. Technology
Maringá, v. 35, n. 3, p. 565-572, July-Sept., 2013
Biodegradation prediction bootstrapped neural network model
569
concentrations of dissolved solid and chemicals were observed after the process. Consequently, the process may be discarded because it increased the environment contamination due to a decrease of the quality of ecological parameters. Table 2. Measured parameters for the best experimental conditions. Ponto ou vírgula nos valores? Figure 2. The proposed bootstrapped neural network approach.
Results and discussion Experimental results
Table 1 shows the experimental plan and results for each assay. Most trials showed an over 90% biodegradation rate of reactive Black 5. Apparently, there was a greater influence of the microorganism content than by other factors. However, glucose concentration cannot be excluded from these important factors, because a low biodegradation index had been observed under its lower concentration. The best result occurred at 0.15 g L-1 of dye, pH 6, 1.5 mL L-1 of microorganism and 1 g 100 mL-1 of glucose, with a biodegradation index of 96%. Table 1. Experimental design for dye biodegradation. Cdye, Cmo and Cglucose are, respectively, the concentrations of dye, microorganism and glucose; %Biod is the biodegradation index. Assay 1 2 3 4 5 6 7 8 9 10 11 12 13 14 15 16 17 18 19
Cdye (g L-1) 0.05 0.05 0.05 0.05 0.15 0.15 0.15 0.15 0.1 0.1 0.1 0.1841 0.0159 0.1 0.1 0.1 0.1 0.1 0.1
pH Cmo (mL L-1) Cglucose (%) 6 0.5 1 6 0.5 2 8 0.5 2 8 0.5 1 6 1.5 2 6 1.5 1 8 1.5 1 8 1.5 2 7 1 1.5 7 1 1.5 7 1 1.5 7 1 1.5 7 1 1.5 8.682 1 1.5 5.318 1 1.5 7 1.841 1.5 7 0.159 1.5 7 1 2.341 7 1 0.659
% Biod 60.46 72.93 42.03 78.32 92.61 96.62 90.53 92.52 90.50 90.44 91.38 89.79 85.36 90.19 86.32 93.04 84.71 66.82 5.73
Table 2 shows measurements of the chemical parameters. A higher removal percentage for all parameters may be observed. According to Silveira et al. (2009a and b), COD/BOD rate between 1.5 and 2.5 demonstrated that effluent was biodegradable. Consequently, as shown in Table 2, the dye effluent used in current experiment was highly biodegradable. Golob et al. (2005) achieved a significant result for the coagulation and precipitation of the dye, with more than 90% removal of reactive Black 5, using Al2(SO4)3 as precipitant agent. However, high Acta Scientiarum. Technology
Parameter TOC (mg L-1) COD (mg L-1) BOD (mg L-1)
Initial 4047.00 10150.00 6394.00
End 2.05 28.22 5.09
% Removal 99.95 99.72 99.92
Aleboyeh et al. (2008) showed that the initial concentration of the dye and initial pH has strong effects on the de-colorization efficiency. Further, none of the variables studied in their work could have been neglected in the photochemical decolorization of C.I. Acid Orange 7 solution with a 90% de-colorization at the best conditions. Similar efficiency was also observed by Zarei et al. (2010) in their study on the degradation of C.I. Basic Red 46 (BR46) by photoelectro-Fenton (PEF) combined with photocatalytic process. Guimarães and Silva (2007) also reported over 90% degradation efficiency of Acid Orange 52 and Acid Orange 10 and less than 80% of Acid Brown 75 and Direct Red 28 dyes. Kim et al. (2004) verified less than 60% removal efficiency by FeCl2 precipitation reactive yellow 84 and blue 49 and an efficiency of 95% by photofenton process. A lab scale active sludge reactor combined to a membrane separation process was used in the dye removal of denim textile wastewater. Although 75 and 90% efficiency was observed, Balan et al. (1999) in a biological treatment with yeast of Pseudomonas pictorum at 30°C observed a degradation of 98% of phenol for high glucose concentration. The cell content was not significant and demonstrated the importance of glucose on the Pseudomanas yeast in biodegradation processes. The above demonstrates that P. oleovorans is very efficient in dye removal, with results similar to those with photo-fenton (ALEBOYEH et al., 2008; GUIMARÃES; SILVA, 2007; KIM et al., 2004; ZAREI et al., 2010) and with P. pictorum treatments (BALAN et al., 1999). In fact, they were higher than those by the precipitation (KIM et al., 2004), active sludge and membrane processes (SAHINKAYA et al., 2008). According to Balan et al. (1999) and Silveira et al. (2009a), Pseudomonas yeasts, when adapted to medium, used the dyes as a substrate to survive, at the end of nutrients. This occurred because they had the ability to release several enzymes (catalases) in the reaction and Maringá, v. 35, n. 3, p. 565-572, July-Sept., 2013
570
Prado et al.
were able to catalyze the decomposition of the carbonic and azo links. Since photo-fenton processes have a high cost with chemicals and increase the turbidity and the metal concentration in the effluent, the biodegradation process with P. oleovorans is still one of the cheapest and most efficient for effluent treatment by textile industries (KIM et al., 2004).
algorithm reproduced the experimental data with high accuracy. Moreover, the designed data analyzed the combinations associated to all low- and highorder interactions and indentified all the effects without any aliasing, which may normally occur in fractional designs (MONTGOMERY, 2005). In fact, the main effects could be assessed more clearly and with greater statistical accuracy.
Bootstrapped neural network prediction results
Biodegradation rate (%)
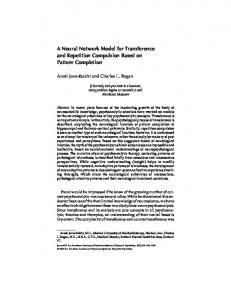
A large range of assays is required for a simple simulation by the traditional neural network method. A full factorial design 24 has 27 assays (for a full experiment). It comprises the maximum reduction in the assay quantity from a 34 common experiment, with 243 total assays (with triplicates), without statistically significant losses. A factorial design 24-1 is a fraction from full factorial planning, resulting in 19 assays, as shown in Table 1. Therefore, the original small data set obtained from the experimental design (Table 1) was used to generate thirty bootstrapped data sets for training feed-forward neural networks. After the training, the neural networks evaluated the biodegradation rate from the original input values. This second step determined all the output values for dye biodegradation in order to generate new data sets to improve the original one. The mean value of the output from the 30 bootstrapped neural networks was employed as a predicted value of response biodegradation rate. Figure 3 presents numerically the results. 100 80
1 18
90
2
17
3
70
16
4
50
15
5
30 14
6 13
7 12
8 11
lower bound
9 10 Predicted
upper bound
Figure 4. 95% confidence intervals for the predictions.
Additionally, the results of the proposed approach were also compared with the experimental data. The performance of a linear regression between the network response and the corresponding target are presented in Figure 5. The proposed model presented remarkable coefficient of correlation between real and predicted values for the biodegradation rate, or rather, above 0.99.
60 Predicted
40
Experimental 20 0 1
3
5
7
9
11
13
15
17
19
Samples Figure 3. Predicted versus experimental dye biodegradation rate.
The bootstrapped neural network approach also calculated the confidence interval for all predicted values. The 95% confidence intervals for this case are presented in Figure 4. The prediction of the last sample was omitted for readability. The minimum and maximum values for each point had an almost negligible deviation and demonstrated that the Acta Scientiarum. Technology
Figure 5. Linear regression results for the bootstrapped neural network approach. Maringá, v. 35, n. 3, p. 565-572, July-Sept., 2013
Biodegradation prediction bootstrapped neural network model
Conclusion The prediction model presented was highly efficient for the experimental data and the model showed a remarkable correlationship coefficient between real and predicted values for an over 0.99 biodegradation rate. The resulting prediction, based upon a number of experiments with different datasets, may produce much more reliable results since it identifies the distribution of statistical estimates, calculates standard error and constructs confidence intervals for the values that are being predicted. Moreover, this approach may at least mitigate the sampling bias, which is an important problem in neural network approaches and is an inevitable consequence of the limited number of samples possible to record in a real experiment. Acknowledgements The authors would like to thank the University Nove de Julho for funding the research project. References AKHTAR, S.; KHAN, A. A.; HUSAIN, Q. Potential of immobilized bitter gourd (Momordica charantia) peroxidases in the decolorization and removal of textile dyes from polluted wastewater and dyeing effluent. Chemosphere, v. 60, n. 3, p. 291-301, 2005. ALEBOYEH, A.; KASIRI, M. B.; OLYA, M. E.; ALEBOYEH, H. Prediction of azo dye decolorization by UV/H2O2 using artificial neural networks. Dyes and Pigments, v. 77, n. 2, p. 288-294, 2008. APHA-American Public Health Association. Standard methods for the examination of water and wastewater. Washington, D.C.: APHA, 1995. BALAN, S. M.; ANNADURAI, G.; SHEEJA, R. Y.; SRINIVASAMOORTHY, V. R.; MURUGESAN, T. Modeling of phenol degradation system using artificial neural networks. Bioprocess Engineering, v. 21, n. 2, p. 129-134, 1999. CEYLAN I. Determination of drying characteristics of timber by using artificial neural networks and mathematical models. Drying Technology, v. 26, n. 12, p. 1469-1476, 2008. CHANG, J.-S.; KUO, T.-S. Kinetics of bacterial decolorization of azo dye with Escherichia coli NO3. Bioresource Technology, v. 75, n. 2, p. 107-111, 2000. CURRY, B.; MORGAN, P. H. Model selection in Neural Networks: some difficulties. European Journal of Operational Research, v. 170, n. 2, p. 567-577, 2006. DANESHVAR, N.; KHATAEE, A. R.; DJAFARZADEH, N. The use of artificial neural networks (ANN) for modeling of decolorization of textile dye solution containing C. I. Basic Yellow 28 by electrocoagulation process. Journal of Hazardous Materials, v. 137, n. 3, p. 1788-1795, 2006. Acta Scientiarum. Technology
571
DELEN, D.; SHARDA, R.; BESSONOV, M. Identifying significant predictors of injury severity in traffic accidents using a series of artificial neural networks. Accident Analysis and Prevention, v. 38, n. 3, p. 434-444, 2006. EFRON, B. Bootstrap methods: another look at the jackknife. Annals of Statistics, v. 7, n. 1, p. 1-26, 1979. EFRON, B.; GONG, G. A leisurely look at the bootstrap, the jackknife, and cross validation. American Statistician, v. 37, n. 1, p. 36-48, 1983. FISH, K. E.; BLODGETT, J. G. A visual method for determining variable importance in an artificial neural network model: an empirical benchmark study. Journal of Targeting, Measurement and Analysis for Marketing, v. 11, n. 3, p. 244-254, 2003. FRANKE, J.; NEUMANN, M. H. Bootstrapping Neural Networks. Neural Computation, v. 12, n. 8, p. 1929-1949, 2000. GOLOB, V.; VINDER, A.; SIMONIC, M. Efficiency of the coagulation/flocculation method for the treatment of dye bath effluents. Dyes and Pigments, v. 67, n. 2, p. 93-97, 2005. GUIMARÃES, O. L. C.; SILVA, M. B. Hybrid neural model for decoloration by UV/H2O2 involving process variables and structural parameters characteristics to azo dyes. Chemical Engineering and Processing, v. 46, n. 1, p. 45-51, 2007. GUIMARÃES, O. L. C.; VILLELA FILHO, D. N.; SIQUEIRA, A. F.; IZÁRIO FILHO, H. J.; SILVA, M. B. Optimization of the AZO dyes decoloration process through neural networks: Determination of the H2O2 addition critical point. Chemical Engineering Journal, v. 141, n. 1-3, p. 35-41, 2008. HAYKIN, S. Neural networks: a comprehensive foundation. Upper Saddle River: Prentice Hall, 1999. JOHNSON, R. W. An introduction to the Bootstrap. Teaching Statistics, v. 23, n. 2, p. 49-54, 2001. JUNGHANNS, C.; KRAUSS, G.; SCHLOSSER, D. Potential of aquatic fungi derived from diverse freshwater environments to decolorise synthetic azo and anthraquinone dyes. Bioresource Technology, v. 99, n. 5, p. 1225-1235, 2008. KIM, T.-H.; PARK, C.; YANG, J.; KIM, S. Comparison of disperse and reactive dye removals by chemical coagulation and Fenton oxidation. Journal of Hazardous Materials, v. 112, n. 1-2, p. 95-103, 2004. LAJBCYGIER, P. R.; CONNOR, J. T. Improved option pricing using artificial neural networks and bootstrap methods. International Journal of Neural Systems, v. 8, n. 4, p. 457-471, 1997. MOHAJERANI, M.; MEHRVAR, M.; EIN-MOZAFFARI, F. Nonlinear modeling for the degradation of aqueous azo dyes by combined advanced oxidation processes using artificial neural networks. Chemical Product and Process Modeling, v. 6, n. 1, Article 37, 2011. MONTGOMERY, D. C. Design and analysis of experiments. 6th ed. New Jersey: John Wiley and Sons, 2005. PANCHAL, G.; GANATRA, A.; SHAH, P.; PANCHAL, D. Determination of over-learning and over-fitting Maringá, v. 35, n. 3, p. 565-572, July-Sept., 2013
572
problem in back propagation neural network, International Journal on Soft Computing, v. 2, n. 2, p. 40-51, 2011. PANDEY, A.; SINGH, P.; IYENGAR, L. Bacterial decolorization and degradation of azo dyes. International Biodeterioration and Biodegradation, v. 59, n. 2, p. 73-84, 2007. ROBINSON, T.; McMULLAN, G.; MARCHANT, R.; NIGAM, P. Remediation of dyes in textile effluent: a critical review on current treatment technologies with a proposed alternative. Bioresource Technology, v. 77, n. 3, p. 247-255, 2001. SAHINKAYA, E.; UZA, N.; YETIS, U.; DILEK, F. B. Biological treatment and nanofiltration of denim textile wastewater for reuse. Journal of Hazardous Materials, v. 153, n. 3, p. 1142-1148, 2008. SILVEIRA E.; MARQUES, P. P.; SANTANA, J. C. C.; MAZZOLA, P. G.; PORTO, A. L. F.; TAMBOURGI, E. B. Experimental design for drcolourization of textile dye by Peseudomonas oleovorans. Research and Reviews in BioSciences, v. 3, n. 4, p. 183-190, 2009a. SILVEIRA, E.; MARQUES, P. P.; SILVA, S. S.; LIMAFILHO, J. L.; PORTO, A. L. F.; TAMBOURGI, E. B. Selection of Pseudomonas for industrial textile dyes decolourization. International Biodeterioration and Biodegradation, v. 63, n. 3, p. 230-235, 2009b. SOLEYMANIA, A. R.; SAIENA, J.; BAYATB, H. Artificial neural networks developed for prediction of
Acta Scientiarum. Technology
Prado et al.
dye decolorization efficiency with UV/K2S2O8 process. Chemical Engineering Journal, v. 170, n. 1, p. 29-35, 2011. ULSON DE SOUZA, S. M. A. G.; FORGIARINI, E.; ULSON DE SOUZA, A. A. Toxicity of textile dyes and their degradation by the enzyme horseradish peroxidase (HRP). Journal of Hazardous Materials, v. 147, n. 3, p. 1073-1078, 2007. YU, F.-B.; ALI, S. W.; GUAN, L.-B.; LI, S.-P.; ZHOU, S. Bioaugmentation of a sequencing batch reactor with Pseudomonas putida ONBA-17, and its impact on reactor bacterial communities. Journal of Hazardous Materials, v. 176, n. 1-3, p. 20-26, 2010. ZAREI, M.; KHATAEE, R. A.; ORDIKHANISEYEDLAR, R.; FATHINIA, M. Photoelectro-Fenton combined with photocatalytic process for degradation of an azodye using supported TiO2 nanoparticles and carbon nanotube cathode: Neural network modeling. Electrochimica Acta, v. 55, n. 24, p. 7259-7265, 2010.
Received on March 1, 2012. Accepted on June 1, 2012.
License information: This is an open-access article distributed under the terms of the Creative Commons Attribution License, which permits unrestricted use, distribution, and reproduction in any medium, provided the original work is properly cited.
Maringá, v. 35, n. 3, p. 565-572, July-Sept., 2013