A bottom-up approach based on semantics for the interpretation of the main camera stream in soccer games A. Cioppa, A. Deliège and M. Van Droogenbroeck University of Liège Institut Montefiore, Allée de la découverte 10, B-4000 Liège, Belgium
[email protected]
Abstract Automatic interpretation of sports games is a major challenge, especially when these sports feature complex players organizations and game phases. This paper describes a bottom-up approach based on the extraction of semantic features from the video stream of the main camera in the particular case of soccer using scene-specific techniques. In our approach, all the features, ranging from the pixel level to the game event level, have a semantic meaning. First, we design our own scene-specific deep learning semantic segmentation network and hue histogram analysis to extract pixel-level semantics for the field, players, and lines. These pixel-level semantics are then processed to compute interpretative semantic features which represent characteristics of the game in the video stream that are exploited to interpret soccer. For example, they correspond to how players are distributed in the image or the part of the field that is filmed. Finally, we show how these interpretative semantic features can be used to set up and train a semantic-based decision tree classifier for major game events with a restricted amount of training data. The main advantages of our semantic approach are that it only requires the video feed of the main camera to extract the semantic features, with no need for camera calibration, field homography, player tracking, or ball position estimation. While the automatic interpretation of sports games remains challenging, our approach allows us to achieve promising results for the semantic feature extraction and for the classification between major soccer game events such as attack, goal or goal opportunity, defense, and middle game. Index terms— semantic segmentation, soccer analysis, semantic classification, deep learning
1. Introduction The automatic interpretation of sports game is a challenging topic of research in the domain of computer-based
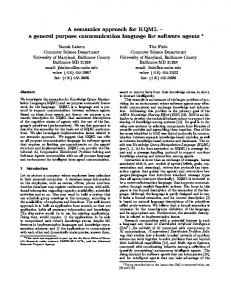
Figure 1. Overview of our scene-specific approach to extract semantic features from the video stream of the main camera in a soccer game. Three levels of semantic features are extracted: pixellevel semantics, interpretative semantic features which represent characteristics of the game in the video stream that are exploited to interpret soccer, and high-level semantics of the game event.
techniques [38]. It also offers many possibilities of commercial applications for the industry. For example, the automation of game statistics production can lead to tactical analysis systems from which teams and players can assess their performances. In order to achieve the goal of an automatic analysis, the first step is to have a system able to understand what is going on in the video stream in a way similar to how humans proceed. A lot of research has been carried out for sports, like soccer, whose content is interpreted by starting with the extraction of particular features. In that spirit, several works have focused on the extraction of pedestrians using universal methods [5, 29, 39, 40], and players in the case of sports along with scene-specific tracking techniques [11, 14, 21, 26, 42]. Other works aim
1878
at extracting the position of the ball in various types of sports [21, 24, 31, 36] or compute a homography of the field [10, 16, 28, 19]. The analysis of game events has also been addressed in projects such as Aspogamo [20], which is based on ball and players tracking methods using a field reconstruction model. Several works in the detection of specific game events have also been conducted [7, 8, 9, 15, 23, 35, 43]. Highlights detection has also been addressed in [33] using enhanced hidden Markov models and in [1] where the soccer’s semantics is encoded into a set of finite state machines. Finally, audio analysis of the excitement of commentators and detection of specific keywords in their speech has been investigated to detect important events in [41]. Recently, with the emergence of deep learning, supervised classification has become more accurate and robust and can be used in the sports domain to capture information on the content of the image. Universal networks appeared with the spread of extensive annotated datasets such as ImageNet [6] or MS COCO [25]. Semantic segmentation networks such as PSPNet [44] or Mask R-CNN [17] allow to segment any image into more than a hundred different classes. Semantic segmentation-based techniques have also been used in video segmentation in the case of background subtraction [3], which emphasizes the growing interest of semantics in video analysis. Universal networks are robust in many situations, but in soccer, the conditions do not vary much from one game to another. This is why we explore scene-specific techniques which generally perform better than universal techniques in constrained conditions [4, 30]. This paper presents an approach to extract semantic features from the video stream of the main camera without the need for camera calibration, field homography, ball position estimation, or player tracking. In fact, such information is often difficult to obtain in a robust way or is unavailable by the time of filming. We focus on the extraction of semantic features that have a meaning understandable by humans. First, we extract information at the pixel level corresponding to meaningful classes for the understanding of the video. In our case, these classes are the field, the players, and the lines. These pixel-level semantics are the basis for further analysis of the game sequence. The extraction of the pixellevel semantics is presented in Section 2. Once pixel-level semantics are obtained, we extract interpretative semantic features as described in Section 3. We concentrate on features that are also used by humans to understand the different soccer game events. To do so, we analyzed several soccer games in order to grasp what makes us comprehend when and why a particular type of game event is occurring. These interpretative semantic features represent characteristics of the game in the video stream that are exploited to interpret soccer which are meaningful for humans. For example, the part of the field that is shown or the
way the players move. Finally, we show that it is possible to set up a decision tree classifier for the game events whose structure is based on soccer semantics using the interpretative semantic features. We selected four major types of soccer game events: goal or goal opportunity, attack, middle game, and defense. In Section 4, we evaluate the different steps of our bottom-up approach and provide some observations. We conclude and present further prospects in Section 5.
2. Extraction of pixel-level semantics In this section, we explain how we classify the pixels of the image in three semantic classes, namely field, line and player pixels. Field pixels are obtained using a dynamic thresholding method based on the hue histogram of the image, while line and player pixels are obtained using a deep learning semantic segmentation network. This leads to the production of three segmentation maps corresponding to the classes of interest.
2.1. Extraction of field pixels The first method identifies the pixels that belong to the field. Knowing which pixels belong to the field is a valuable information since the portion of the field that is filmed is an indicator of where the game is taking place. In [21], a static field model has been used to extract the field, where the mean color is computed given prior statistics calculated on a large dataset. The method presented in [36] is based on the peak of the histogram of the three RGB channels in order to compute some field parameters. An adaptive field model using the peak in the green chromaticity space has also been investigated in [34] for the particular case of robot soccer. Our first step is to compute a field model based on the color of the field, and then compare each pixel to this model. Beforehand, we change the color space of the original image from RGB to HSV which is more informative on the color of a pixel. To compute the field model, we make the assumption that the field is present in a large part of the image, which is a reasonable assumption for images provided by the main camera. Since the hue component of the field is homogenous within the image, we compute the hue histogram of the whole image and search for a peak in it. This peak is located close to the mean value of the hue component of the field. We then threshold the image around this peak with a fixed width. This results in an intermediate binary map containing all the pixels whose value matches that of the field model. Figure 2 shows an image, its hue histogram, and the intermediate binary map obtained using the peak in the histogram. The histogram is recomputed for each frame in order to have a dynamical field model robust to illumination changes.
1879
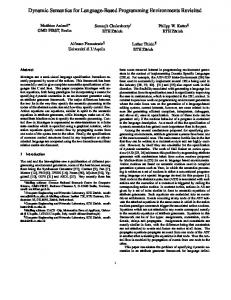
Figure 2. (a) Original image from which we extract the field pixels. (b) Hue histogram of the image. The peak corresponds to the dominant color, which we assume to be the mean color of the field. (c) Intermediate map obtained by thresholding the original image in its hue representation around the peak found in the histogram. (d) Final map of the field pixels obtained using post-processing operations on the intermediate map. These consist in morphological opening and closing operations, contour and area selection, contour approximation, and convex hull.
It is important to note that the audience in the stadium sometimes represents half of the image, but their colors have a greater variance than those of the field. In practice, we noticed that the peak in the hue histogram still corresponds to the mean hue component of the field even when the field is shown in less than 20% of the global image, which is due to its small variance in the hue component. Finally, several post-processing operations are applied on the intermediate binary map obtained at the previous step. First, morphological opening and closing operations with a 15 × 15 square structuring element are performed in order to remove small isolated objects located outside and inside the field, respectively. Then, the contours of all the objects within that mask are computed. From these contours, we choose the one that encompasses the greatest area to be the field. Then we compute an approximation of this contour using the method presented in [37], which is implemented in the OpenCV computer vision library [2]. This removes small bumps on the contour. We also compute the convex hull of this contour to remove small gaps on it. Finally all the pixels inside this contour are labeled as field pixels. The final result is illustrated in Figure 2.
2.2. Semantic segmentation for line and player pixels In this section, we present a novel lightweight deep learning semantic segmentation network designed to classify pixels belonging to lines or players. Semantic segmentation is an image segmentation technique that aims at labeling each pixel according to a finite set of classes. Many works are carried out in that field. Region proposal-based techniques such as DeepMask, SharpMask and RegionCNN developed by Facebook AI Research [32] are common approaches in semantic segmentation. More recently, deep learning networks have been developed such as PSPNet [44] or Mask R-CNN [17]. These networks automatically label each pixel according to hundreds of different classes. The architecture of the network that we developed is based on the same principles as the universal network PSP-
Net which is mainly composed of a pre-trained ResNet model that extracts the feature maps, a pyramidal pooling module to collect global context information [44], and an upsampling procedure. We designed a lightweight adaptation of this network in the scene-specific case of soccer. ResNet was introduced by He et al. [18]. The idea is that rather than directly approximating the input-output function as in conventional networks, the network approximate the residual function that has to be added to the input to give the correct output. To do so, ResNet modules have two branches, one performing non-linear operations to approximate the residual function and one that bypasses all the connections from the input. The underlying equation is then defined as: H(x) = F (x) + x,
(1)
where H(x) is the original function to approximate and F (x) is the residue that has been added to the input. An illustration of a typical ResNet module is shown in Figure 3. ResNet modules have the advantage of alleviating the problem of increased optimization difficulty when adding new layers in a network. The goal of the pyramidal pooling module introduced with PSPNet is to segment the image in regions of different sizes in order to retrieve context information. The module is composed of several branches which reduce the feature maps obtained by the ResNet module into regions by average pooling. In the original PSPNet network, the image is pooled into 1 × 1, 2 × 2, 3 × 3 and 6 × 6 regions, which are designed for square images of relatively low resolution, in order to get global information on what the scene represents. The network that we developed for this work is a scaled down version of the PSPNet network. In fact, PSPNet is meant to be used for universal segmentation, meaning that it must be robust for a large variety of scenes. In the particular case of soccer, we only have a few different classes compared to the hundreds of classes that PSPNet is capable to deal with. Also, the background and the objects of interest
1880
Figure 3. Typical ResNet module. The function H(x) is approximated using the input x and a residual function F (x).
are roughly the same from one game to another. By training the model only on images of soccer, that is by being scenespecific, we can further increase the performances of the network by discarding elements it will never see. This has the advantage of increasing the performances for our particular case while decreasing the complexity and the computation time of the network. To do so, we design one small ResNet module that we scale down in terms of number of parameters and remove some of the first convolutional layers. The pyramidal module is also adapted for the main camera of a soccer game. In our case, we have full-HD wide angle images rather than 473 × 473, meaning that the pooling module has to divide the image a bit more horizontally than vertically. We modify the pyramid pooling module to have 1 × 1, 3 × 2, 5 × 3 and 9 × 4 regions as shown on Figure 4, which illustrates the entire network. Finally, we train the whole network from scratch, meaning that we need to provide our own annotations of soccer games. By doing so, we managed to divide the number of parameters by a factor 100 compared to the original PSPNet which results in an drastic increase in training and prediction speed. As stated above, if we want the network to be scenespecific, we need to provide our own annotations which can be laborious and time-consuming since each pixel has to be labeled individually. For this reason, we decided not to implement a fine-grained semantic segmentation. In fact, annotating accurately each pixel belonging to players or lines would require too much effort. To alleviate this problem, we redefine our classification problem from pixels belonging exactly to a player or a line to pixels that are in the neighborhood of a player or a line. We will see in the next section that an approximate segmentation suffices to extract our interpretative semantic features. This drastically speeds up the annotation process since it can now be done with
blobs. With the annotation tool that we developed, it is possible to annotate 2 images/minute. Also, we noticed that impressive results can already be obtained with 180 images of a single game as training set with our network trained from scratch. Since we made a huge scale down compared to PSPNet, our network can be trained at a rate of 250 ms/image which corresponds to 45 seconds/epoch on our 180 image dataset. An example of annotation and the network’s segmentation for the lines and players can be seen in Figure 5. All these speeds up allow that, before a soccer game, an operator could start from a pre-trained network and retrain it with a few images annotated during the warm up period in order to make the network more scene-specific and improve its performances. Finally, if a finer segmentation is required, we can use the field model, computed in subsection 2.1, to remove field pixels from the segmentation around the lines and players.
3. Higher-level semantic features for game events classification In the previous section, we explained how to extract pixel-level semantics from soccer images. We now present an approach that derives interpretative semantic attributes based on the pixel-level semantics for game events classification. The choice for this bottom-up approach is motivated by the observation that humans can understand a soccer game just by looking at interpretative features visible in the image such as which part of the field is filmed or the direction in which the players move. Thus, we present a semantic-based approach for game event classification using a decision tree whose structure is chosen based on how humans interpret a soccer game, and show that this decision tree can be trained with only a few annotated data. In the first part of this section, we elaborate on how we choose the game events to classify, the interpretative semantic features and the structure of the decision tree. In the second part, we detail how we extract the interpretative semantic features used by the decision tree.
3.1. Decision mechanism For the design of the decision tree, we identified three important questions that summarize the information that underpins the decision: Question 1. Which interpretable game events do we want to classify? Question 2. Which interpretative semantic features are relevant for classifying or highlighting these events? Question 3. How do we incorporate the relevant interpretative semantic features in the event classification process?
1881
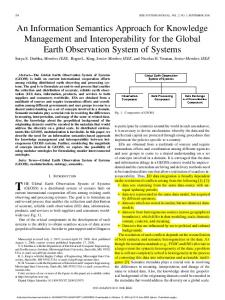
Figure 4. Overview of our semantic segmentation network architecture. We have four components: (a) the original image that will be segmented into lines or players, (b) a single ResNet module with convolution layers in order to extract the feature maps, (c) the pyramidal module to gather context information, and (d) the upsampling procedure that produces the final segmentation map, here showing the player segmentation. The network is inspired by the design of the PSPNet network [44].
Let us note that, as a future step, it would be worth investigating how to split these classes in order to include subclasses of these game events such as the corner or the free kick, which are sub-classes of the attack game event, or the clearance from the goal keeper, which is a sub-class of the defense game event. With respect to question 2, we identified which interpretative semantic features are representative of the aforementioned game events. We analyzed several soccer game events and determined what visually discriminates them. From our experience, we concluded that we can accurately separate the four major soccer game events with the four following types of interpretative semantic features: • A ternary indicator corresponding to which portion of the field is filmed.
Figure 5. Semantic segmentation results. (a) Original image on which to segment the lines and players. (b) Annotations corresponding to pixels that are in the neighborhood of players or lines in order to increase the speed of the annotation process. (c) Segmentation results obtained with our scene-specific semantic segmentation network. (d) Original image masked by the segmentation result for visualization purpose.
• A binary indicator corresponding to the presence of the main circle in the image. • A continuous groupment measure corresponding to how much the players are close relative to each other. • A binary motion indicator (towards the center of the field / towards the goal or static position) corresponding to the average motion in the horizontal direction of the players.
With respect to the first question, we choose to restrict ourselves to the detection of four major classes of game events in a soccer game, which are described hereafter: 1. Attack: when a team is approaching the great rectangle of the other team. 2. Defense: when the team having the ball is close to its own great rectangle. 3. Middle game: when one of the two teams is close to the main circle and the players simply pass the ball from one to another with no real intention of going towards the goal. 4. Goal or goal opportunity: when there is an interesting action that could lead or has led to a goal.
More details on how we compute these indicators are provided in Section 3.2. To answer question 3, we made the choice to design a decision tree based on the semantics of a soccer game. We decided to avoid working with fully supervised machine learning techniques since annotated data of game events are hard to collect and to label manually for an entire sequence. On top of that difficulty, it is often troublesome to have a precise label on the game event since game events do often overlap in time, so that the choice of a frame splitting two consecutive game events is not unique. For this reason, we found it appropriate to design a decision tree with a fixed hand-made
1882
structure induced by the semantics of the soccer game. In this way, we ensure that the tree structure does not overfit the limited amount of training data and that the interpretation is consistent with an intuitive human interpretation of the game. Besides, this leaves room for further extensions based on additional semantic features or other game events. After some tests, we have built the final decision tree structure displayed in Figure 6. Given the restricted number of trainable thresholds to determine, their optimal values are learned by minimizing the classification error using a grid search procedure.
3.2. Interpretative semantic features In this section, we provide details on how we compute the interpretative semantic features that are used by the decision tree to classify game events. These features are based on the pixel-level semantics computed in Section 2. First, we present how we extract information from the field segmentation map. Then, the line segmentation map is used to compute the presence and coordinates of the main circle on the image. Finally, we extract three interpretative semantic features from the players segmentation map: a groupment measure of the players, the average position of the players, and the average direction of the players’ motion. The first interpretative semantic feature that we extract is the part of the field that the camera is filming. We are interested by where the camera is pointing at, horizontally. We define three different types of views which are also shown in Figure 7 with their corresponding field segmentation maps: • Center view: the camera is mainly centered on the field. It is characterized by a single separation in the field segmentation map which has a small angle compared to the horizontal. • Side view: the camera is clearly filming one side or the other of the field. It is characterized by the presence of a corner in the field segmentation map. • Goal view: the camera is zooming in on one of the two goals. It is characterized by a single separation in the field segmentation map which is almost diagonal compared to the horizontal. To compute the presence of a corner or the orientation of the separation, we start by computing what we call the “characteristic line” of the field segmentation map which is defined as the line that joins the two uppermost intersections between the black and white separations at the edges of the image. Examples of such characteristic lines are shown in red in Figure 7. To know if there is a corner in the field segmentation map, we compare the ratio of white pixels on each part of the characteristic line. If the ratio is greater than some learned threshold, then there is a corner. If no
corner is found in the previous step, then the tilt of the characteristic line is computed. If this tilt is greater than some other learned threshold, then it is a goal view; otherwise it is a center view. The second interpretative semantic feature that we extract is the main circle. This main circle is projected as an ellipse on the main camera image and is present in the line segmentation map found in Section 2.2. The ellipse is extracted using the RANSAC algorithm [12]. This algorithm is used in many works for geometric fitting [22, 27]. The principle of RANSAC is to randomly select a subset of the data points and to fit a model on this subset. Then, all the data points are tested through a distance threshold function that determines whether a particular point agrees with the created model or not. The points that agree with the model are called inliers. Finally, a score function evaluates how well the model fits the original data. This procedure is repeated several times and the model that has the greatest score is selected and re-estimated using all the inliers of its model. In our case, the distance function is a threshold on the distance of a point to the ellipse, and the model is built using the robust ellipse fitting method of Fitzgibbon [13]. Finally, we check that this ellipse is in the range of plausible ellipses. The last interpretative semantic features are extracted from the player segmentation map computed in Section 2.2. The first one is the barycenter of the players. It is straightforward to get such information from the player binary map since it consists in computing the barycenter of all player pixels. The fact that we have only access to pixels that are close to players is not a problem since these surrounding pixels are spread uniformly around the players. The second one is a groupment measure that represents how much the players are close one to another. To estimate the groupment measure, we compute the mean squared distance of each point to the barycenter. The players are considered as grouped when this value is smaller than some learned threshold and as scattered otherwise. For the last interpretative semantic feature, which is the average horizontal direction of the players from a moving camera, we need the horizontal difference between the barycenter of the players and a reference point. Since we do not compute a homography or use calibrated cameras, we use one of the two following reference points, depending whether which one is visible in the image: the center of the main circle that we extracted or the end of the field segmentation map behind the goals.
4. Experiments We evaluate the extraction of the pixel-level semantics and the game event decision tree presented in our approach on the 2015 Champions League final soccer game. The data consists of a single full-HD video stream of the event. The deep learning models for semantic segmentation are trained
1883
Figure 6. Structure of the semantic-based decision tree. The questions are chosen based on interpretative semantic features that can be robustly obtained from the pixel-level semantics.
sensitivity =
TP . TP + FN
(2)
We also evaluate the ratio of the field that is uncovered, which is represented by the specificity: specif icity =
Figure 7. Examples of the three different types of views (left) and their field segmentation maps (right) with the characteristic line shown in red. (a) Center view with its characteristic horizontal line of separation. (b) Side view, with the presence of a corner in the binary map. (c) Goal view, with the diagonal separation.
on 180 images and tested on 20. For evaluating the quality of the decision tree, we have trained and determined its parameters and thresholds (there are 5 of them) on one half time of the game, and evaluated the decisions on the other half. Finally a temporal smoothing on the last ten frames is applied on the indicators of the interpretative semantic features and the game event classification result using either a majority vote when the indicator is discrete or a moving average procedure when it is continuous.
4.1. Pixel-level semantics evaluation We first evaluate the field segmentation map. The goal is to cover as much as possible the field and avoid its surroundings. To evaluate the method, we choose a criterion that evaluates the proportion of the surface of the actual field that is covered by the segmentation, i.e. the sensitivity:
TN , TN + FP
(3)
where T P is the number of true positives, T N the number of true negatives, F P the number of false positives and F N the number of false negatives. The performances are evaluated on approximately 25 million pixels. As can be seen in Table 1, almost all the field is covered and the surroundings are rarely mistaken as well. Also, a visual inspection of the results showed us that our approach works well. Small errors occur only at the exact edge of the field. Next, we evaluate the semantic segmentation networks for the lines and players. We defined that the goal of our semantic segmentation is to label pixels that are in the neighborhood of lines or players rather than belonging exactly to a line or a player. Thus, we need a criterion that evaluates the proportion of correctly classified line or player pixels among all the pixels classified as line or players. It is important not to have too many false positives outside the neighborhood polluting the segmentation map. This criterion is called the precision and is given by: precision =
TP . TP + FP
(4)
Table 2 shows some performance indicators for the lines and players segmentation which are evaluated on approximately 45 million pixels. As it can be seen, the performances are high even with few training images. This confirms that an operator can annotate a few frames before the game in order to make the network more scene-specific and improve its performances compared to universal networks. The training is also fast as it can be done at a rate of 45 seconds/epoch with impressive results achieved after
1884
Performance indicators Sensitivity Specificity Accuracy Computation time
Field pixels 0.997 0.990 0.994 30 ms/image
Table 1. Performance indicators for our field pixel extraction method using the hue histogram of the image. The results are evaluated on approximately 25 million pixels.
Performance indicators Precision Accuracy Computation time
Player pixels Line pixels 0.904 0.819 0.989 0.987 78 ms/image
Table 2. Performance indicators for our scene-specific semantic segmentation network of the performance indicators for player and line pixels. The results are evaluated on approximately 45 million pixels.
only 75 epochs with a network trained from scratch on a single GPU. Furthermore, the modifications allow the network to segment full-HD images coming from the main camera at a framerate of 12.5 images per second on a single GPU, including the time needed to transfer the data to the GPU and get it back. It is thus possible to achieve real-time performances of 25 frames per second on two parallel GPUs which is an affordable set-up these days.
4.2. Game events classification evaluation In order to evaluate quantitatively the whole system, we annotate a few clips from one half time of the game and tested the decision tree on the clips of the other half time. These clips contain the different game events that are presented in this work. We evaluate here the output of the whole semantic-based decision tree. For the four major types of soccer game events, we have an accuracy of 91.8% which is evaluated on 20, 000 frames taken from 20 small clips of the 2015 Champions League final. Apart from the quantitative evaluation, it is also interesting to analyze the results qualitatively. In fact, the annotations do not always correspond to clear game events because, sometimes and for some pairs of events, it is difficult to assign a unique event label for frames that separate two consecutive game events. For example, the difference between an attack and a middle game can be tricky since an attack can start from the middle of the field. Thus, two annotators could assign a different label to the same game event. For that purpose, it is important to look at the output sequences and have a global qualitative estimation of the system as well, which is why we will provide a video sequence of the entire system on a soccer game event that includes all four types of game events.
5. Conclusions In this paper, we presented a bottom-up approach to extract semantic features from the video stream of the main camera in a soccer game. Our approach does not need camera calibration, field homography, player tracking, or ball position estimation, since these are often hard to get robustly or are unavailable. We first extract pixel-level semantics by segmenting three types of classes in the image: the field, which is found using a thresholding method based on the hue histogram, and the lines and players which are extracted using our novel, tailored, scene-specific deep learning semantic segmentation network. Then, we show how to extract interpretative semantic features based exclusively on important characteristics of the game present in the video stream that are exploited to interpret soccer: the part of the field that is shown, the extraction of the main circle, the mean position and direction of the players and an information on the groupment of the players. From these, we show that it is possible to learn the parameters of a decision tree with a pre-defined semantic-based structure to classify the following major soccer game events: goal or goal opportunity, attack, middle game and defense, for which we got over 90% of classification accuracy. Future work The approach that we presented in this paper is far from being a solved subject of research. The list of semantic features and types of game events to classify that we presented is not exhaustive. With an increased amount of labeled data, it should be possible to improve both the extraction of semantic features and the decision mechanism for game events classification. For instance, the structure of the decision tree could be learned. More sophisticated models such as deep learning temporal networks could also be used. This could allow the classification of more complex game events such as the corner, the free kick or the clearance. Acknowledgments A. Cioppa has a grant funded by the FRIA, Belgium. The research of A. Deliège is supported by the DeepSport project of the Walloon region, Belgium.
References [1] J. Assfalg, M. Bertini, C. Colombo, A. D. Bimbo, and W. Nunziati. Semantic annotation of soccer videos: automatic highlights identification. Comp. Vision and Image Understanding, 92(2-3):285–305, Nov.-Dec. 2003. [2] G. Bradski. The OpenCV Library. Dr. Dobb’s Journal of Software Tools, 2000.
1885
[3] M. Braham, S. Piérard, and M. Van Droogenbroeck. Semantic background subtraction. In IEEE Int. Conf. Image Process. (ICIP), pages 4552–4556, Beijing, China, Sept. 2017. [4] M. Braham and M. Van Droogenbroeck. Deep background subtraction with scene-specific convolutional neural networks. In IEEE Int. Conf. Syst., Signals and Image Process. (IWSSIP), pages 1–4, May 2016. [5] N. Dalal and B. Triggs. Histograms of oriented gradients for human detection. In IEEE Int. Conf. Comput. Vision and Pattern Recogn. (CVPR), volume 1, pages 886–893, San Diego, USA, June 2005.
[15] X. Gao, Z. Niu, D. Tao, and X. Li. Non-goal scene analysis for soccer video. Neurocomputing, 74(4):540–548, Jan. 2011. [16] A. Gupta, J. Little, and R. Woodham. Using line and ellipse features for rectification of broadcast hockey video. In Canadian Conf. Comput. and Robot Vision (CRV), pages 32–39, St. Johns, Canada, May 2011. [17] K. He, G. Gkioxari, P. Dollar, and R. Girshick. Mask R-CNN. CoRR, abs/1703.06870, 2018. [18] K. He, X. Zhang, S. Ren, and J. Sun. Deep residual learning for image recognition. CoRR, abs/1512.03385, 2015.
[6] J. Deng, W. Dong, R. Socher, L. Li, K. Li, and L. FeiFe. ImageNet: A Large-Scale Hierarchical Image Database. In IEEE Int. Conf. Comput. Vision and Pattern Recogn. (CVPR), pages 248–255, Miami, Florida, USA, June 2009.
[19] N. Homayounfar, S. Fidler, and R. Urtasun. Sports field localization via deep structured models. In IEEE Int. Conf. Comput. Vision and Pattern Recogn. (CVPR), pages 4012–4020, Honolulu, HI, USA, July 2017.
[7] T. D’Orazio, M. Leo, P. Spagnolo, P. Mazzeo, N. Mosca, M. Nitti, and A. Distante. An investigation into the feasibility of real-time soccer offside detection from a multiple camera system. IEEE Trans. Circuits and Syst. for Video Technol., 19(12):1804–1818, Dec. 2009.
[20] M. B. N. Hoyningen-Huene, B. Kirchlechner, S. Gedikli, F. Silesand, M. Durus, and M. Lames. Aspogamo: Automated sports game analysis models. International Journal of Computer Science in Sport, 8(1):1–21, 2009.
[8] T. D’Orazio, M. Leo, P. Spagnolo, M. Nitti, N. Mosca, and A. Distante. A visual system for real time detection of goal events during soccer matches. Comp. Vision and Image Understanding, 113(5):622–632, May 2009. [9] A. Ekin, A. Tekalp, and R. Mehrotra. Automatic soccer video analysis and summarization. IEEE Trans. Image Process., 12(7):796–807, July 2003. [10] D. Farin, S. Krabbe, and W. E. et.al. Robust camera calibration for sport videos using court models. In Storage and Retrieval Methods and Applications for Multimedia, volume 5307 of Proceedings of SPIE, pages 80–92, Dec. 2003. [11] P. Figueroa, N. Leite, and R. Barros. Tracking soccer players aiming their kinematical motion analysis. Comp. Vision and Image Understanding, 101(2):122– 135, Feb. 2006. [12] M. Fischler and R. Bolles. Random sample consensus: a paradigm for model fitting with applications to image analysis and automated cartography. Commun. of the ACM, 24(6):381–395, June 1981. [13] A. Fitzgibbon and R. Fisher. A buyer’s guide to conic fitting. DAI Research paper, 1996. [14] R. Gade and T. Moeslund. Constrained multi-target tracking for team sports activities. IPSJ Trans. Comp. Vision and Appl., 10(1):1–11, Jan. 2018.
[21] Y. Huang, J. Llach, and S. Bhagavathy. Players and ball detection in soccer videos based on color segmentation and shape analysis. In Multimedia Content Analysis and Mining, volume 4577 of Lecture Notes Comp. Sci., pages 416–425. Springer, 2007. [22] K. Ingersoll. Vision based multiple target tracking using recursive RANSAC. Master’s thesis, Brigham Young University, Mar. 2015. [23] Y. Kang, J. Lim, Q. Tian, and M. Kankanhalli. Soccer video event detection with visual keywords. In Joint Conference of the International Conference on Information, Communications and Signal Processing, and Pacific Rim Conference on Multimedia, volume 3, pages 1796–1800, Singapore, Dec. 2003. [24] D. Liang, Y. Liu, Q. Huang, and W. Gao. A scheme for ball detection and tracking in broadcast soccer video. In Pacific Rim Conference on Multimedia (PCM), pages 864–875, Jeju Island, Korea, Nov. 2005. [25] T. Lin, M. Maire, S. Belongie, J. Hays, P. Perona, D. Ramanan, P. Dollár, and L. Zitnick. Microsoft coco: Common objects in context. In Eur. Conf. Comput. Vision (ECCV), volume 8693 of Lecture Notes Comp. Sci., pages 740–755. Springer, 2014. [26] M. Manafifard, H. Ebadi, and H. Moghaddam. A survey on player tracking in soccer videos. Comp. Vision and Image Understanding, 159:19–46, June 2017. [27] F. Mufti, R. Mahony, and J. Heinzmann. Robust estimation of planar surfaces using spatio-temporal
1886
RANSAC for applications in autonomous vehicle navigation. Robotics and Autonomous Syst., 60(1):16–28, Jan. 2012. [28] S. Nam, H. Kim, and J. Kim. Trajectory estimation based on globally consistent homography. In Comput. Anal. Images and Patterns, volume 2756 of Lecture Notes Comp. Sci., pages 214–221. Springer, 2003. [29] C. Papageorgiou and T. Poggio. Trainable pedestrian detection. In IEEE Int. Conf. Image Process. (ICIP), volume 4, pages 35–39, Kobe, Japan, Oct. 1999. [30] P. Parisot and C. D. Vleeschouwer. Scene-specific classifier for effective and efficient team sport players detection from a single calibrated camera. Comp. Vision and Image Understanding, 159:74–88, June 2017. [31] G. Pingali, A. Opalach, and Y. Jean. Ball tracking and virtual replays for innovative tennis broadcasts. In IEEE Int. Conf. Pattern Recogn. (ICPR), volume 4, pages 152–156, Barcelona, Spain, Sept. 2000. [32] P. Pinheiro, R. Collobert, and P. Dollar. Learning to segment object candidates. In Adv. in Neural Inform. Process. Syst. (NIPS), volume 2, pages 1990–1998, Montreal, Canada, Dec. 2015. [33] X. Qian, G. Liu, H. Wang, Z. Li, and Z. Wang. Soccer video event detection by fusing middle level visual semantics of an event clip. In Advances in Multimedia Information Processing, volume 6298 of Lecture Notes Comp. Sci., pages 439–451. Springer, 2010.
[39] P. Viola, M. Jones, and D. Snow. Detecting pedestrians using patterns of motion and appearance. In IEEE Int. Conf. Comput. Vision (ICCV), volume 2, pages 734– 741, Nice, France, Oct. 2003. [40] B. Wu and R. Nevatia. Detection of multiple, partially occluded humans in a single image by Bayesian combination of edgelet part detectors. In IEEE Int. Conf. Comput. Vision (ICCV), volume 1, pages 90–97, Beijing, China, 2005. [41] M. Xu, N. Maddage, and C. Xu. Creating audio keywords for event detection in soccer video. In IEEE Int. Conf. Multimedia and Expo (ICME), volume 2, pages 281–284, Baltimore, USA, July 2003. [42] Y. Yang and D. Li. Robust player detection and tracking in broadcast soccer video based on enhanced particle filter. J. of Visual Communication and Image Representation, 46:81–94, July 2017. [43] H. Zawbaa, N. El-Bendary, A. Hassanien, and A. Abraham. Svm-based soccer video summarization system. In Third World Congress on Nature and Biologically Inspired Computing (NaBIC), pages 7–11, Oct. 2011. [44] H. Zhao, J. Shi, X. Qi, X. Wang, and J. Jia. Pyramid scene parsing network. In IEEE Int. Conf. Comput. Vision and Pattern Recogn. (CVPR), pages 6230–6239, Honolulu, USA, July 2017.
[34] Y. Qian and D. Lee. Adaptive field detection and localization in robot soccer. In RoboCup 2016, volume 9776 of Lecture Notes Comp. Sci., pages 218–229. Springer, 2016. [35] V. Ramanathan, J. Huang, S. Abu-El-Haija, A. Gorban, K. Murphy, and L. Fei-Fei. Detecting events and key actors in multi-person videos. In IEEE Int. Conf. Comput. Vision and Pattern Recogn. (CVPR), pages 3043–3053, Las Vegas, USA, June 2016. [36] Y. Seo, S. Choi, H. Kim, and K.-S. Hong. Where are the ball and players? soccer game analysis with colorbased tracking and image mosaick. In Int. Conf. Image Anal. and Process. (ICIAP), pages 196–203, Florence, Italy, Sept. 1997. Springer. [37] S. Suzuki and K. Abe. Topological structural analysis of digitized binary images by border following. Comp. Vision, Graph., and Image Process., 30(1):32– 46, Apr. 1985. [38] G. Thomas, R. Gade, T. Moeslund, P. Carr, and A. Hilton. Computer vision for sports: current applications and research topics. Comp. Vision and Image Understanding, 159:3–18, June 2017.
1887