Finally, a small review of the field of sensor location is performed. ..... This explains why combinations of introduced gross errors like S1-S6, S2-S4, S1-S3 leads.
Latin American Applied Research
30:335-342 (2000)
A BRIEF REVIEW OF RECENT DEVELOPMENTS IN DATA RECONCILIATION AND GROSS ERROR DETECTION/ESTIMATION. M. J. BAGAJEWICZ University of Oklahoma, 100 E. Boyd St, T-335, Norman, OK 73072
Keywords: data filtering, data reconciliation, gross error detection Abstract This paper presents a brief review of the status of the field of data reconciliation. Techniques to perform gross error detection are outlined. A recently published theory on equivalency of gross errs and its impact on the ability to identify instrument bias and leak is outlined. Finally, a small review of the field of sensor location is performed.
1. Data Reconciliation Data filtering and reconciliation has been used for several years as means of obtaining accurate and consistent data in process plants. Early work in dynamic data reconciliation is rooted in the problem of process state estimation using the concept of filtering. Lately, the problem has been solved using the concept of model based data smoothing. Consider the three types of state estimation problems that are illustrated in figure 1. Assume an estimation of the state of the system is desired at time t.
a model. Thus, as measurements contain errors, they need to be adjusted. Data Reconciliation is a term used to refer to the problem of correcting plant measurements (Flowrates, Temperatures, Pressures, Concentrations, etc) so that they conform to a certain chosen model. Usually, this model is given by a mathematical relation, typically a set of differential algebraic equations (DAE),
dx1 = g1( x1 , x 2 ) dt
(1)
g 2 ( x1 , x 2 ) = 0
(2)
The general data reconciliation problem is stated as follows: When a statistical approach is taken, the problem of Given a set of measurement values of a subset of state variables z M = ( z M ,1 , z M , 2 ) it is desired to obtain the best estimate of these measured state variables ~ x M and as many of the unmeasured ~ variables xU as possible. reconciliation consists of minimizing the weighed square of the difference between the measurements zM
x M at the N instances of time at and the estimates ~ which the measurements were made, using as weight the variance of the measurements Q. That is, to solve the following optimization problem:
Fig. 1. Types of estimation (adapted from Gelb, 1974) When only measurement values prior to the time of prediction t are used, including the measurement at time t, the estimation is called filtering. When time t is not included, the estimation is called prediction, and finally, when data for times larger than t is used the estimation process is called smoothing. Finally, when discrete measurements are used the estimators are called discrete estimators.
N
Min ∑ [ a M ,k ]T Q −1[ a M ,k ] k =0
s.t.
d~x1 x1 , ~x2 ) = g1 ( ~ dt g (~ x , x~ ) = 0
Kalman filtering (1960) deals with the problem of filtering, that is producing estimates at time t. Data Reconciliation deals with the problem of smoothing, using the condition that variables are connected through
2
1
2
a M , k = x~M (t k ) − z M ,k 335
(3)
Latin American Applied Research
30:335-342 (2000)
This least square problem can be derived from Bayesian theory using the assumption that the distribution of errors is normal. The reader can refer to the work done by Johnston and Kramer (1995) for a maximum likelihood derivation of the steady state linear reconciliation model. In addition, Crowe (1996) showed that the same result can be derived using information theory. For the case where steady state is assumed, only one measurement is used, usually an average of several measurements. In addition, in some cases, accumulation terms, especially hold-up changes in tanks, are still included.
1.1 Steady State Linear Data Reconciliation We now analyze the solution of the linear data reconciliation problem. Consider the case where no hold-up change takes place or negligible hold up is assumed. In such case only flowrates are estimated. Therefore, we write the problem as follows
~
•
Identify the gross errors location
•
Identify the gross error type
•
Determine the size of the gross error.
There exists at least one method that allows the detection of the existence of gross errors. Some of the methods for gross error identification are to a certain extent capable of discerning the location and type. After the gross errors are identified, two responses are possible and/or desired: •
Eliminate the measurement containing the gross error, or
•
Correct the measurements or the model and run the reconciliation again.
(4) 2.1 Test for Gross Error Presence
~ D f =0 where f contains
Identify the existence of gross errors
The first alternative is the one implemented in commercial software, which only considers biases. This leaves the system with a smaller degree of redundancy and, as we saw, the precision of the reconciled variables deteriorates.
~ + T −1 ~ + Min [ f M − f M ] Q [ f M − f M ] s.t.
•
Testing for gross errors is based on the statistical principles of hypothesis testing. We here present the three most popular tests. is the vector of reconciled flows, which measured and unmeasured flows.
Global Test: The null hypothesis H 0 is that there is no gross error. Let r be the vector or residuals of the material balances, that is r=CR z, where z are the flowrate measurements. Then, the expected value of r is E(r)=0, and the covariance matrix of r is Cov( r)=
~ ~ ~ T f = [ f M fU ] .
Various techniques have been developed to convert the above problem into one containing measured variables only. These consist of Matrix Projection (Crowe et al., 1983), Q-R decomposition (Swartz, 1989; Sanchez and Romagnoli, 1996) and Gauss Jordan rearrangement of D (Madron, 1992).
T
CRQR C R , where QR is the covariance matrix of random measurement errors. In the absence of gross errors, the following variable
χ m2 = r (C R QR C RT ) −1 r
Non-linear version of this problem including the reconciliation of temperatures and even pressure measurements exist and are very successful and robust in practice. Several commercial packages exist (DATACON form Simsci, Sigmafine from OSI, RtOpt from Aspentech, etc). Dynamic reconciliation is still eluding engineering practice, although some attempts are being made.
(5)
follows a Chi-squared distribution with m degrees of freedom ( χ m,α ), where m is the number of rows of CR. This number can be obtained before even performing data reconciliation. If it falls within the interval of confidence, that is, if it is lower than a certain critical value, then the null hypothesis is accepted. On the other hand, if it is larger than the critical value, it is said that a gross error has been detected. 2
2. Gross Error Detection To be able to perform this efficiently, gross errors (instrument biases and leaks), which behave differently than random noise have to be filtered, that is either eliminated, or estimated. Two central issues are of concern: proper location of gross errors and estimation of their sizes. Thus, the challenging task is to 336
Remark: The global test cannot determine where is the gross error or how many are there. Measurement Test: It is based on the vector of measurement adjustments (or corrections) ~ + a = FR − FR , where a is the vector of measurement adjustments. The test is based on the assumption that the
M. J. BAGAJEWICZ
detection of one gross error. However, when more gross errors exist, strategies are needed to identify them. This area of multiple gross error detection, identification and estimation has been the object of several papers in the last twenty years.
random errors for measurements are independently and normally distributed with zero mean. Under the null hypothesis, H 0 , the expected value of a is E a = 0
( )
ˆ . Thus, and the covariance matrix of a is Cov (a) = Q R the following variable is expected to follow a normal distribution N(0,1).
ηi =
ai Qˆ R
( )
One of the first strategies proposed is serial elimination (Ripps, 1965), which consists of coupling a certain test with an elimination strategy. If the test failed, then a strategy is proposed to identify one or more variables, which are the "most suspected ones". The measurements of these variables are eliminated and the test is run again. Commercial versions of this procedure (DATACON, SIGMAFINE) eliminate one measurement at a time and use the measurement test or similar. The procedure has been the object of several variations of the original scheme (Romagnoli and Stephanopoulos, 1980, Rosenberg et al., 1987; Iordache et al., 1985).
(6)
ii
Thus, if no gross error is present the above value should be lower than a critical value. If α is the confidence level, then this critical value xα/2. is obtained directly from the normal distribution tables xα/2. Several studies, modifications and improvements have been proposed for this test (Mah and Tamhane, 1982, 1987; Crowe et al., 1983)
Gross Error Size Estimation
Nodal Test: In the absence of gross errors the constraint residuals r follow a m-variate normal distribution (m is the rank of CR). Therefore
φi =
ri (C R QR C RT ) ii
Once the gross errors have been identified, it is desired to determine their size. There are several methods that have been developed in recent years to perform this. When one gross error is present, Madron proposed an expression based on the statistical
(7)
T
−1
r (C R QR C R ) r . However, in the properties of presence of multiple gross errors these formulas do not apply.
follows a standard normal distribution, N(0,1), under H 0 . If φi is larger than the critical value based on a confidence level α, then one concludes that there is at least one gross error in the set of measurement that participates in the corresponding node balance. Other tests used specifically for gross error exists. Among the most popular, are the generalized likelihood ratio (Narasimhan and Mah, 1986, 1987, 1988), principal component tests (Tong and Crowe, 1995) and the Bonferroni tests (Rollins and Davis, 1992).
2.2 Inaccuracy in Gross Error Detection The following are the types of errors that one can incur while doing the hypothesis testing above proposed. Type I Error: A gross error is identified, while in reality there is none. Type II Error: A gross error exists but is not identified. Of these two, the first one is rather harmless, as an elimination of a variable that does not contain a gross error results only in loss of precision. However, when a gross error is not detected, smearing persists and all the results are corrupted.
2.3 Multiple Gross Error Identification The tests described above are suitable for the 337
Several techniques have been developed to identify and estimate the size of gross errors. Serial Elimination (Ripps, 1965; Serth and Heenan, 1986; Rosenberg, et al., 1987) identifies one gross error at a time using a test statistic and eliminates the corresponding measurement until no gross error is detected; Serial Compensation (Narasimhan and Mah, 1987) identifies one gross error at a time and estimates its size, compensates the measurement and continues until no error is found. These two techniques have proven to be relatively efficient when one gross error is present, but do not perform well in the presence of multiple gross errors. Serial elimination does not address leaks (Mah, 1990). Serial Compensation is applicable to all types of gross errors and can maintain redundancy during the procedure but its results are completely dependant on the accuracy of estimation for the size of gross errors (Rollins and Davis, 1992). To improve these methods, simultaneous or collective compensation proposes the estimation of all gross errors simultaneously. Rollins and Davis (1992) proposed an unbiased estimation technique (UBET), which relies heavily on the identification of candidate gross errors performed by other methods. Keller et al. (1994) proposed the successive application of the generalized likelihood ratio with collective compensation of all candidates at each step; Kim et al. (1997) proposed a modified Iterative Measurement Test (MIMT) using nonlinear programming (NLP) techniques; Sánchez and
Latin American Applied Research
30:335-342 (2000)
Romagnoli (1994) proposed a combinatorial approach to pick candidates and use them in a compensation model based on the use of the global test; Bagajewicz and Jiang (1998) proposed the successive use of a statistical test to identify one gross error at a time and independently developed a compensation model which is identical to the one presented by Sánchez and Romagnoli (1994).
•
UBET (Rollins and Davis, 1992), as modified by Bagajewicz et al. (1999).
•
SICC (Jiang and Bagajewicz, 1999)
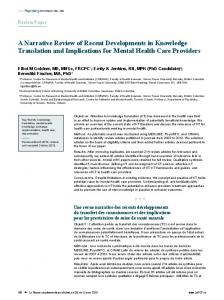
assume that all streams are measured. As shown in Table 1, a bias of (-2) in S4 and a bias of (+1) in S5 (Case 1) can be represented by two alternative sets of two gross errors (Cases 2 and 3). By applying this theory, one can see that any proposed set of gross error candidates cannot form a loop. Otherwise the size of these gross errors is indeterminate, a condition that leads to singularities. This explains why combinations of introduced gross errors like S1-S6, S2-S4, S1-S3 leads so easily to singularities: The addition of just one stream to these sets can lead to a loop. Take for example the combination of simulated gross errors S1-S6: just the addition of stream S2 will form a set with a loop through the environmental node. The addition of stream S5 to the set {S2, S4} also forms a loop.
•
MSEGE (Sanchez et al., 1999)
Degenerate Cases
Of all the methods that have been developed, three have been identified as the most efficient. They are:
These techniques cannot however overcome a limitation that is inherent to the problem, which is the uncertainty of gross error location. This will be explained next.
The equivalencies above are built in the assumption that the number of gross errors identified is equal to the real number of gross errors. However, there are examples where the actual number of gross errors can be larger than the number of gross errors identified. One such example is shown in Table 2, where a set of two gross errors (Case 1) is equivalent to one gross error (Case 2). These cases are rare, as they require that the two real gross errors have equal sizes. This poses an additional uncertainty. If a certain number of gross errors are detected, there is a possibility that the actual number of gross errors is larger. Degenerate cases are, however, more frequent in the case of the presence of leaks. Indeed, take again the example of Figure 1. A leak of a certain size in unit U1 can be represented by a set of equal in size (but opposite sign) biases in streams S2 and S3. If one chooses to perform the candidate identification step using a bias detection test (like the measurement test for example), then one is likely to identify these degenerate cases.
3. Equivalency Theory This theory was recently presented by Bagajewicz and Jiang (1998). It basically states that two sets of gross errors are equivalent when they have the same effect in data reconciliation, that is, when simulating either one in a compensation model, leads to the same value of objective. Therefore, the equivalent sets of gross errors are theoretically undistinguishable. In other words, when a set of gross errors is identified, there exists an equal possibility that the true locations of gross errors are in one of its equivalent sets. From the view of graph theory, equivalent sets exist when candidate stream/leaks form a loop in an augmented graph consisting of the original graph representing the flowsheet with the addition of environmental node. For example, consider the process of Figure 2 and
Fig. 2. Illustration of Gross Error Equivalency
338
M. J. BAGAJEWICZ
Table 1: Illustration of Equivalent Sets in {S2, S4, S5 } of Figure 2
Measurements Case 1
Reconciled data
S1
S2
S3
S4
S5
S6
12
18
10
4
7
2
12
18
10
6
6
2
-2
1
7
7
2
4
2
(Bias in S4, S5) Estimated biases Case 2
Reconciled data
12
19
10
(Bias in S2,S4) Estimated biases Case 3
Reconciled data
-1 12
-3
16
10
4
(Bias in S2,S5) Estimated biases
2
3
Table 2: Illustration of Degenerate Cases in {S2, S4, S5} of Figure 2
Measurements Case 1
Reconciled data
S1
S2
S3
S4
S5
S6
12
18
10
7
7
2
12
18
10
6
6
2
1
1
7
7
(Bias in S4, S5) Estimated biases Case 2
Reconciled data
12
19
10
2
(Bias in S2) Estimated biases
-1
4. Singularities Almost all gross error detection techniques rely on the building of a gross error candidate list, and the solution of a set of equations to estimate their sizes. If a subset of these candidates participates in a loop in the process graph, these equations will contain matrices that will become singular. Several gross error methods that are prone to fail because of this problem can be easily modified to overcome it. This has been done by Bagajewicz et al. (1998).
5. Uncertainties According to the equivalency theory, one can avoid the singularities. However, when picking the candidate set one is picking a subset of some equivalent set. Thus, there is always the possibility that the gross errors are not located in the set identified, but in some other.
is easy to pinpoint and will be discussed below. However, when one is using a certain gross error detection scheme, one is left with a set of identified gross errors for which several alternatives exist. Indeed, the gross errors identified could be part of equivalent sets of increasing number of streams, that is sets containing one, two, three or more streams in addition to the identified. All these sets consist of loops that can be easily identified. For example of Figure 2, if one finds two gross errors, say S2 and S4 one equivalent set that can be constructed adding only one more stream is {S2, S4 S5}. However, if the gross error identified is S2 no equivalent set (loop) can be formed adding one stream. One needs two streams to form either {S2, S4 S5} or {S2, S3 S1} or {S2, S6 S1}. As one can see, the possibilities are endless. One should realize that in the case where one forms an equivalent set adding one stream, one can pick out of this set any subset with the same number of gross errors as those found. Formulas to recalculate the sizes of these new gross errors have been derived, but presented
When one is assessing the power of a method, this 339
Latin American Applied Research
30:335-342 (2000)
elsewhere (Jiang and Bagajewicz, 1999). For example, if one finds two gross errors in S4 and S5 of size -2 and +1, one can consider that this is a basic set of a general equivalent set {S2, S4, S5}. Thus, the three possibilities depicted in Table 1 are equivalent. In this case, one would say: "Gross errors have been identified in S4 and S5 of size -2 and +1. To obtain equivalent lists, pick any two gross errors of the following list S2, S4, S5"
the size of 5 and
When one forms an equivalent set with more streams, the equivalent cases are degenerate in relation to the identified gross errors. For example, if a gross error detection method obtains a gross error of size -1 in S2, one can realize that the addition of S4, S5 forms a loop, and claim that the Case 1 from Table 2 is an alternative. Note, however that degenerate cases imply gross errors of the same size (unless there is an overlap of loops). Thus, they are less likely to occur. Consequently, in order to limit the number of choices created by this inherent uncertainty, we rule out these cases based on the aforementioned hypothesis that they are less likely. Otherwise, the number of alternatives is too large.
6. Leaks
S 2 with a bias of –5.
Figure 3: A Simple Process with a Leak Consider now the process of Figure 4. The equivalent sets can be formed with streams and leaks of any loop. Thus, any leak is equivalent to a set of equal size biases in a set of streams connecting to the unit where the leak occurs and the environment. This is an important result and leads to the following conclusion: Since a leak is equivalent to a set of biased streams, any steady state method that contains a test to detect biased instruments can be used in conjunction with the equivalency theory to assess the existence of leaks Finally, Bagajewicz and Jiang (1999) showed that: 1) Any spanning tree of the graph of the process can be used in an estimation scheme to capture all gross errors. In fact, the UBET method (Rollins and Davis, 1992) modified by Bagajewicz et al. (1999) is successful because it utilizes one such spanning tree.
If one considers a leak just as another stream, a leak forms at least one loop with some streams or other leaks in the augmented graph. Therefore it will be represented with at least one equivalent set of biases identified with the model. Let us illustrate this issue with two examples. Consider the process in Figure 3. Assume that there is a leak with the size of +5 and the measurements for flowrates of S1 and S 2 are 100 and 95 respectively. The SICC strategy identifies S1 with a bias of 5. The equivalent sets are a leak with
2) One can propose a MILP procedure to exploit equivalencies and obtain a set of minimum cardinality. This method does not require the use of statistical testing.
Fig. 4. A Process with Several Candidate Leaks
7. Instrumentation Upgrade As soon as reconciliation methods gain acceptance in practice by process engineers and instrumentation 340
engineers, the issue of instrument revamping will become critical. Replacing an existing measurement device with a more accurate one is the most reliable approach for increasing reconciled data accuracy.
M. J. BAGAJEWICZ
However, this is not the most economical option. Sensor networks should be able to handle gross errors effectively, that is, detect them when they are too large and avoid large corruption of data when they are not detected. A robust sensor network should:
8. Conclusion Steady State data reconciliation and gross error detection is a mature field with certain challenges remaining. One of these challenges is the elimination of the uncertainties on the location of the gross errors, uncertainties that independent of the method of detection and compensation.
a) Be Accurate: Accuracy of key variables obtained through data reconciliation should satisfy the needs of monitoring, control and production accounting.
Sensor Location is another emerging field, for which efficient techniques that address many practical issues are being developed. This field is ready to be embraced by practitioners.
b) Detect gross Errors Efficiently: The ability of a sensor network to effectively detect gross errors is connected to the redundancy of the system. The more measurements one adds the larger is the network ability to detect gross errors.
References
c) Retain certain Degree of Accuracy when Gross Errors are eliminated: Once a process of serial elimination is used the remaining system should guarantee certain accuracy for key important variables.
Bagajewicz M. and M. Sánchez. Sensor Network Design and Upgrade for Plant Parameter Estimation. Computers and Chemical Engineering. Vol 23., Supp., pp. S593-S596 (1999a).
d) Control Smearing: When gross errors are not detected, the smearing effect should be low.
Bagajewicz M. and M. Sánchez. Duality of Sensor Network Design Models for Parameter Estimation. AIChE J., 45, 3, pp. 661-664 (1999b)
e) Be reliable: Instruments that break often are a frequent source of gross errors. Thus non-reliable instruments should be avoided.
Bagajewicz M. and M. Sánchez. Design and Upgrade of Nonredundant and Redundant Linear Sensor Networks. To appear in the AIChE Journal. (1999c)
All the above properties are desirable, but they all require capital investment. Thus the instrumentation upgrade problem consist of achieving a certain desired network robustness at a minimum cost There are several methods that have been developed in the last years that can help every industrial installation perform this retrofit. Madron (1992) reviews some of the earlier methods, which focus on accuracy only. Bagajewicz (1997) presents the first method that minimizes cost and focuses on the aforementioned robustness issues. A series of recent papers (Bagajewicz and Sanchez, 1999a,b,c,d,e) have solved the problem of grassroots design and retrofit. The form of the grassroots problem is
Bagajewicz M. and M. Sánchez. On the Impact of Corrective Maintenance in the Design of Sensor Networks. Submitted to Industrial and Engineering Chemistry Research. (1999d) Bagajewicz M. and M. Sánchez. Cost-Effective Reallocation and Upgrade of Instrumentation in Process Plants. Submitted to Computers and Chemical Engineering. (1999e). Bagajewicz M. Optimal Sensor Location in Process Plants. AIChE Journal. Vol. 43, No. 9, 2300, September (1997). Bagajewicz, M. and Q. Jiang, Gross Error Modeling and Detection in Plant Linear Dynamic Reconciliation. Computers and Chemical Engineering, 22, 12, 1789-1810 (1998).
Minimize {Total Cost} s.t. Desired level of Precision of key variables
Bagajewicz M. and Q. Jiang. A Mixed Integer Linear Programming-Based Technique for the Estimation of Multiple Gross Errors in Process Measurements. To appear in Chemical Engineering Communications. (1999).
Desired level of Reliability of key variables Desired level of Gross-Error Robustness where the total cost includes the maintenance cost, which regulates the availability of variables, a concept that substitutes reliability when the system is repairable. In the case of retrofit, the total cost represent the cost of relocating instruments, as well as adding new ones. In addition, some constraints regarding the total number of instruments per variable as well as restriction on which instruments can be relocated are added.
341
Bagajewicz, M., Q. Jiang, and M. Sanchez. Removing and Assessing Uncertainties in Two Efficient Gross Error Collective Compensation Methods. To Appear, Chem. Eng. Comm. (1999). Bagajewicz, M. and Q. Jiang, A Comparison of Several Collective Identification and Compensation of Gross Errors in Process Measurements. AIChE Annual Meeting, paper 239a. (1998).
Latin American Applied Research
30:335-342 (2000)
Likelihood Ratio Method for Gross Detection. AIChE J., 33, 1514(1987).
Crowe C. M. Formulation of Linear Data Reconciliation using Information Theory. Computers Chem. Eng. 51,12, 3359-3366 (1996).
Error
Narasimhan, S. and R. S. H. Mah, Generalized Likelihood Ratios for Gross Error Identification in Dynamic Processes, AIChE J., 34, 1321(1988).
Crowe C. M. Y.A. Garcia Campos and A. Hrymak. Reconciliation of Process Flow Rates by Matrix Projection. I. The Linear Case. AIChE J., 29,818, (1983).
Ripps D. L., Adjustment of Experimental Data. Chem. Eng. Prog. Symp. Ser., 61, 8–13 (1965).
Iordache C., R. Mah and A. Tamhane. Performance Studies of the Measurement Test for detection of Gross Errors in Process Data, AIChE J., 31, 1187, (1985).
Rollins, D. K. and J. F. Davis. Unbiased Estimation of Gross Errors in Process Measurements. AIChE J., 38,563(1992). Romagnoli J. and G. Stephanopoulos. On the Rectification of Measurement Errors for Complex Chemical Plants. Chem. Eng. Sci. 35, 5, 10671081, (1980).
Jiang and M. Bagajewicz. On A Strategy of Serial Identification with Collective Compensation for Multiple Gross Error Estimation in Linear Steady State Reconciliation. Ind. & Eng. Chem. Research, 38, 5,2119-2128 (1999).
Rosenberg, J., R. S. H. Mah and C. Iordache. Evaluation of Schemes for Detecting and Identifying Gross Errors in Process Data. Ind. Eng. Chem. Res., 26, 555(1987).
Johnston L.P.M. and M. A. Kramer. Maximum Likelihood Data Rectification. Steady State Systems. AIChE J., 41, 11 (1995).
Sánchez M. and J. Romagnoli. Monitoreo de Procesos Continuos: Análisis Comparativo de Técnicas de Identificación y Cálculo de Bias en los Sensores. AADECA 94 - XIV Simposio Nacional de Control Automático (1994).
Kalman, R. E., New Approach to Linear Filtering and Prediction Problems, J. Basic Eng., ASME, 82D, 35 (1960). Keller, J. Y, M. Darouach and G. Krzakala, Fault detection of Multiple Biases or process leaks in Linear Steady State Systems. Comp. & Chem. Eng., 18, 1001(1994).
Sánchez M. and J. Romagnoli. Use of Orthogonal Transformations in Classification/Data Reconciliation. Comp. Chem. Engng, 20, 483- 493 (1996).
Kim I., M. S. Kang, S. Park and T. Edgar, Robust Data Reconciliation and Gross Error Detection: The Modified MIMT using NLP. Comp. & Chem. Eng., 21, 775(1997).
Sanchez, M., J. Romagnoli, Qiyou Jiang and M. Bagajewicz. Simultaneous Estimation of Biases and Leaks in Process Plants. Computers and Chemical Engineering. 23, 7, 841-858 (1999)
Madron F., Process Plant Performance, Measurement Data Processing for Optimization and Retrofits. Ellis Horwood, West Sussex, England (1992).
Serth, R. and W. Heenan. Gross Error Detection and Data Reconciliation in Steam Metering Systems. AIChE J., 32,733(1986).
Mah, R. S. H., Chemical Process Structures and Information Flows. Butterworths, Stoneham, MA, USA (1990).
Swartz C. L. E., Data Reconciliation for Generalized Flowsheet Applications. American Chemical Society of National Meeting. Dallas, TX (1989).
Mah, R. S. H. and A. C. Tamhane, Detection of Gross Errors in Process Data. AIChE J., 28, 828 (1982).
Tong H. and C. M. Crowe. Detection of Gross Errors in Data Reconciliation by Principal Component Analysis. AIChE J., 41, 7, 1712, (1995)
Narasimhan S. Maximum Power Test for Gross Error Detection Using Generalized Likelihood Ratios. AIChE J. 32, 1409 (1986). Narasimhan, S. and R. S. H. Mah. Generalized
Received August 30 1999 Accepted for publication April 14 2000 Recommended by Bandoni, Diaz and T. Pinto
342