3James S. Liebman et al., A Broken System Part II: Why There is So Much Error
in Capital ... brokensystem2/> [hereinafter Liebman et al., Broken System II].
Journal of Empirical Legal Studies Volume 1, Issue 2, 209–261, July 2004
A Broken System: The Persistent Patterns of Reversals of Death Sentences in the United States Andrew Gelman, James S. Liebman, Valerie West, and Alexander Kiss* We collected data on the appeals process for all death sentences in U.S. states between 1973 and 1995. The reversal rate was high, with an estimated chance of at least two-thirds that any death sentence would be overturned by a state or federal appeals court. Multilevel regression models fit to the data by state and year indicate that high reversal rates are strongly associated with higher death-sentencing rates and lower rates of apprehending and imprisoning violent offenders. In light of our empirical findings, we discuss potential remedies including “streamlining” the appeals process and restricting the death penalty to the “worst of the worst” offenders.
*Gelman is Professor, Department of Statistics and Department of Political Science, Columbia University; Liebman is Simon H. Rifkind Professor, Columbia Law School; West is Ph.D. Candidate at New York University and Research Associate, Columbia Law School; Kiss is Scientist, Department of Research Design and Biostatistics, Sunnybrook and Women’s College Health Sciences Center, Toronto. Address correspondence to Professor Andrew Gelman, 623 Mathematics Bldg., Department of Statistics, Columbia University, New York, NY 10027; email
[email protected]. We thank Yves Chretien, Garth Davies, Jeffrey Fagan, Jonathan Lloyd, and two reviewers for preparation and analysis of the data, and Lisa Ells and Brita Siepker for help in preparing the manuscript. We also thank the U.S. National Science Foundation and National Institute of Justice for financial support through Grants SES-9987748, SES-0318115, and NIJ-2000-I.J-CX0035. Points of view in this article are those of the authors and do not necessarily represent the official position or policies of the National Science Foundation or the U.S. Department of Justice.
209
210
Death Sentence Reversals in the United States
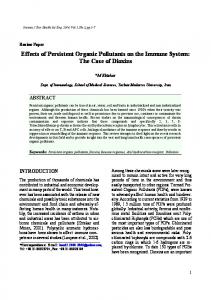
I. THE MODERN DEATH PENALTY IN THE UNITED STATES After being temporarily invalidated by the Supreme Court in 1972, the death penalty was reinstated in the United States in a few states in 1973 and gradually spread to most of the rest of the country by the 1990s.1 Figure 1 shows the number of states with valid death-penalty statutes; the number of death sentences, executions, and executions per death-row population each year since 1973; and the average length of time between sentence and the executions in each of those years. The number of executions rose during most of the 1990s but has never exceeded 3 percent of the people under sentence of death in that year.2 Only 5 percent of the death sentences imposed during the 23-year period from 1973 to 1995 were carried out in that period,3 and average time to execution has risen to between 11 and 12 years.4
1
See Stuart Banner, The Death Penalty: An American History 267–75, 277–78 (2002); William J. Bowers, Legal Homicide: Death as Punishment in America, 1864–1982, at 41, 47 (1984); Lee Epstein & Joseph F. Kobylka, The Supreme Court and Legal Change: Abortion and the Death Penalty 85–90 (1992); Raymond Paternoster, Capital Punishment in America 20–21, 59 (1991); Robert Weisberg, Deregulating Death, 1983 Sup. Ct. Rev. 305, 306–08. On the costs of the death penalty, see generally Mark Constanzo, Just Revenge: Costs and Consequences of the Death Penalty (1997); K. Baiker, The Budgetary Repercussions of Capital Conviction, 2001 Nat’l Bureau of Econ. Research Working Paper No. 8382. Summaries of current controversies appear in America’s Experiment with Capital Punishment: Reflections on the Past, Present, and Future of the Ultimate Penal Sanction (James R. Acker et al. eds., 1998); Beyond Repair? America’s Death Penalty (Stephen P. Garvey ed., 2003) [hereinafter Beyond Repair?]; Challenging Capital Punishment: Legal and Social Science Approaches (Kenneth C. Haas & James A. Inciardi eds., 1998); Robert Jay Lifton & Greg Mitchell, Who Owns Death? Capital Punishment, the American Conscience, and the End of Executions (2000); Austin Sarat, When the State Kills: Capital Punishment and the American Condition (2001); The Death Penalty in America: Current Controversies (Hugo Adam Bedau ed., 1997); Franklin E. Zimring, The End of American Capital Punishment (2002); Roger Hood, Capital Punishment, in The Handbook of Crime and Punishment 739 (Michael Tonry ed., 1998). 2 James A. Liebman et al., A Broken System: Error Rates in Capital Cases, 1973–1995 (2000), available at . 3
James S. Liebman et al., A Broken System Part II: Why There is So Much Error in Capital Cases, and What Can Be Done About It fig. 6 (2002), available at [hereinafter Liebman et al., Broken System II]. 4
Thomas P. Bonczar & Tracy L. Snell. U.S. Dep’t of Justice, Capital Punishment, 2002, at 11 (2003), available at ; Tracy L. Snell & Laura M. Maruschak, U.S. Dep’t of Justice, Capital Punishment 2001, at 12 (2002), available at .
211
Gelman et al.
Figure 1: For each year from 1973 through 2002: (a) the number of states with a valid death-penalty law, (b) the number of persons sentenced to death that year by U.S. states, (c) the number of persons executed that year, (d) the percent of death-row inmates who were executed that year, and (e) the average time since death verdict for that year’s executions (skipping the first few years that did not always include executions). (a)
(c)
1975
1985 year
1995
# executions 20 40 60 80 0
# death penalty states 0 10 20 30
# new death sentences 0 100 200 300
(b)
1975
1985 year
1995
1985 year
1995
avg delay (years) 2 4 6 8 12
(e)
0
proportion executed 0.00 0.04 0.08
(d)
1975
1975
1985 year
1995
1975
1985 year
1995
In this article, we analyze the results of all court decisions that reviewed the nearly 6,000 U.S. capital verdicts imposed between 1973 and 1995, with the goal of answering three questions posed by Figure 1 that are at the center of the current death-penalty debate in the United States. • What happens to capital verdicts between sentencing and execution?5 • Why are so few death sentences ultimately carried out?6 5 See, e.g., Jack Greenberg, Capital Punishment as a System, 91 Yale L.J. 908 (1982); Stephen J. Spurr, The Future of Capital Punishment: Determinants of the Time from Death Sentence of Execution, 22 Int’l Rev. L. & Econ. l (2002). 6 See, e.g., Dwight Aarons, Getting Out of This Mess: Steps Toward Addressing and Avoiding Inordinate Delay in Capital Cases, 89 J. Crim. L. & Criminology 1 (1998); Anthony G. Amsterdam, Selling a Quick Fix for Boot Hill: The Myth of Justice Delayed in Death Cases, in Killing State: Capital Punishment in Law, Politics, and Culture 148 (Austin Sarat ed., 1999); Louis D. Billionis, The Unusualness of Capital Punishment, 26 Ohio N.U. L. Rev. 601 (2000).
212
Death Sentence Reversals in the United States
• Are there changes in death-sentencing policies and practices that can improve the reliability and efficiency of the nation’s capital system?7 Answers to these questions may help evaluate the contradictory criticisms of the capital system that define the modern death-penalty debate in the United States. In explaining his January 2003 decisions to release three death-row inmates because they were innocent and to commute the death sentences of the remaining 164 inmates on the state’s death row to life imprisonment without possibility of parole, Illinois Governor George Ryan stated that “[o]ur capital system is haunted by the demon of error: error in determining guilt, and error in determining who among the guilty deserves to die.”8 Believing that the state legislature had failed to exorcise the demon of error, Ryan concluded that the “system is broken.”9 Prosecutors countered strongly that the problem with the death penalty is not error but nullification of the popular will to carry it out, through irresponsible reversals of
7 See, e.g., Beyond Repair?, supra note 1; James E. Coleman, Jr., Foreword: The ABA’s Proposed Moratorium on the Death Penalty, 61 Law & Contemp. Probs. 1 (1998); David McCord, An Open Letter to Governor George Ryan Concerning How to Fix the Death Penalty System, 32 Loy. U. Chi. L.J. 451 (2001); Shari Seidman & Judith N. Levy, Improving Decisions on Death by Revising and Testing Jury Instructions, 79 Judicature 224 (1996); Symposium, Addressing Capital Punishment Through Statutory Reform, 63 Ohio St. L.J. 1 (2002); Symposium on the Death Penalty: Reforming a Process Fraught with Error, 29 Hofstra L. Rev. 1085 (2001). 8 Governor George Ryan, Address at Northwestern University School of Law (Jan. 11, 2003); see also Jeff Flock, “Blanket Commutation” Empties Illinois Death Row (Jan. 13, 2003), CNN, available at . 9 Id. For related criticisms, see Charles L. Black, Jr., Capital Punishment: The Inevitability of Caprice and Mistake (2d ed. 1981); Michael L. Radelet et al., In Spite of Innocence: Erroneous Convictions in Capital Cases (1992); Leigh B. Bienen, The Quality of Justice in Capital Cases, 61 Law & Contemp. Probs. 193 (1998); Alan W. Clark et al., Executing the Innocent: The Next Step in the Marshall Hypothesis, 26 N.Y.U. Rev. L. & Soc. Change 309 (2000–2001); Samuel R. Gross, The Risks of Death: Why Erroneous Convictions are Common in Capital Cases, 44 Buffalo L. Rev. 469 (1996); C. Ronald Huff, Wrongful Conviction and Public Policy: The American Society of Criminology 2001 Presidential Address, 40 Criminology 1 (2001); Carol S. Steiker & Jordan M. Steiker, Sober Second Thoughts: Reflections on Two Decades of Constitutional Regulation of Capital Punishment, 109 Harv. L. Rev. 355 (1995); Symposium, The ABA’s Proposed Moratorium on the Death Penalty, 61 Law & Contemp. Probs. 1 (1998); Report of the Illinois Governor’s Commission on Capital Punishment (2002), available at .
Gelman et al.
213
death verdicts by judges who oppose the death penalty10 and by Ryan himself.11 To help resolve this debate, we study the reasons and patterns of death-penalty reversals throughout the country over two decades.
II. THE RATE AT WHICH DEATH VERDICTS REVERSED
ARE
To understand in detail what happens after state death verdicts are imposed, we collected data on all 5,826 such verdicts in the United States from 1973 to 1995 in the 34 states that had active and legally valid death-penalty laws during part or all of this period. In the case of Furman v. Georgia12 in 1972, the U.S. Supreme Court had invalidated all existing capital statutes and verdicts. The modern death-sentencing period began in 1973, when states began reinstating the death penalty by adopting new capital statutes that were designed to satisfy the criteria announced by the Supreme Court in its 1972 ruling. Between 1973 and 1978, the Supreme Court found most of the new statutes valid,13 but invalidated others.14 By the late 1970s, the states whose statutes were invalidated in this second round of litigation adopted valid statutes conforming to those the Supreme Court had approved in its
10
See Alex Kozinski & Sean Gallagher, Death: The Ultimate Run-On Sentence, 46 Case W. Res. L. Rev. 1, 1–5 (1995); Barry Latzer & James N.G. Cauthen, Capital Appeals Revisited, 84 Judicature 65, 65 (2000); Stephen J. Markman & Paul G. Cassell, Protecting the Innocent: A Response to the Bedeau-Radelet Study, 41 Stan. L. Rev. 121, 122–23 (1988). See also A. Blecker, Cruelty, Retribution, or Revenge? The Moral Case for the Death Penalty (2002) (unpublished manuscript).
11
See Steve Mills & Maurice Possley, Clemency Adds Fuel to Death Penalty Debate, Chi. Trib. Jan. 13, 2003, available at ; see also Robert Anthony Phillips, Ryan Commutes All Death Sentences in Illinois (Jan. 11, 2003), available at .
12
408 U.S. 238 (1972).
13
Gregg v. Georgia, 428 U.S. 153, 207 (1976); Jurek v. Texas, 428 U.S. 262, 273–74 (1976); Proffitt v. Florida, 428 U.S. 242, 252 (1976).
14
Lockett v. Ohio, 438 U.S. 586, 606 (1978); Roberts v. Louisiana, 431 U.S. 633, 637 (1977); Roberts v. Louisiana, 428 U.S. 325, 335–36 (1976); Woodson v. North Carolina, 428 U.S. 280, 301 (1976). See Weisberg, supra note 1, at 318–28.
214
Death Sentence Reversals in the United States
Figure 2: Outcomes following arrest for homicides committed from 1973 through 1995 in states with the death penalty. Offense/Arrest 331,949 homicides
300,257 homicide arrests (est.)
Prosecution
181,265 outcomes other than murder convictions
118,992 murder convictions (est.)
Sentencing
113,166 outcomes other than death sentences
5,826 death sentences
Court Review as of 1995
Most Recent Known Disposition
2,349 reversed
66 released; not guilty (other outcomes unknown)
(3,119 under review) 358 affirmed
1 released; not guilty 10 reversed on successive petitions 6 clemency (55 on death row or unknown) 286 executed 20 released, not guilty, w/o full court review in study period 35 clemency prior to full court review 64 executed w/o full court review (40 executed from 1973–1995)
mid-1970s rulings.15 We did not analyze death verdicts imposed under facially invalid capital statutes but only those imposed between 1973 and 1995 under “guided-discretion” statutes of the type the Supreme Court approved in its mid-1970s rulings. The excluded cases occurred in nine states during the period 1973–1977. Figure 2 shows the big picture: in the states and years with the death penalty in that period, there were more than 300,000 homicides and slightly over 100,000 murder convictions, of which fewer than 6,000 resulted in death sentences. Of these death verdicts, 40 percent were reversed by state or federal courts as of 1995, 6 percent had been fully upheld by state and federal courts on a first round of state and federal appeals and postconviction review, 54 percent were still in the appeals process, and only 5 percent
15
See, e.g., Harris v. Alabama, 513 U.S. 504 (1995) (upholding constitutionality of Alabama’s guided-discretion statute passed after the state’s mandatory death-penalty statute was invalidated); Blystone v. Pennsylvania, 494 U.S. 299 (1990) (upholding constitutionality of Pennsylvania’s guided-discretion statute passed after the state’s mandatory death-penalty statute was invalidated). See also Weisberg, supra note 1, at 328–43; Randall Coyne & Lyn Entzeroth, Capital Punishment and the Judicial Process 91, 124 (1994); Barry Latzer, Death Penalty Cases 45 (2d ed. 2002).
Gelman et al.
215
had been carried out. Of the 46 percent of all death verdicts that were fully reviewed at all review stages during the period, 87 percent were reversed by state or federal courts. The death verdicts in our study can be appealed at three stages of court review. 1. The first stage of review is based on the trial record and is performed by the highest state appellate court with responsibility over criminal cases (in some states after an intermediate appellate court has also reviewed the verdict). 2. Death verdicts approved at the first appeal stage are then reviewed by one or more state courts (usually, the original state trial court and one state appellate court) in a “state postconviction review” procedure. This procedure focuses on claimed legal errors that were not visible in the original trial record (e.g., the defense lawyer’s failure to investigate the case, or the withholding of exculpatory evidence by police or prosecutors). 3. Death verdicts approved at the second review are then reviewed by federal trial and appellate courts in a “habeas corpus” procedure that affords review by life-tenured federal judges of all the claimed federal legal errors considered by the (mainly elected) state judges in the first two review stages. The U.S. Supreme Court may agree to hear a small number of claimed federal legal errors following any one of the three review stages, but it rarely exercises that power. Death verdicts that are reversed at one of the three review stages are not reviewed at subsequent stages and instead are returned to the original state trial court for a new trial (in most cases) or for dismissal of the charges.16 Figure 3 shows the data for each stage of appeal. Of the cases that as of 1995 were finally reviewed at the direct-appeal stage, 1,852/(1,852 + 2,694) = 41 percent were overturned at the state direct appeal. Of the cases that passed this first review, at least 257/2,694 = 10 percent were reversed by the state postconviction review. Finally, the federal habeas review overturned 240/(240 + 358) = 40 percent of the cases that were upheld at both stages
16
For overviews of the review process, see David Crump & George Jacobs, A Capital Case in America (2000); Machinery of Death: The Reality of America’s Death Penalty Regime (David R. Dow & Mark Dow eds., 2002).
216
Death Sentence Reversals in the United States
Figure 3: Outcomes of the three stages of the appeals processes and final dispositions of cases (as of 1995) for death verdicts. The uncertainty in the number of cases affirmed in the second review stage and the number under review in the third stage arises because judicial decisions at the second (state postconviction) stage are often unpublished. State Direct Appeal
State Postconviction Review
Federal Habeas Corpus
1,852 reversed 5,826 death sentences
Most Recent Known Disposition 37 released; not guilty (other outcomes unknown)
(1,280 under review)
257 reversed
2,694 upheld
(? under review)
? upheld
19 released; not guilty 182 sentence less than death 52 new death sentence 1 died while awaiting retrial (3 unknown) 240 reversed
10 released; not guilty (other outcomes unknown)
(? under review) 358 upheld
1 released, not guilty 6 reversed on successive petitions 10 clemency (55 on death row or unknown) 286 executed
of state court review and that were finally reviewed at the third, federal habeas stage of review. In most situations involving the production of goods or the provision of services, successive inspections for defects are expected to culminate with a final review at which only a very small number of errors are found. It is worrisome that, even after two stages of state review, the federal courts found reason to reverse 40 percent of the remaining capital verdicts.17 The number of the 5,826 death verdicts that were actually reversed cannot be determined from these data because over half of the cases were still under review as of 1995. Some of them are still under review today. (The average time from sentencing to decision at the third review stage is about 10–12 years, both for cases that are ultimately reversed and those that are affirmed at that stage.) The total error rate can be estimated by combining the conditional probabilities from each of the stages of review:
17
James S. Liebman, Rates of Reversible Error and the Risk of Wrongful Execution, 86 Judicature 78, 81–82 (2002).
Gelman et al.
217
Rate of reversal of death sentences 0.2 0.4 0.6 0.8 1.0
Figure 4: Rates of reversal of death sentences at all three stages of court review versus the ratio of death sentences per homicide, for each of the 34 states that actively used the death penalty between 1973 and 1995. As of 1995, death verdicts imposed in six states (Connecticut, Oregon, New Jersey, Colorado, New Mexico, and Ohio) had only been reviewed at the first, state direct-appeal stage, and in two states (Washington and Delaware) the number of death verdicts reversed at the second, postconviction, review stage is unknown.
0.00
MD
KY
TN MS
WY CA MT AR
ID
GA
IN
FL NE
LA IL
TX
NC SC UT
AL OK
AZ NV
PA
MO
VA
0.01
0.02 0.03 0.04 Death sentences per homicide
0.05
Pr(reversed) = Pr(reversed at stage 1) + Pr(upheld at stage 1) ¥ Pr(reversed at stage 2 upheld at stage 1) + Pr(upheld at stages 1 and 2) ¥ Pr(reversed at stage 3 upheld at stages 1 and 2) = 0.41 + 0.10 ¥ 0.59 + 0.40 ¥ 0.53 = 0.68,
or 68 percent.18 The error rate has remained high during the entire period of the study and is also persistent across states. Figure 4 shows the consistently high reversal rates in almost all the death-penalty states.
18
This error rate is conservative for three reasons: the estimate of 10 percent of reversals at the second stage puts all the unreversed cases in the “upheld” category, including many cases that were not reversed or upheld but were still under court review as of 1995; see Figure 3. We did not count reversals occurring at fourth and fifth stages of court review because those stages are not routine in all capital cases. We did not count decisions by governors to commute death sentences, which (as in Illinois) are sometimes based on findings of error, because reasons often are not given for grants of clemency.
218
Death Sentence Reversals in the United States
III. REASONS
FOR
REVERSING DEATH SENTENCES
Not all legal errors found by reviewing courts result in reversals. In most cases, reversal is permitted only if a death-row inmate can show (1) that a legal error committed in his or her case was “prejudicial” because there is a “reasonable probability that, but for the error, the outcome would have been different”;19 (2) that the error affected the verdict in some other identifiable way (i.e., was not “harmless”);20 or (3) that the error (e.g., bias against the defendant by the judge who presided at the trial) was “inherently prejudicial.”21 We counted only error that actually resulted in reversal by the highest court with authority to review the verdict at the relevant stage of review. If a lower or intermediate court reversed a verdict, we did not count that reversal unless the highest court with power to review the verdict at that stage of review approved the lower court’s reversal; if the highest court reinstated the verdict, we treated the verdict as having been upheld. As one means of assessing the seriousness of these reversals, we examined the types of errors that led courts to reverse. A. Sate Postconviction and Federal Habeas Reviews We began by examining the reasons for all 497 reversals at the second (state postconviction) and third (federal habeas corpus courts) review stages. These reversals were about evenly split between state and federal courts. We chose to begin with these review stages because they occur only after the highest court in the state has upheld the verdict at the first review stage and for that reason are sometimes criticized as unnecessarily repetitive
19
See Jeffrey L. Kirchmeier, Drink, Drugs, and Drowsiness: The Constitutional Right to Elective Assistance of Counsel and the Strickland Requirement of Prejudice, 75 Neb. L. Rev. 425, 436–39 (1996) (discussing reversible error in context of ineffective assistance of counsel).
20
See David McCord, Is Death “Different” for Purposes of Harmful Error Analysis? Should it Be? An Assessment of United States and Louisiana Supreme Court Case Law, 59 La. L. Rev. 1105, 1119–20 (1999). For an analysis and critique of the harmless error doctrine in the context of inadequate representation claims in capital sentencing, see Linda E. Carter, Harmless Error in the Penalty Phase of a Capital Case: A Doctrine Misunderstood and Misapplied, 25 Ga. L. Rev. 125, 125–27 (1993).
21
See McCord, supra note 20, at 1119. On reversible error generally, see James S. Liebman, The Overproduction of Death, 100 Colum. L. Rev. 2030 (2000) [hereinafter Liebman, Overproduction].
Gelman et al.
219
and as a source of reversals based on “technicalities.”22 We found that most of the reversals at these two review stages occurred where the correct outcome of the trial was in doubt; the reversing courts found that, if it had not been for the error, there was a “reasonable probability” that the outcome would have been different. If the error affected the jury’s verdict that the defendant was guilty of aggravated capital murder, the different outcome would have been a verdict that the defendant was not guilty of that offense. If the error affected the sentencing verdict but not the verdict that the defendant committed capitally aggravated murder, the different outcome would have been a prison term instead of a death sentence.23 Approximately half of the reversals overturned the determination that the defendant was guilty of aggravated capital murder. The other half affected the capital sentence only. About 80 percent of the state court reversals at the second stage of review, and just under 75 percent of the federal court reversals at the third stage of review, were because of egregiously incompetent lawyering, prosecutorial misconduct or suppression of evidence, misinstruction of jurors, or biased judges or jurors. All four of these kinds of error require proof of a “reasonable probability” that the outcome would have been different if the error had not occurred, except for decisionmaker bias, which is “inherently prejudicial.” Incompetent representation by defense lawyers accounted for about one-third of these reversals; misconduct by police and prosecutors and misinstruction of jurors by judges each accounted for about 20 percent of the reversals; decisionmaker bias accounted for about 3 percent of the reversals. The remaining reversals were for a variety of other violations, including forced confessions, the rejection of potential jurors because of their ethnicity, and denial of funds needed for a full defense by indigent defendants.
22
See Joseph L. Hoffmann, Violence and the Truth, 76 Ind. L.J. 939, 945–49 (2001); see also Joseph L. Hoffmann, Substance and Procedure in Capital Cases: Why Federal Habeas Courts Should Review the Merits of Every Death Sentence, 78 Tex. L. Rev. 1137, 1776–93 (2000) [hereinafter Hoffmann, Substance]; Latzer & Cauthen, supra note 10, at 72. But see Valerie West et al., Look Who’s Extrapolating: A Reply to Hoffmann, 76 Ind. L.J. 951 (2001).
23
Even after guilt has been established, a death sentence is not automatically applied. Instead, the sentencer must evaluate additional evidence and decide whether to impose death or a prison sentence. See Phyllis L. Crocker, Concepts of Culpability and Deathworthiness: Differentiating Between Guilt and Punishment in Death Penalty Cases, 66 Fordham L. Rev. 21, 28–35 (1997).
220
Death Sentence Reversals in the United States
B. State Direct Appeals We next reviewed the reasons for reversal given by state high courts for a random sample of 830 of the 1,852 reversals at the first stage of court review.24 Forty-two percent of these reversals overturned the verdict that the defendant was guilty of murder; 17 percent overturned the determination that defendants guilty of murder were also guilty of capitally aggravated murder. The remaining 41 percent of the reversals affected the sentencing determination. In multiple-reversal cases, we weighted each reversible error as 1/(# of reversible errors found in the case) so that the total proportions would represent cases rather than errors. (Unweighted averages gave similar results.) The largest single basis for reversal at the direct-appeal stage was faulty determination that a circumstance the state statute defines as making the murder into a capitally aggravated murder was present in the case. This error occurred in 20 percent of the cases sampled and accounts for 17 percent of the reversals when the weighting procedure described above is used in cases with multiple errors leading to reversal. Denial of the defendant’s right to cross-examine witnesses against him or her, intentional exclusion of African Americans from the jury, admission of unreliable evidence, prosecutorial misconduct, and instructions relieving the state of the burden of proving the defendant’s guilt beyond a reasonable doubt each accounted for 8–10 percent of the reversals of verdicts of guilt. Other bases include incompetent defense representation, judicial bias, coerced confessions, and the absence of sufficient evidence to permit a reasonable juror to conclude that the defendant was guilty. The basis for overturning a conviction that is typically identified as “frivolous” or a “technicality” is the exclusion of evidence taken from the defendant following a search or arrest conducted without appropriate warrant or “probable cause.” This was the basis for reversal in only one of our sample of 829 cases and accounted for less than one-third of 1 percent of the guilt-stage reversals. C. Retrial Outcomes Following Reversals To check further whether reversals made a difference, we examined the 257 state postconviction court reversals to see what happened at retrials when 24
These cases were randomly selected by computer from a complete list, with a sample size large enough to ensure reliable comparisons of these proportions.
Gelman et al.
221
the errors were cured. Retrial outcomes are not published and must be identified by contacting participants in each case. Reversal information for the second stage also has to be collected in this way—unlike the other two stages, where reversal information is published—so we manually collected information on retrial outcomes for the second stage at the same time as we manually collected reversal information for that stage. Sending the case back to cure errors found at the second review stage changed the outcome 82 percent of the time, including 9 percent of the cases where death-row inmates were found not guilty on retrial. Only 18 percent of the retrials resulted in a new death verdict. We do not know whether the patterns of retrial outcomes at the first and third stages of review are the same as the pattern at the second stage of review. We do not believe those patterns differ substantially, however, because (1) the state high court judges who determine whether errors occurred and whether they are serious enough to require reversal at the first review stages are the same judges who perform the same task at the second review stage (which we studied in this regard); (2) virtually the same types of violations lead to reversals in about the same proportions at the third review stage as at the second stage of review that we studied; and (3) available data on retrial outcomes from separate, state-specific studies of Tennessee25 and Arizona26 capital reversals reveal that retrial outcomes following first- and third-stage reversals are similar to those following second-stage reversals.
D. Absence of Evidence of Ideological Motivation for Most Reversals There is a concern that verdicts may be overturned by appellate judges simply because they are opposed to the death penalty in all cases.27 If so, we obviously should not interpret these rulings as evidence for weaknesses in individual death verdicts. The only example of this possibility occurring that is identified in the literature is the California Supreme Court between 1979
25
John Shiffman, Half of Death Sentences Overturned on Appeal, Nashville Tennessean, July 23, 2001, at A1.
26
27
J. Stookey, The Arizona Capital Punishment System, 2003 (unpublished).
E.g., Hoffmann, Substance, supra note 22, at 1798; Latzer & Cauthen, supra note 10, at 72.
222
Death Sentence Reversals in the United States
and 1986, when Rose Bird was Chief Justie.28 As revealed by our data on direct-appeal reversals in capital cases, the Bird court reversed 83 percent (55/66) of the death verdicts it reviewed before being voted out of office for this and other reasons. The replacement California Supreme Court (under the leadership of Chief Justice Malcolm Lucas) exhibited the opposite pattern, affirming 85 percent (174/205) of the death verdicts it reviewed between 1987 and 1995.29 Aside from these anomalous California examples, there is no evidence that state or federal judges routinely use only simplistic ideological criteria, entirely unrelated to the circumstances of the case, to review death verdicts. Because we count all death verdicts in the nation that were fully reviewed by the courts during the study period, the inclusion of the California cases tends to deflate the overall error rate we report because the Lucas court, which almost always approved death verdicts, reviewed three times more verdicts than the Bird court, which almost always reversed death verdicts. More broadly, there is no evidence that judges are systematically disposed to ignore or frustrate the public will on the death penalty. About 90 percent of the reversals in our study were by elected state judges—who generally need the support of a majority of the voters in order to take or remain in office.30 Most of the remaining reversals were by federal judges appointed by Republican presidents with strong law-and-order agendas. As have all other academic studies addressing the issue,31 our study indicates that appellate judges reviewing capital verdicts face especially intense pressure to
28
Sam Kamin, Harmless Error and the Rights/Remedies Split, 88 Va. L. Rev. 1, 62–71 (2002); Carol Ann Traut & Craig F. Emmert, Expanding the Integrated Model of Judicial Decision Making: The California Justices and Capital Punishment, 60 J. Pol. 1166, 1168 (1998); Gerald F. Uelmen, Review of Death Penalty Judgments by the Supreme Courts of California: A Tale of Two Courts, 23 Loy. L.A. L. Rev. 237, 237–38 (1989).
29
See generally Steven F. Shatz & Nina Rivkind, The California Death Penalty Scheme: Requiem for Furman?, 72 N.Y.U. L. Rev. 1283 (1997).
30
Stephen B. Bright & Patrick J. Keenan, Judges and the Politics of Death: Deciding Between the Bill of Rights and the Next Election in Capital Cases, 75 B.U. L. Rev. 759, 776–92 (1995).
31
E.g., Paul Brace & Melinda Gann Hall, Integrated Models of Judicial Dissent, 55 J. Pol. 914, 930 (1993) [hereinafter Brace & Hall, Integrated Models]; Paul R. Brace & Melinda Gann Hall, The Interplay of Preferences, Case Facts, Context, and Rules in the Politics of Judicial Choice, 59 J. Pol. 1206, 1223–26 (1997) [hereinafter Brace & Hall, Judicial Choice]; Melinda Gann Hall,
Gelman et al.
223
conform their votes in these cases to the views of their constituents—views that since the early 1970s have run heavily in favor of imposing and affirming death verdicts. Considering this strong and consistent finding, a careful empirical analysis of the short Bird court interlude in California concluded that it was a singular anomaly, in which ideological intensity on the part of two or three judges trumped the far more typical tendency of elected appellate judges across the nation to subordinate their ideological views as needed to improve their chances for reelection.32 The main importance of the Bird affair is thus as an object lesson for elected judges in California and elsewhere against ideological purism running against the death penalty. There is some evidence, however, that the Bird example has encouraged ideological purism by appellate judges who strongly favor the death penalty.33 The light rates of reversal by both state and federal appellate courts indicate a systematic problem with the way the death penalty is applied in the states. Can anything be done to reduce the error rate? After examining the available literature on this and related questions and discussing our data and methods, we address the question by examining factors that explain the variation in death-penalty-reversal rates among states.
IV. THE EXISTING EMPIRICAL LITERATURE ON CAPITAL VERDICTS AND APPELLATE COURT REVERSALS Many studies have been performed examining factors predictive both of decisions to seek and impose the death penalty and of rulings by appellate judges and courts. Among the latter studies are a small number addressing the question considered here: What factors influence the decisions of appellate judges and courts to approve or overturn death-penalty verdicts? Briefly discussing both sets of studies helps us explain the design, operation, and
Electoral Politics and Strategic Voting in State Supreme Courts, 54 J. Pol. 427, 442 (1992); Donald R. Songer & Susan J. Tabrizi, The Religious Right in Court: The Decision Making of Christian Evangelicals in State Supreme Courts, 61 J. Pol. 507, 520 (1999). 32
33
Traut & Emmert, supra note 28, at 1177–79.
See, e.g., Bright & Keenan, supra note 30, at 761–66; Brace & Hall, Judicial Choice, supra note 31, at 1223 n.16. Cf. Kamin, supra note 28, at 62; Uelmen, supra note 28, at 290–92.
224
Death Sentence Reversals in the United States
interpretation of our study and identifies questions left open by the existing research that our study helps answer.34 A. Factors Predictive of the Use of the Death Penalty We are mainly interested in appellate court decisions approving or reversing death verdicts, not trial court decisions imposing such verdicts in the first place. Nevertheless, the vast literature studying decisions to use the death penalty is relevant to our study of decisions to reverse death verdicts because both types of decisions have the same essential result. Both make individuals eligible or ineligible to be executed. Our results demonstrate another important connection between the two kinds of decisions: jurisdictions that use the death penalty more often per homicide have substantially higher rates of capital error than jurisdictions that use the death penalty less frequently. Most studies of factors influencing the death penalty’s imposition examine case-specific factors that potentially affect the probability that a death sentence will be imposed. These studies reveal that the probability of a death sentence increases when there is more salient evidence that the defendant has a prior record of antisocial behavior or revealing aggravating aspects of the offense.35 In addition, some studies have found that jurors and judges who hold conservative ideological and religious attitudes, are white, and are male are more disposed to impose the death penalty than other jurors and judges.36 Studies also suggest the influence of particular trial procedures. The practice of questioning prospective jurors about their views on the death penalty, and of excluding candidates for jury service who oppose the penalty, appears to increase the probability that the jurors who are selected will be
34
Less relevant here is the large array of (as a whole, inconclusive) studies of the deterrent effect of the death penalty. For a recent survey of this literature, see Robert J. Cottrol, Death and Deterrence: Notes on a Still Inchoate Judicial Inquiry, in Statistical Science in the Courtroom (Joseph L. Gastwirth ed., 2000).
35
See generally Equal Justice and the Death Penalty: A Legal and Empirical Analysis (David C. Baldus et al. eds., 1990) [hereinafter Baldus et al., Equal Justice].
36
E.g., Songer & Tabrizi, supra note 31, at 520–21 (finding evangelical judges significantly more likely to uphold death penalty); Neil Vidmar & Phoebe Ellsworth, Public Opinion and the Death Penalty, 26 Stan. L. Rev. 1245, 1253 (1974) (“Generally, people who support the death penalty tend to be older, less educated, male, white, and from urban areas.”).
Gelman et al.
225
persuaded beyond a reasonable doubt by the evidence of the defendant’s guilt and will convict him or her of capital murder.37 This effect arises even before the jurors reach the separate question of sentence but more recently has been offset somewhat by “life-qualification,” the process of excluding jurors who would insist on the death penalty in certain situations. Being subjected to death-qualification questioning before trial also increases the probability that jurors who support the death penalty and are seated on the jury will impose that sentence after finding the defendant guilty and after hearing all the aggravating and extenuating evidence on the issue of sentence.38 Whether capital sentencing is by jurors alone, judges alone, or jurors whose decisions may be overridden by judges also seems to affect the probability of a death sentence: judges are more likely than jurors to impose the penalty.39 Increased compensation for capital defense lawyers has been correlated with declining death-sentencing rates in Indiana.40 Attitude surveys suggest that jurors who are clearly instructed on the binding legal rules that govern capital-sentencing proceedings are less likely to impose capital verdicts than jurors who are not given clear instructions on these rules.41 Some researchers have found that proximity to upcoming elections for trial judges
37
E.g., Claudia L. Cowan et al., The Effects of Death Qualification on Jurors’ Predisposition to Convict and on the Quality of Deliberation, 8 Law & Hum. Behav. 53, 73–78 (1984); Robert Fitzgerald & Phoebe C. Ellsworth, Due Process vs. Crime Control: Death Qualification and Jury Attitudes, 8 Law & Hum. Behav. 31, 46–48 (1984); Joseph B. Kadane, Juries Hearing Death Penalty Cases: Statistical Analysis of a Legal Procedure, 78 J. Am. Stat. Ass’n 544, 544–43 (1983).
38
Craig Haney, On the Selection of Capital Juries: The Biasing Effects of the DeathQualification Process, 8 Law & Hum. Behav. 121 (1984).
39
Fred B. Burnside, Comment, Dying to Get Elected: A Challenge to the Jury Override, 1999 Wis. L. Rev. 1017, 1035–39; Harry Kalven, Jr. & Hans Zeisel, The American Jury and the Death Penalty, 33 U. Chi. L. Rev. 769, 771 (1966). Cf. Michael L. Radelet & Michael Mello, Death-toLife Override: Saving the Resources of the Florida Supreme Court, 20 Fla. St. U. L. Rev. 196, 213 (1992).
40
Norman Lefstein, Reform of Defense Representation in Capital Cases: The Indiana Experience and its Implications for the Nation, 29 Ind. L. Rev. 495, 505–12 (1996).
41
John H. Blume et al., Lessons from the Capital Jury Project, in Beyond Repair?, supra note 1, at 174–76; William J. Bowers & Benjamin D. Steiner, Death by Default: An Empirical Demonstration of False and Forced Choices in Capital Sentencing, 77 Tex. L. Rev. 605, 702–17 (1999); Theodore Eisenberg et al., Jury Responsibility in Sentencing: An Empirical Study, 44 Buff. L. Rev. 339, 368 (1996); Theodore Eisenberg & Martin T. Wells, Deadly Confusion: Juror
226
Death Sentence Reversals in the United States
and governors appears to increase the probability that the judges will impose a death verdict,42 and that the governors thereafter will issue death warrants (which affect the speed with which death verdicts are carried out) or will decline to commute death sentences to a lesser penalty.43 Personal characteristics of the defendant and especially the victim also affect the probability of a death sentence. A large and generally consistent set of multivariate analyses concludes that the victim’s ethnicity (white) and sex (female) are associated with a higher probability that prosecutors will ask for, and that jurors will impose, a death sentence.44 The corresponding characteristics of the defendant appear to have less of an effect. Building on case-level research revealing geographic influences on decisions to impose the death penalty (influences often correlated with
Instructions in Capital Cases, 79 Cornell L. Rev. 1, 15 (1993); Joseph L. Hoffmann, Where’s the Buck? Juror Misperception of Sentencing Responsibility in Death Penalty Cases, 70 Ind. L.J. 1137, 1156–58 (1995). 42
E.g., Liebman et al., Broken System II, supra note 3.
43
E.g., Jeffrey D. Kubik & John R. Moran, Lethal Elections: Gubernatorial Politics and the Timing of Executions, 46 J. L. & Econ. 1, 23 (2003) (finding that “states are approximately 25 percent more likely to conduct executions in gubernatorial election years than in other years”); William Alex Pridemore, An Empirical Examination of Commutations and Executions in Post-Furman Capital Cases, 17 Just. Q. 159, 176 (2000) (“[F]inal dispositions occurring in a [gubernatorial] election year were significantly more likely to result in an execution than those occurring in a nonelection year.”). But see Michael Heise, Mercy by the Numbers: An Empirical Analysis of Clemency and its Structure, 89 Va. L. Rev. 239, 292–93 (2003) (finding no significant relation between governor election years or governor’s leaving office and clemency rates).
44
See Samuel R. Gross & Robert Mauro, Death and Discrimination: Racial Disparities in Capital Sentencing 43–55, 88–92 (1989). See also David C. Baldus et al., Racial Discrimination and the Death Penalty in the Post-Furman Era: An Empirical and Legal Overview, with Recent Findings from Philadelphia, 83 Cornell L. Rev. 1638, 1658–60 (1998) (finding higher probability of death sentences when victim is white) [hereinafter Baldus et al., Racial Discrimination]; John Blume et al., Explaining Death Row’s Population and Racial Composition, 1 J. Empirical Legal Stud. 165, 167 (2004) (same) [hereinafter Blume et al., Explaining]; Raymond Paternoster et al., An Empirical Analysis of Maryland’s Death Sentencing System with Respect to the Influence of Race and Legal Jurisdiction: Final Report 34–35 (2003), available at (finding that prosecutors are significantly more likely to seek the death penalty when victim is white). Cf. William J. Bowers et al., Death Sentencing in Black and White: An Empirical Analysis of the Role of Jurors’ Race and Jury Racial Composition, 3 U. Pa. J. Const. L. 171, 241 (2001) (concluding that white jurors, and primarily white juries, are more likely to impose capital sentence when victim is white and defendant is black).
Gelman et al.
227
racial predictors)45 a number of studies consider social and political forces operating at the jurisdictional level that may account for cross-jurisdictional variance in death-sentencing rates. Here again, unsurprising conclusions— that localities characterized by conservative political values, evangelical Christian religious beliefs, and Republican party affiliation tend to have higher death-sentencing rates than other localities are accompanied by more disturbing findings that higher rates of white homicide victimization, economic inequality, and larger African-American populations also predict higher death-sentencing rates.46 This is true even though African-American individuals, when permitted to serve on juries, tend to impose the death penalty less frequently than white jurors.47 Similar racial and economic factors influence state-level variation in rates of execution and in levels of death-penalty intensity, measured using a composite of the size of a state’s death-row population and its death-sentencing and execution rates.48 One important theoretical explanation for many of these findings is that the death penalty’s use is proportionate to the level of threat to personal safety and security experienced by politically powerful
45
See Dov Cohen, Law, Social Policy, and Violence: The Impact of Regional Cultures, 70 J. Personality & Soc. Psychol. 961, 970–73 (1996); Dov Cohen & Richard E. Nisbett, Self-Protection and the Culture of Honor: Explaining Southern Violence, 20 Personality & Soc. Psychol. Bull. 551 (1994); Paternoster, supra note 44, at 37–39.
46
E.g., David Jacobs & Jason T. Carmichael, The Political Sociology of the Death Penalty: A Pooled Time-Series Analysis, 67 Am. Soc. Rev. 109, 126 (2002) (finding that jurisdictions with larger black populations and greater economic disparities were more likely to have the death penalty); Michael Mitchell & Jim Sidanius, Social Hierarchy and the Death Penalty: A Social Dominance Perspective, 16 Pol. Psychol. 591, 608–10 (1995); David C. Nice, The States and the Death Penalty, 45 W. Pol. Q. 1037, 1044–45 (1992) (discovering higher execution rates in states that are ideologically conservative, have larger black populations, and are more metropolitan); Cf. Franklin E. Zimring, Ambivalence in State Capital Punishment Policy: An Empirical Sounding, 18 N.Y.U. Rev. L. & Soc. Change 729, 742 (1990–1991) (documenting persistently high rates of executions in certain states). See generally Keith D. Harries & Derral Cheatwood, The Geography of Execution: The Capital Punishment Quagmire in America (1997).
47
See Blume et al., Explaining, supra note 44, at 168–69; Theodore Eisenberg et al., Forecasting Life and Death: Juror Race, Religion and Attitude Toward the Death Penalty, 30 J. Legal Stud. 277, 286 (2001) [hereinafter Eisenberg et al., Forecasting].
48
Laura I. Langbein, Politics, Rules, and Death Row: Why States Eschew or Execute Executions, 80 Soc. Sci. Q. 629, 644–45 (1999); William S. Lofquist, Putting Them There, Keeping Them There, and Killing Them: An Analysis of State-Level Variations in Death Penalty Intensity, 87 Iowa L. Rev. 1505, 1548–49 (2002).
228
Death Sentence Reversals in the United States
constituencies. Ethnicity comes into play for two reasons. First, ethnicity is associated with political power. Threats to the safety and security of the white community tend to be taken more seriously by law enforcement officials than threats to minority communities.49 Second, partially through the unfortunate operation of racial stereotypes, citizens and officials tend to use the ethnicity of suspects (particularly if the suspects are African American) and the size of nearby minority populations (especially African-American populations) as proxies for the threat of violent crime posed by particular individuals and present in particular social environments.50 B. Factors Predictive of Appellate Reversals As one would expect, the outcomes of judicial cases are influenced, at least in part, by the factors that legal theory has traditionally identified as the legitimate raw material of judicial decision making: fact patterns, legal arguments, and court and fact-finding procedures.51 The quality and status of a party’s lawyer also appears to affect appellate outcomes, although surprisingly a party’s representation by an interest group, such as the NAACP Legal Defense Fund, rather than by a private lawyer, is not predictive of outcomes of appeals in capital and other cases.52 In the context of our federal habeas
49
David Cole, No Equal Justice: Race and Class in the American Criminal Justice System 5, 24 (1999); Randall Kennedy, Race, Crime, and the Law 349–50 (1997).
50
See Lawrence Bobo & Vincent L. Hutchings, Perceptions of Racial Group Competition, 61 Am. Soc. Rev. 951, 965–68 (1996); David Garland, The Cultural Uses of Capital Punishment, 4 Punishment & Soc’y 459, 477 (2002); Jon Hurwitz & Mark Peffley, Public Perceptions of Race and Crime: The Role of Racial Stereotypes, 41 Am. J. Pol. Sci. 375, 391–96 (1997); Michael Sunnafrank & Norman E. Fontes, General and Crime Related Racial Stereotypes and Influence on Juridic Decisions, 17 Cornell J. Soc. Rel. 1, 10–11 (1983); Marylee C. Taylor, How White Attitudes Vary with the Racial Composition of Local Populations, 63 Am. Soc. Rev. 512, 531–33 (1998).
51
Richard Faust et al., The Great Writ in Action: Empirical Light on the Federal Habeas Corpus Debate, 18 N.Y.U. Rev. L. & Soc. Change 637, 705–07 (1991); Victor E. Flango & Patricia Mckenna, Federal Habeas Corpus Review of State Court Convictions, 31 Cal. W. L. Rev. 237, 272–75 (1995); Donald R. Songer & Stephanie A. Lindquist, Not the Whole Story: The Impact of Justices’ Values on Supreme Court Decision Making, 40 Am. J. Pol. Sci. 1049, 1061 (1996).
52
See Lee Epstein & C.K. Rowland, Debunking the Myth of Interest Group Invincibility in the Courts, 85 Am. Pol. Sci. Rev. 205, 213–14 (1991); Steven C. Tauber, On Behalf of the Condemned? The Impact of the NAACP Legal Defense Fund on Capital Punishment Decision Making in the U.S. Courts of Appeals, 51 Pol. Res. Q. 191, 212–14 (1998).
Gelman et al.
229
study discussed later in this article, we find that representation by out-of-state lawyers has a positive effect, suggesting that resources may be more important than ideological commitment in predicting reversals. Numerous caselevel studies have also attempted—with mixed results53—to predict the outcomes of judicial decisions based on extra-legal factors that the legal system typically considers illegitimate. Factors that may have this kind of effect under some circumstances include judges’ personal traits, including their racial, social, and economic backgrounds, prior experience as a prosecutor, and levels of education and professional experience;54 religious beliefs;55 political party affiliations;56 attitudes and ideological orientation;57 and the sources of campaign contributions to judges.58 More consistently
53
See Gregory C. Sisk et al., Charting the Influences on the Judicial Mind: An Empirical Study of Judicial Reasoning, 73 N.Y.U. L. Rev. 1377, 1385–92 (1998), for a review of the research.
54
Jilda M. Aliotta, Combining Judges’ Attributes and Case Characteristics: An Alternative Approach to Explaining Supreme Court Decisionmaking, 71 Judicature 277, 280–81 (1988); Sisk et al., supra note 53, at 1454–59, 1463–65, 1470–80; C. Neal Tate & Roger Handberg, Time Binding and Theory Building in Personal Attribute Models of Supreme Court Voting Behavior, 35 Am. J. Poli. Sci. 460, 477–79 (1991). But see Orley Ashenfelter et al., Politics and the Judiciary: The Influence of Judicial Background on Case Outcomes, 24 J. Legal Stud. 257, 280–81 (1995) (finding little evidence that individual judge characteristics influenced outcomes).
55
Songer & Tabrizi, supra note 31, at 522–23.
56
Randall D. Lloyd, Separating Partisanship from Party in Judicial Research: Reapportionment in the U.S. District Courts, 89 Am. Pol. Sci. Rev. 413, 418–19 (1995); Daniel R. Pinello, Linking Party to Judicial Ideology in American Court: A Meta-Analysis, 20 Just. Sys. J. 219, 240–43 (1999); Rick A. Swanson & Albert P. Melone, The Partisan Factor and Judicial Behavior in the Illinois Supreme Court, 19 S. Ill. U. L.J. 303, 328–30 (1995).
57
Frank B. Cross, Political Science and the New Legal Realism: A Case of Unfortunate Interdisciplinary Ignorance, 92 Nw. U. L. Rev. 251, 275–79 (1997); Craig F. Emmert & Carol Ann Traut, The California Supreme Court and the Death Penalty, 22 Am. Pol. Q. 41, 58–59 (1994); Lee Epstein & Carol Mershon, Measuring Political Preferences, 40 Am. J. Pol. Sci. 261, 271–72 (1996); Lloyd, supra note 56, at 418–19; Jeffrey A. Segal et al., Ideological Values and the Votes of U.S. Supreme Court Justices Revisited, 57 J. Pol. 812, 822–23 (1995). For a thorough discussion of the predictive power of ideology in Supreme Court decisions, see generally Jeffery Allan Segal & Harold J. Spaeth, The Supreme Court and the Attitudinal Model (1993).
58
Stephen J. Ware, Money, Politics and Judicial Decisions: A Case Study of Arbitration Law in Alabama, 30 Cap. U. L. Rev. 583, 627–29 (2002).
230
Death Sentence Reversals in the United States
predictive of judicial outcomes are public opinion and the preferences of voters in the relevant jurisdictions.59 Institutional factors affecting case-level and jurisdictional variation in appellate decisions include levels of public expenditures on courts, judicial workloads, and trends in the decisions of superior courts. For example, elected state appellate judges became less willing to reverse capital sentences in the 1980s as the membership and decisions of the U.S. Supreme Court became more conservative.60 Particular attention has been paid to institutional conditions affecting how public opinion is transmitted to, and how powerfully it influences, judges. One important set of studies considers the effect of two alternative methods of selecting judges—elections versus appointment. In simple comparisons that do not distinguish among legal issues being addressed by courts, the use of one judicial selection method as opposed to the other has not consistently predicted outcomes.61 More recent studies have developed an integrated model of judicial decision making, which indicates that judicial decisions are the result of a complex interaction of preferences, rules, and structures and that institutional influences are best understood in conjunction with case characteristics and ideological influences.62 These studies conclude that elected appellate judges do sometimes conform their votes to public preferences,
59
See, e.g., William Mishler & Reginald S. Sheehan, The Supreme Court as a Countermajoritarian Institution? The Impact of Public Opinion on Supreme Court Decisions, 87 Am. Pol. Sci. Rev. 87, 96–98 (1993); William N. Eskridge, Jr. et al., Strategic Statutory Interpretation (2003), available at (article still in progress).
60
See Brace & Hall, Integrated Models, supra note 31, at 926–29; Brace & Hall, Judicial Choice, supra note 31, at 1223–26.
61
See Daniel R. Pinello, The Impact of Judicial-Selection Method on State-Supreme-Court Policy: Innovation, Reaction, and Atrophy (1995); Victor Eugene Flango & Craig R. Ducat, What Difference Does Method of Judicial Selection Make? Selection Procedures in State Courts of Last Resort, 5 Just. Sys. Rev. 25, 39 (1979); Hall, supra note 31, at 428; Elliot E. Slotnick, Judicial Selection Systems and Nomination Outcomes: Does the Process Make a Difference?, 12 Am. Pol. Q. 225, 235–38 (1984).
62
Tracey E. George & Lee Epstein, On the Nature of Supreme Court Decision Making, 86 Am. Pol. Sci. Rev. 323, 333–34 (1992); Donald R. Songer & Susan Haire, Integrating Alternative Approaches to the Study of Judicial Voting: Obscenity Cases in the U.S. Courts of Appeals, 36 Am. J. Pol. Sci. 963, 577–79 (1992).
Gelman et al.
231
but only when deciding limited types of controversial issues that are highly salient to voters and strongly provoke public debate. Such pressures are further intensified by other institutional conditions—as when these kinds of volatile issues arise during the last two years of a judge’s elected term when a reelection campaign is being contemplated or is occurring, and in states where the terms of elected judges are short, there is strong interparty competition in judicial and other elections, and judicial elections are competitive rather than up-or-down votes on the retention of incumbent judges.63 C. Factors Predictive of Appellate Reversals in Capital Cases Death-penalty appeals have consistently been found to be among the most volatile cases decided by state supreme courts, with the consequence that the pressures on elected appellate judges to conform their votes to constituent preferences are higher in death-penalty cases than in most or all others.64 It is fundamentally the case in death-penalty appeals that state supreme court “justices have predispositions that are consistent with the states’ electoral and ideological environments.”65 Public preferences on the death penalty also affect the decisions of unelected federal appellate judges
63
Emmert & Traut, supra note 57, at 58–59; F. Andrew Hanssen, The Effect of Judicial Institutions on Uncertainty and the Rate of Litigation: The Election Versus Appointment of State Judges, 28 J. Legal Stud. 205, 231–32 (1999); Gregory A. Huber & Sanford C. Gordon, Accountability and Coercion: Is Justice Blind When it Runs for Office?, 48 Am. J. Pol. Sci. (forthcoming Apr. 2004) (manuscript at 29–31, on file with authors); Traut & Emmert, supra note 28, at 1177–79.
64
See Brace & Hall, Integrated Models, supra note 31, at 919, 928–31 (looking at implications of tenure concerns for dissents in the “most visible” state appellate cases, namely, death-penalty cases); Hall, Electoral Politics, supra note 31, at 434, 438 (arguing that strategic election considerations, such as minimizing electoral opposition, dictate state supreme court judges’ votes more often than personal preferences in death-penalty cases, because it is an “emotional issue of great public concern,” and finding that “the majority in conservative death penalty cases is associated with a direct-based electoral system”); Melinda Gann Hall, Constituent Influence in State Supreme Courts: Conceptual Notes and a Case Study, 49 J. Pol. 1117, 1123 (1987) (citing interviews and voting data in concluding that some state supreme court judges respond to constituent preferences on salient issues in order to avoid electoral discipline for unpopular dissents).
65
Brace & Hall, Judicial Choice, supra note 31, at 1219.
232
Death Sentence Reversals in the United States
in capital cases.66 Constituent preferences ran strongly and increasingly in favor of imposing, affirming, and carrying out death verdicts throughout the period of our study.67 Given these conclusions, our findings that state courts overturn 47 percent of the death verdicts they review, and that federal judges reverse 40 percent of the verdicts that survive state review, are surprising. We are aware of only one study previous to ours that attempts to use cross-state variation to explain high capital-reversal rates.68 The single predictor on which they focused—whether or not the state selects its judges using partisan elections—had no significant effect on cross-jurisdiction variation in capital-error rates.69 In some, but not all, of their analyses, however, they found that death verdicts imposed in states with high rates of death verdicts per murders (what they call high “death-obtaining rates”) tend to be reversed more often than verdicts imposed in states that use the death penalty more sparingly.70
V. DATA
AND
METHODS
A. Obtaining Data on Death-Penalty Appeals We assembled three data sets, unique to this study, containing the final outcomes between 1973 and 1995 of all state direct appeals of capital verdicts, all state postconviction review procedures reversing capital verdicts, and all capital federal habeas corpus proceedings—over 5,800 decisions in all. For
66
See, e.g., Tauber, supra note 52, at 201 (citing death penalty as exception to the general conclusion that public opinion does not directly influence federal judicial decision making); see also Eskridge, Jr. et al., supra note 59 (noting situations in which strategic statutory interpretation by the Supreme Court takes precedence over rule of law, democratic, and institutional decision-making considerations).
67
See Tauber, supra note 52, at 213 (noting extra-legal factors such as an “ultra-pro-capitalpunishment environment” that made death sentences “twice as likely to be decided in favor of the state”).
68
See John Blume & Theodore Eisenberg, Judicial Politics, Death Penalty Appeals, and Case Selection: An Empirical Study, 72 S. Cal. L. Rev. 465, 475–78 (1999) (describing methodology for calculating states’ death-obtaining rates).
69
Id. at 488–89.
70
Id. at 496–97, 503.
Gelman et al.
233
all the state direct-appeal and federal habeas corpus decisions, and for a fraction of the state postconviction decisions, we identified the relevant decisions using the names of individuals known to have been sentenced to die in the relevant period as search criteria in the Westlaw and Lexis legal search engines. Information maintained in those search engines also enabled us to be certain that the outcomes we collected were final and were not overturned or subject to further review by any higher court. To identify the names of capitally sentenced individuals, we began with the quarterly census of death-row inmates maintained by the NAACP Legal Defense Fund from 1973 to the present.71 We supplemented that compendium with lists of deathrow inmates collected by the Death Penalty Information Center in Washington, DC,72 and by death-penalty resource centers and individual lawyers in most of the states and with keyword searches of legal and newspaper databases. Because many decisions at the state postconviction stage of review are not accessible through electronic search engines, we identified the relevant decisions in telephone and email conversations with multiple death-penalty lawyers in each death-sentencing state, then obtained the unpublished decisions from court files or law offices. All of our information about appellate outcomes in capital cases is from public court records, and all the data underlying the findings reported here are posted on the website of the Inter-University Consortium for Political and Social Research at the University of Michigan.73 In addition to the outcome of each appeal, we collected information on the year of the death verdict, the state and county in which it was imposed, and the year of the final decision. For a sample of 830 of the state direct-appeal decisions and for all the state postconviction and federal habeas corpus reversals we collected information on the reason for reversal when that was the final outcome. For each of the 600 federal habeas corpus cases, we reviewed every published lower state and federal court opinion as well as the final opinion in the case (typically four opinions per case) to collect data on several hundred attributes of the case in nine categories— 71
NAACP Legal Defense Fund, Death Row U.S.A., at available .
72
Death Penalty Information Center, Death Row, at available .
73
See . We revised the ICPSR data to take into account demogrophic information from the 2000 Census.
234
Death Sentence Reversals in the United States
location, timing, offense, defendant, victim, lawyers, judges, procedures, and legal claims. Data used for the predictors in our regression study of interstate variation of capital-reversal rates were obtained from the U.S. Census, the FBI Uniform Crime Reports, the Vital Statistics of the United States and other data sets on crime victimization maintained by the National Center for Health Statistics, the Source Book of Criminal Justice Statistics (prison population), State Court Statistics (caseloads), Expenditure and Employment Data for the Criminal Justice System, the Statistical Abstract of the United States (welfare recipients and expenditures), and a data set created by Professor Steven F. Messner and his colleagues at the University of Albany and University of Illinois with county population, crime, and socioeconomic data.74 B. Developing Predictors at the State and County Level In the standard view coming from Congress and the Supreme Court, variation in the outcomes of capital-review proceedings is largely a function of the federal circuit court that conducts the final (federal habeas corpus) stage of review. As Senator Orrin Hatch expressed the assumption in a congressional debate over legislation to limit habeas corpus review, citing the U.S. Court of Appeals for the Ninth Circuit in San Francisco as an example, “one of the biggest problems [is] loony judges in the Federal courts who basically will grant a habeas corpus petition for any reason at all.”75 Confirming the conclusion of a recent study of the determinants of time to execution,76 our results show that this assumption does not hold up under scrutiny. As Figure 5 reveals, the same circuit judges reviewing capital verdicts from different states within their regional jurisdictions reverse capital verdicts at substantially different rates depending on the verdicts’ state of origin. Likewise, when added as variables in our models, federal judicial circuits were not significant predictors. States thus appear to be a more promising jurisdictional unit of analysis.
74
Steven F. Messner et al., The Spatial Patterning of County Homicide Rates: An Application of Exploratory Spatial Data Analysis, 15 J. Quantitative Criminology 423 (1999).
75
142 Cong. Rec. S3362 (daily ed. Apr. 16, 1996) (statement of Sen. Hatch); see Gomez v. United States Dist. Ct., 503 U.S. 653, 653–54 (1992) (vacating Ninth Circuit’s stay of execution because it found “no good reason for [the] abusive delay”).
76
Spurr, supra note 5, at 19.
235
Gelman et al.
Figure 5: For selected federal circuit (regional) courts from 1973 through 1995: the rate at which the circuit court, while conducting federal habeas corpus review, reversed capital verdicts imposed in each of the states within the court’s jurisdiction that had the death penalty. 80
70
Fourth Circuit
Percent Reversed
60
Eighth Circuit
Fifth Circuit
Eleventh Circuit
50
40
30
20
10
id a or Fl
m a ba Al a
rg ia eo G
M
is so
ur
i
ka as eb r N
s
sa s Ar ka n
xa Te
na Lo
ui
si a
pp i ss i is si
Vi rg i
ni a M
h ut So
N
or th
C
C ar
ol
ar ol in
in a
a
0
State and Circuit
What, then, can be learned about the determinants of capital reversals by applying the case-level findings described in the previous section to a study of variance among states in the rate at which their capital verdicts are reversed? To help us answer this question, we had to develop jurisdiction-level predictors that parallel important determinants previously identified at the case level. Most important and conceptually difficult is a jurisdiction-level analogue to the ethnicity of the victim at the case level—a factor that many death-penalty researchers treat as a proxy for the threat felt by members of the white community from homicide and other violent crime. One jurisdiction-level analogue is the proportion of a state’s death-row inmates who were placed there for killing white victims—or, perhaps, the difference between that proportion and the proportion of all homicides in the state that were committed against white victims. Although we have developed variables of this sort, they have not proved to be predictive.77 Other jurisdiction-
77
See Liebman et al., Broken System II, supra note 3.
236
Death Sentence Reversals in the United States
level analogues to the ethnicity of victim that have been proposed are the state’s overall homicide rate and the homicide rate among a state’s white population (homicides against white victims, divided by the number of white residents).78 We hypothesize instead that the degree of threat the white community feels from homicide is likely to be best captured by a combination of how many homicides occur in the state and how many of them affect the white as opposed to minority communities. To measure this phenomenon, we divide the rate of homicide victimization among a state’s white population by the rate of homicide victimization among its African-American population. To anticipate our results briefly, we find that the state’s overall homicide rate and the homicide rate among whites are positively correlated with capital-error rates but, as hypothesized, that our new measure of the distribution of the homicide threat to the white community is a more powerful predictor than the alternative measures. We used the proportion of the jurisdiction’s population made up of African Americans as a measure of the effect of ethnicity and of the threat felt by the white population as a result of stereotypical associations between crime and minority populations. Based on case-level findings that so-called black on white crimes pose the largest sense of threat to the white community,79 we hypothesize that our two jurisdiction-level indicators of how much of a homicide threat is perceived by the white community—the size of the African-American population, and the extent of the state’s homicide problem falling on whites—might aggravate each other. To test this hypothesis, we create a third racial variable measuring the interaction of the first two. Another measure of threat available at the jurisdictional level is the state’s efficiency in capturing, prosecuting, and punishing serious criminals. We hypothesize that individuals in states with ineffective law enforcement systems feel more threat than individuals in states where a relatively high proportion of serious criminals are caught and incarcerated. To generate a punishment index, we divide the number of serious crimes (FBI index crimes) committed in each state in each year by the number of prisoners incarcerated in the state in that year. We use four measures of political pressure on judges from particular constituencies and institutional arrangements. To test the influence of 78
See Langbein, supra note 48, at 641.
79
Baldus et al., Equal Justice, supra note 35, at 1658–60.
Gelman et al.
237
public opinion, ideology, and political party, we use the party-adjusted ideology score developed by Paul Brace.80 This is a composite measure of state judges’ party affiliations and the ideological disposition of the electorate. To test the influence of members of religious groups, shown by other research to influence behavior in capital cases,81 we use the proportion of a state’s population made up of members of a pooled set of fundamentalist Protestant denominations identified.82 We measured the level of political competition in each state based on the relative proportion of each state’s electorate composed of registered Democrats and Republicans.83 Because nearly all the states in our study subject judges to some sort of election, we developed an index of political pressure on judges based on differences in election methods that determine the extent of judges’ vulnerability to electoral discipline for unpopular decisions: whether judges are elected or appointed, whether elections are partisan or nonpartisan, how long judges’ initial term of office lasts (which determines the proximity of decisions to elections), and whether decisions to retain judges after their initial term are based on contested elections or uncontested (up-or-down) retention votes. All these variables are positively correlated with error rates. We find that only the lastmentioned factor—how much pressure judicial selection techniques place on state judges to conform to constituents’ views on controversial issues— has a consistently significant effect when included in regression analyses with other variables. We avoid one other methodological limitation of many of the studies of death sentencing and appellate court behavior that we discuss in the previous section. Although those studies identify statistically significant influences on the relevant behaviors, they often do not report information allowing readers to assess and compare the size of these significant effects.
80
Paul Brace et al., Measuring the Preferences of State Supreme Court Judges, 62 J. Pol. 381, 393–98 (2000).
81
See, e.g., Eisenberg et al., Forecasting, supra note 47, at 299–302 (finding that jurors’ religious affiliations influence first votes during capital penalty-phase deliberations); Songer & Tabrizi, supra note 31, at 518–21.
82
See Martin B. Bradley et al., Churches & Church Membership in the United States 1990: An Enumeration by Region, State, and County Based on Data Reported for 133 Church Groupings 12 tbl. 3 (1992).
83
Harold W. Stanley & Richard G. Niemi, Vital Statistics on American Politics, 1999–2000, at 20–21.
238
Death Sentence Reversals in the United States
Effect size is particularly important in a context such as this in which there are strong theoretical and empirical reasons to assume that a number of different kinds of conditions (e.g., case, decisionmaker, jurisdictional, political, and institutional characteristics) will affect outcomes, making the crucial question the comparative importance (as well as the interaction) of those predictors. For this reason, we are primarily concerned in the study we report below with the expected effect of each predictor on the probability of reversal of capital verdicts. C. Hierarchical Logistic Regression Model We fit hierarchical (multilevel) logistic regression models to the probability pst that a death sentence in state s implemented in year t is ultimately reversed.84 Specifically, we model yst, the number of ultimately reversed death sentences: yst ~ overdispersed Binomial (n st pst ) logit( pst ) = X st b + a s + g t + dt , where nst is the number of death sentences in that state and year, X is a matrix of predictors characterizing the state and year, as and gt are estimated varying effects for state and years (after controlling for the regression predictors), and d picks up any overall linear time trend. The inclusion of the year affects gt allows the model to fit time variation in national average reversal rates, beyond what is explained by the state-level predictors and the linear time
84
Hierarchical models, also called multilevel models, are used in statistics, especially in the social sciences, to fit data that are grouped or clustered (as ours are, in states and in years). Equivalently, when framed as regressions or generalized linear models (of which our overdispersed logistic regression is a special case), hierarchical models have regression coefficients that are structured into batches. Thus, in our model, the clustering into states is represented by indicator variables as for states (in regression parlance, “state dummies”), which themselves follow a probability distribution whose variance is estimated indirectly from the data. The variance of the state effects tells us the extent to which there is variability among states in the data beyond that explained by the other regression predictors and the overdispersed binomial model itself. Similarly, the year affects dt represent unexplained variation among years. Fitting a hierarchical model (rather than, e.g., including state and year effects in a classical least squares or logistic regression) allows all these predictors to be included without unduly increasing the standard errors for the other coefficients in the model. Equivalently, these models allow correlation among data within groups. Recent textbooks on multilevel models for social science include Ita Kreft & Jan De Leeuw, Introducing Multilevel Modeling (1998): Steven W. Randenbush & Anthony S. Bryk, Hierarchical Linear Models (2002).
Gelman et al.
239
trend. The varying terms as and gt are given normal distributions with means of 0 (which is acceptable because the regression includes a constant term)85 and standard deviations sa, sg , which are estimated from data. The model includes overdispersion because the data variance cannot be explained simply by the available predictors and binomial variability. We consider various sets of predictors in X and fit each model using the SAS Glmmix procedure.86 We are primarily interested in the coefficients b or, more precisely, the expected change in the probability of reversal corresponding to changes in each predictor X. The hierarchical parameters as and dt represent variation
85
86
Andrew Gelman et al., Bayesian Data Analysis (1995).
A potential problem with the model arises because of censoring. Many of the cases were still in the middle of the appeals process at the stopping point of our study (the end of 1995), and the eventual disposition yst of these cases is unknown to our analysis. This difficulty is inevitable in studying an ongoing process, particularly one such as capital review that takes an average of about 12 years to be completed. Under these circumstances, any effort to include recent as well as older cases assures that right censoring will occur because of the long time lag before all of the recent cases complete the process. We address this issue in three ways. First, we compared our main study, in which censoring occurred because we analyzed reversals as a proportion of all imposed death verdicts—including many verdicts that were not finally reviewed by the end of the study period—to substudies in which we analyzed reversal rates at only a single stage of court review and thus could moderate the censoring problem by limiting the cases being studied to those that were fully reviewed at that stage. As we discuss, the results of these single-stage analyses are substantially the same as the results of our main (three-stage) analysis. Second, we included as predictors a time trend and indicators for the year a verdict was imposed, in part to see if (as one would expect) its effect would change when full right censoring was occurring and when it was not. As predicted, in our main analysis in which censoring occurred, rates of reversal as a proportion of imposed verdicts were lower for verdicts imposed in later years than for verdicts imposed in earlier years. This result is expected, because verdicts that had not been fully reviewed at all review stages as of 1995 had less of a chance (or in some cases, had no chance at all) to be reversed as of 1995 because verdicts that have not been reviewed by one or more courts cannot be reversed (or upheld). One would expect this effect to moderate or to reverse in substudies in which reversal rates are calculated as a proportion of verdicts that have been fully reviewed at the court stage being studied. This, indeed, is what occurred. In our main analysis, reversal rates as a proportion of imposed verdicts are about twice as high for the earliest than for the most recent death verdicts, when other predictors are held constant at their averages. But in our substudy of reversal rates reviewed only at the first (state direct-appeal) stage, this effect reverses: reversal rates as a proportion of reviewed verdicts are about eight times lower for the earliest than for the most recent death verdicts, when other predictors are held constant at their averages. Finally, we conducted a substudy that removed the effect of time passage by aggregating the data in each state over the entire period. The results of this model were consistent with the results of our main state-year analysis.
240
Death Sentence Reversals in the United States
Table 1: Means, Standard Deviations, and Ranges for Each of the Inputs in the Models for the Probability that a Death Sentence is Overturned Input Variable
Mean
SD
Min.
Max.
Death sentences per 1,000 homicides Backlog (# cases) Measure of state caseload Percent black wbratio: ratio white/black homicide victimization Index of political pressure on judges Alternative index of political pressure Imprisonment rate per 100 crimes Index of state population and density Direct expenditures on courts per 100,000 population Party-adjusted judge ideology score Index of welfare expenditures Year of sentencing
23 5.6 0.2 14 0.2 6.5 5.8 4.7 0.2 1.7 41 -0.4 1985.6
24 7.6 1.0 10 0.1 1.7 1.4 2.1 0.9 1.2 13 0.7 5.7
0.1 0 -1.0 0.2 0.001 2 2 0.9 -2.4 0.02 25 -1.6 1973
208 49 3.0 36 1.1 9 8 12.9 1.8 6.0 97 2.6 1995
NOTE: All predictors are at the state-year level, and N = 520, the total number of state-years between 1973 and 1995 with valid death-penalty laws. The fitted model is displayed in Table 2 and Figure 6.
among states and years that is not explained by our linear predictors. Rather than present tables of coefficient estimates, we discuss the predictors that have large and statistically significant coefficients in our regressions and display their estimated effects graphically. We fit our main model at the level of states and years, with the binary outcome yst = 1 corresponding to reversal at any of the stages. We also analyze the state direct appeal and federal habeas review separately, fit the model at the county level, and fit a logistic regression to individual case-level data for habeas review. We discuss the results of each analysis in turn.
VI. RESULTS A. State-Year Analysis of the Combined Review Process We fitted the hierarchical logistic regression model with several different combinations of the state-year predictors and obtained similar results. Reversal rates are consistently high in most states and years: however, certain factors are consistently predictive of higher reversal rates. We display summaries of the predictors and regression results in Tables 1 and 2 but we
241
Gelman et al.
Table 2: Estimated Coefficients (with Standard Errors in Parentheses) from Various Overdispersed Logistic Regression Models Fit to the Probability of Reversal (in Any of the Three Stages) by State-Year Predictor Log (death-sentencing rate) Backlog Caseload Backlog ¥ caseload Log (% black) Log (wbratio) Log (% black) ¥ log (wbratio) Index of political pressure on judges Alternative index of political pressure Log (imprisonment rate) State population and density Year of sentencing Constant
Model 1
Model 2
Model 3
0.65 (0.09) -0.20 (0.02) -0.24 (0.12) 0.048 (0.005) 0.80 (0.18) 0.70 (0.31) 0.15 (0.07) 0.23 (0.06)
0.63 (0.09) -0.21 (0.02) -0.30 (0.13) 0.050 (0.005) 0.76 (0.18) 0.60 (0.31) 0.13 (0.07)
0.68 (0.96) -0.20 (0.02) -0.25 (0.12) 0.049 (0.005) 0.80 (0.18) 0.67 (0.31) 0.14 (0.07) 0.22 (0.06)
-1.19 0.52 -0.06 1.79
(0.21) (0.18) (0.02) (0.76)
0.26 -1.22 0.56 -0.05 1.61
(0.07) (0.21) (0.18) (0.02) (0.77)
-1.18 0.59 -0.06 1.80
(0.22) (0.18) (0.02) (0.76)
NOTE: The models also included varying effects for states and years. We focus on Model 1 but note that the largest effects persist in the alternative specifications. The estimated average effects of the most important inputs are displayed graphically in Figure 6. The range of each input variable is displayed in Table 1.
prefer to summarize the results for each of the important predictors graphically, as shown in Figure 6 and discussed in detail here. Four input variables have the largest expected effect on capital-error rates, with the probability that a death verdict is reversed increasing by a factor of about five or more across the range of values for each input as represented by the 520 combinations of states and years in our study (holding all other predictors constant at their averages). First, higher death-sentencing rates—death sentences per 1,000 homicides—are associated with higher probability of reversal of any death verdict that is imposed.87 When other factors are held constant at their average values, the predicted probability of reversal increases about sevenfold when moving from states and years with the fewest to those with the most death sentences imposed per 1,000 homicides.88
87
Such a result is consistent with Blume & Eisenberg, supra note 68, at 496 (noting a “strong, significant correlation . . . between death-[sentencing] behavior and relief from death sentences”).
88
See Figure 6a.
242
Death Sentence Reversals in the United States
Figure 6: Probability of reversal as a proportion of imposed verdicts at all three stages of court review based on each of several factors, with all other predictors held constant (as estimated from the hierarchical logistic regression Model 1 in Table 2). The factors are: (a) state death-sentencing rate, (b) state rate of arrests, conviction, and imprisonment for serious crime, (c) state’s backlog of capital verdicts awaiting review, (d) a measure of state population and density, (e) the proportion of African Americans in the state population, (f) the risk of homicide to state’s white residents divided by risk of homicide to state’s African-American residents, and (g) a measure of the political pressure on state judges. These factors were the most important in range of regression models we fit, including those displayed in Table 2 and also others fit to each stage of review separately. For each graph, the horizontal axis includes the range of values that occurred in the stateyears in our study.
100
150
2
4
6
8
10
0
imprisonment rate
10
20
Pr (reversal)
0.8
0.0
0.0 1
0
state pop and density index
5 10
20
30
0.0
percent black in state
0.8 0.4 0.0 2
3
4
5
6
7
8
0.4
0.8
white/black homicide risk
(g) Pr (reversal)
40
(f)
0.4
Pr (reversal)
0.8 0.4
0
30
backlog
(e)
0.0
–1
0.8 0.0
0
(d)
–2
0.4
Pr (reversal)
0.8 0.4
200
0.8
50
death-sentencing rate
0.4
0
Pr (reversal)
(c)
0.0
0.4
Pr (reversal)
0.8
(b)
0.0
Pr (reversal)
(a)
9
political pressure on judges
Gelman et al.
243
Second, the lower the proportion of its serious criminals a state manages to arrest, convict, and incarcerate—as measured by prison population per FBI Index Crimes—the higher is the probability that any death verdict it imposes will be reversed as a result of consequential error. Other things equal, the predicted probability of reversal is about seven times higher in states and years with the lowest rates of efficiency in capturing, convicting, and imprisoning violent offenders than in the states and years with the highest rates of efficiency.89 States with more efficient law enforcement systems commit fewer errors in processing capital cases. Third, in states with a larger number of death verdicts that are stacked up in the courts awaiting appellate review, there is a lower probability that a death verdict will be reversed.90 In part this reflects congestion. Appellate courts in states with 15 or more death verdicts awaiting review evidently get so overburdened that they are unable to finish inspecting the capital verdicts that are currently under review and either reverse or affirm them; at that point, congestion effectively shuts down the review process. Some of this effect remains, however, even after excluding undecided cases, indicating that backlogs also pressure courts to approve verdicts and speed them through the process, perhaps by reviewing them less thoroughly for error. Fourth, when reversals at all three stages of review are considered, reversal rates increase as the size and density of the states’ populations increase. In analyses dominated by state court reversals—when we consider reversals at all three review stages combined, there are about nine state court reversals for every one federal court reversal—death verdicts imposed in states with larger, more concentrated populations are more likely to be overturned by the courts than verdicts imposed in states with smaller populations spread out among smaller communities. Other things equal, the predicted probability of reversal is almost five times higher in the most than in the least densely populated states and years.91 As we discuss below, this effect—alone among the effects we identified—reverses direction when only federal court decisions are considered. State courts are more likely to reverse verdicts imposed in more densely populated areas, while federal courts are less likely to reverse verdicts imposed in those areas. In other words, unlike
89
See Figure 6b.
90
See Figure 6c.
91
See Figure 6d.
244
Death Sentence Reversals in the United States
state courts, federal courts are more likely to reverse verdicts imposed in states where much of the population is located in small towns and rural areas than verdicts imposed in states with larger, more urban and suburban populations. We address this phenomenon below. Three additional conditions had smaller but still notable effects—in each case, the predicted probability of reversal at least doubled across the range of values for that condition among the 520 state-years in our study. The probability that a death verdict would be reversed is higher where each of the following predictors are higher: (1) the percentage of the population in the state that is African American;92 (2) the rate of homicide victimization among the white population divided by the homicide victimization rate among African Americans;93 and (3) the electoral pressure on state judges to conform their rulings to popular sentiment—as measured by an index of the frequency and partisan nature of state judicial elections.94 The interaction of the first two of these factors appears to be positive: error rates are even higher in states with a combination of large African-American populations and high rates of white relative to African-American homicide victimization than would be predicted by each of those factors by themselves. B. Separate State-Year Analyses of the State Direct-Appeal and Federal Habeas Reviews We study the sensitivity of these findings to model specification by varying the analysis in different ways: examining error rates at each stage of review as opposed to combined error rates at all three review stages; examining error rates as the number of reversals per reviewed verdict as opposed to the number of reversals per imposed verdict; and removing time as a varying intercept and comparing the states’ 23-year death-sentencing experiences as a whole. The findings above largely remained under these alternative analyses. There were, however, some interesting differences. When reversals at only the first (state direct-appeal) review stage were analyzed, a new predictor appeared: the predicted probability of reversal triples when per capita direct expenditures on the state court system drop
92
See Figure 6e.
93
See Figure 6f.
94
See Figure 6g.
245
Gelman et al.
Table 3: Estimated Coefficients (with Standard Errors in Parentheses) from Overdispersed Logistic Regression Models Fit to the Probability of Reversal in the First (State Direct-Appeal) Stage, by State-Year Predictor Log (death-sentencing rate) Backlog Log (% black) Log (wbratio) Log (% black) ¥ log (wbratio) Index of political pressure Log (imprisonment rate) State population and density Log (court expenditures per 100,000) Party-adjusted judge ideology score Year of sentencing Constant
Model 1 0.44 -0.09 0.41 0.73 0.12 0.17 -1.37 0.47 -0.39 0.01 0.16 -0.96
(0.10) (0.01) (0.22) (0.35) (0.07) (0.09) (0.24) (0.20) (0.08) (0.01) (0.03) (1.00)
Model 2 0.35 -0.08 0.37 0.21
(0.10) (0.01) (0.16) (0.11)
0.14 (0.10) -1.41 (0.24) -0.34 (0.08) 0.16 (0.03) -0.37 (0.68)
NOTE: The models also included varying effects for states and years. The effects are similar to those obtained by analyzing all three stages together (see Table 2), with the addition of state spending on courts, whose estimated effect is displayed in Figure 7. The range of each input variable is displayed in Table 1.
from the highest to the lowest rates among the 450 states and years in the state direct-appeal substudy. Table 3 shows the estimated regression coefficients, and Figure 7 displays the estimated predictive effect of per capita court expenditures, keeping all other inputs in the model fixed at their average values. We also performed an analysis of the second (postconviction review) stage, but this yielded no new results beyond those of the combined analyses already presented. Things changed more when reversals at only the third (federal habeas) review stage were analyzed, although the change may be in part a function of the lower number of state-year (161) included in this substudy. Table 4 displays the results for models including only the statistically significant predictors. State death-sentencing rate, the proportion of the state’s population that is African American, and the rate of homicides among the state’s white compared to its African-American populations were not significant predictors of reversals (although the signs for those variables ran in the predicted direction). But a strong new predictor appeared that is highly correlated with the racial-population variable: the predicted probability of reversal quadruples when an index based on the percent of the state’s population receiving welfare and its per capita spending on welfare rose from the lowest
246
Death Sentence Reversals in the United States
0.8 0.4 0.0
Pr (reversal)
Figure 7: Probability of reversal as a proportion of verdicts actually reviewed at the first (state direct-appeal) stage based on state spending on courts (in dollars per million residents), with other factors held constant at their average values, from a logistic regression similar to those shown in Table 2 but fit only to state direct-appeal results. The effects of the other important predictors in the model were similar to those shown in Figure 6.
0
10 20 30 40 50 60
spending on courts per capita
Table 4: Estimated Coefficients (with Standard Errors in Parentheses) from Overdispersed Logistic Regression Models Fit to the Probability of Reversal in the Third (Federal Habeas Review) Stage, by State-Year Predictor Index of political pressure on judges Alternative index of political pressure State population and density Welfare expenditures Year of sentencing Constant
Model 1
Model 2
0.36 (0.08) -0.44 0.81 -0.13 -1.30
(0.17) (0.17) (0.03) (0.64)
0.49 -0.58 1.02 -0.12 -1.84
(0.11) (0.17) (0.19) (0.03) (0.76)
NOTE: The models also included varying effects for states and years. The smaller sample size of this model results in fewer of the potential predictors being statistically significant compared to the combined and aggregate models summarized in Tables 2 and 3. The predictive effects of welfare expenditures and state population and density (which are different than in the models for the earlier stages) are displayed graphically in Figure 8. The range of each input variable is displayed in Table 1.
to the highest values among the 161 state-years in the federal habeas corpus substudy. Federal courts are more likely to reverse death verdicts from states with high welfare burdens than verdicts from states with lower welfare burdens.95 Additionally, the sign of the population size and density factor changed when reversals at only the federal habeas stage are considered. 95
See Figure 8a.
Gelman et al.
247
Figure 8: Probability of reversal as a proportion of verdicts actually reviewed at the third (federal habeas corpus) stage based on (a) an index of the percent of state spending on welfare, and (b) the measure of state population and density. The graphs show expected values holding all else constant, from a logistic regression that also controls for an index of political pressure on judges (which has a positive effect as in Figure 6), a time trend, and varying effects for states and years.
0.8 0.4 0.0
0.4
Pr (reversal)
0.8
(b)
0.0
Pr (reversal)
(a)
1
0
1
2
index of welfare spending
–2
–1
0
1
state pop and density index
Death verdicts imposed in states with lower populations and population density are more likely to be overturned by federal habeas courts than death verdicts from other states.96 Elected state judges seem more willing to remove error from death verdicts imposed in urban areas—where the judicial reversals of verdicts may be less visible and less politically controversial—than from death verdicts imposed in small towns and rural communities. Lifetenured federal judges disproportionately bear the burden of reversing flawed verdicts imposed in the latter, nonurban areas. These findings, together with the effect of electoral pressure on state judges,97 are consistent with the idea that locally-elected sentencing judges are more affected than state-elected appellate judges by political pressure.98 C. Summary of Results of State-Year Analyses Overall, high death-sentencing rates are associated with a higher risk of error in the death verdicts that are imposed. Large numbers of death
96
See Figure 8b.
97
See Part III.
98
See Blume et al., Explaining, supra note 44, at 178–79.
248
Death Sentence Reversals in the United States
verdicts also keep appellate courts from effectively reviewing capital verdicts for error. Pressures to use the death penalty excessively and unreliably may be generated by a jurisdiction’s generally ineffective response to violent crime and by racial factors (fears about crime produced by a state’s large African-American population, high proportions of welfare recipients, and high rates of homicide that are relatively concentrated among white as opposed to African-American victims, and the interaction of these two factors). It has long been recognized that changes in the proxies used by politically powerful citizens to measure (sometimes accurately, sometimes not) the level of threat they face from violent crime—for example, rates of violent criminal victimization in the white community and the size of the African-American community—affect the probability of punitive responses by citizens and officials. As the perceived threat rises, so does the probability that punitive policies will be adopted.99 It has also been hypothesized that the political process provides mechanisms—such as frequent, partisan elections of judges—for transmitting political pressures generated by these fears to the public officials who devise and implement penal policies.100
99
On the impact of the distribution of populations by ethnicity on crime fears and support for punitive policies, see Bobo & Hutchings, supra note 50, at 958–65; Mark A. Fossett & K. Jill Kiecolt, The Relative Size of Minority Populations and White Racial Attitudes, 70 Soc. Sci. Q. 820, 831, 833–34 (1989); Garland, supra note 50, at 474–78; Craig Haney, Violence and the Capital Jury: Mechanisms of Moral Disengagement and the Impulse to Condemn to Death, 49 Stan. L. Rev. 1447, 1463–67, 1471–73 (1997); Jacobs & Carmichael, supra note 46, at 127–28; Mitchell & Sidanius, supra note 46, at 592–610 (describing death penalty as an instrument of social hierarchy enforcement, evidenced by higher numbers of executed in states with higher hierarchy indicators); Taylor, supra note 50, at 519–24. On the impact of the ethnicity of the victims of homicide, see Baldus et al., Equal Justice, supra note 35; Gross & Mauro, supra note 44; Baldus et al., Racial Discrimination, supra note 44; John H. Blume et al., Post-McCleskey Racial Discrimination Claims in Capital Cases, 83 Cornell L. Rev. 1771 (1998); Bowers et al., supra note 44; Eisenberg et al., Forecasting, supra note 47; Mona Lynch & Craig Haney, Discrimination and Instructional Comprehension: Guided Discretion, Racial Bias, and the Death Penalty, 24 Law & Hum. Behav. 337 (2000) (evaluating the interplay of jurors’ comprehension of instructions and racial biases); and Paternoster et al., supra note 44.
100 Brace & Hall, Integrated Models, supra note 31, at 918–19, 920, 929–31; Bright & Keenan, supra note 30, at 776–81, 784–92; John H. Culver, Capital Punishment Politics and Policies in the States, 1977–1997, 32 Crime Law & Soc. Change 287, 293, 298 (1999); George & Epstein, supra note 62, at 333–34; Songer & Tabrizi, supra note 31, at 515–16; Traut & Emmert, supra note 28, at 1171, 1176–79.
Gelman et al.
249
D. Case-Level Analysis of Federal Habeas Review Our findings confirm both these insights in regard to one particularly punitive and publicly visible policy: increased use of the death penalty. More importantly, our findings supplement these conclusions with a new one: when highly visible and punitive policies, such as increased use of the death penalty, are adopted in response to political pressures generated by perceived and actual threats to public safety, the policies are prone to be administered in an unreliable manner, characterized by serious error and mistakes. In the case of increased use of the death penalty, such error undermines the quality not only of trial-level judicial decisions about whom to convict of capital murder and whom to sentence to die but also of appellate-level court decisions about which and what proportion of death verdicts to approve for execution. Error breeds more error. Incompetent law enforcement policies aggravate the threat felt by the public, which, in turn, increases the use of the death penalty and the probability of serious error affecting each additional death verdict that is imposed. Increased numbers of flawed verdicts flooding the capital-review process tend to reduce the capacity of that process to catch and correct trial-level error and create pressures to approve death verdicts despite the presence of those flaws. The analyses we have presented so far are in the aggregate. We also analyzed the ability of factors in individual cases to predict reversal at the third (federal habeas) stage of review. We limited this study to the federal habeas stage of review because of the much larger accumulation of published decisions (and thus available data) at this last review stage compared to the earlier stages. For each of the 600 cases with completed habeas reviews, we collected information on numerous aspects of the crime, defendant, victim, lawyers, timing, judicial proceedings, and errors (alleged and found), using information in published state and federal court decisions in each case. We fit several logistic regressions to the probability of habeas reversal, considering various individual-level predictors suggested by the literature to be possibly predictive of reversal rates. Table 5 gives summaries of the inputs, and Table 6 displays the estimated logistic regression coefficients and standard errors. The signs of the coefficients make sense, as we briefly discuss. After controlling for the strength of the factual and legal grounds for reversal in each case, we found that the probability of reversal at the federal habeas stage increased as the case for a death sentence got weaker. Holding
250
Death Sentence Reversals in the United States
Table 5: Means, Standard Deviations, and Ranges for Each of the Inputs in the Case-Level Analysis of Federal Habeas Review Input Variable State evidentiary hearing was held? Represented by out-of-state lawyer? # aggravating—# mitigating circumstances Character of offender and victim Federal evidentiary hearing was held? Year of sentencing # habeas claims presented in the case Majority of the reviewing judges appointed by Republicans?
Mean
SD
Min.
Max.
0.25 0.30 1.9 2.0 0.19 1980.0 4.5 0.53
0.43 0.46 1.3 1.2 0.39 3.4 3.6 0.50
0 0 -5 0 0 1973 1 0
1 1 6 7 1 1995 29 1
NOTE: All predictors are at the level of the individual case, and N = 598, the total number of completed habeas reviews. The fitted model is displayed in Table 6.
Table 6: Estimated Coefficients (with Standard Errors in Parentheses) from the Logistic Regression Model Fit to the Probability of Reversal at the Third (Federal Habeas) Stage, as a Function of Case-Level Factors Predictor State evidentiary hearing was held? Represented by out-of-state lawyer? Aggravating—mitigating circumstances Character of offender and victim Federal evidentiary hearing was held? Year of sentencing # habeas claims presented in the case Majority appointed by Republicans? Constant
Model 1
Model 2
Model 3
Model 4
-0.54 (0.21)
-0.49 (0.22)
-0.43 (0.23)
-0.42 (0.24)
0.49 (0.19)
0.44 (0.20)
0.49 (0.20)
0.61 (0.21)
-0.15 (0.07)
-0.17 (0.07)
-0.17 (0.07)
-0.20 (0.07)
-0.28 (0.07)
-0.22 (0.07)
-0.19 (0.07)
-0.18 (0.09)
0.50 (0.22)
0.47 (0.22)
0.54 (0.23)
0.71 (0.23)
-0.15 (0.03)
-0.14 (0.03) -0.15 (0.03)
-0.12 (0.03) -0.14 (0.03) -0.39 (0.20)
0.27 (0.21)
304.29 (55.87)
280.68 (59.39)
246.24 (62.63)
Gelman et al.
251
other factors constant at their averages, the probability of a reversal increases 18 percent with the addition of one mitigating factor, and decreases 18 percent with the addition of one aggravating factor.101 We also constructed an index of seven additional factors about the defendant or the case that are not consistently treated as formal aggravating factors by capital statutes but that tend nonetheless to increase the seriousness of the offense or the decisionmaker’s perception of its seriousness: whether or not the defendant had a prior criminal record, abused drugs or alcohol, was drunk at the time of the offense, or committed the killing in his or her home community, and whether the victim was a woman or had a high status in the community, such as a police officer or elected official. These supplemental aggravating factors had the same effect and about the same effect size as the formal aggravating circumstances: the higher the number of additional aggravating circumstances, the lower the probability of reversal, with each additional factor decreasing the probability of reversal by 17 percent, holding other factors constant. These results may help explain the relation between high deathsentencing rates and high error rates in our aggregate studies: error rates increase as jurisdictions expand the category of homicides for which they impose the death penalty to include cases where the factual bases for a death sentence are relatively weaker or more marginal. Conversely, death verdicts imposed in jurisdictions that reserve the death penalty for “the worst of the worst” offenses are less likely to be seriously flawed. In addition, as we predicted, the better the factual inquiry conducted during prior state court review proceedings, the lower the probability of a federal reversal; capital prisoners who are represented in federal review proceedings by out-of-state lawyers—typically, members of large urban law firms handling the cases pro bono publico or members of public interest law firms specializing in capital litigation, both of which groups tend to be highly prepared and highly or at least adequately compensated—increase the probability of reversal at the federal habeas stage; later death verdicts were less
101 U.S. capital statutes list aggravating factors on which jurors are invited to base death sentences and permit jurors to consider mitigating factors cutting the other way. When the sentencing jury, or in some states the sentencing judge, announces a sentencing verdict, the jury or judge is required to list in writing the aggravating and mitigating factors found in the case, which then are reported in published appellate decisions. We used this information in constructing a predictor comprised of the number of formal aggravating circumstances found in the state minus the number of identified mitigating circumstances.
252
Death Sentence Reversals in the United States
likely to be reversed than earlier ones;102 and judges appointed by Republican presidents are less likely to reverse than judges appointed by Democratic presidents. Ethnicity of the defendant and victim had no discernable effect on the probability of federal habeas corpus reversal. When the state of origin of the death verdict and the federal judicial circuit court that reviewed the capital verdict are added as variables, they have no strong or statistically significant predictive value, and the political party of the deciding judges is no longer significant. The nonsignificance of federal judicial circuit as a predictor of federal habeas outcomes when other important variables are considered is further evidence that ideological differences among the federal circuit courts is not as important an explanation for variance in capital reversals and reversal rates as has been thought. E. County-Level Analysis Rates of imposing and reversing death verdicts can also be examined at the county level. Figure 9 shows the counties with at least one death sentence in the period under study. The map reveals that nearly 60 percent of the counties in the 34 death-penalty states that imposed death sentences between 1973 and 1995 imposed no death verdicts during that period. Even in Texas, Louisiana, Missouri, and Virginia—states known for their relatively frequent use of the death penalty—a majority of counties did not impose any death verdicts during the 23-year study period. Interestingly, the variance among counties that Figure 9 reveals can be explained based on interstate variance without positing any additional effect from intra-state variance. We calculated the number of counties with zero death sentences and found that the number was what would be expected from a simple binomial model, allowing states to vary but with identical probabilities of death sentence per homicide for all counties within each state. That is, by this measure, Figure 9 is statistically indistinguishable from a random assignment of counties to categories of those that do and do not use the death penalty, as long as the probability of assignment is allowed to vary between states based on actual state death-sentencing rates and to be proportional to the number of homicides for each county within each state. This provides further support for 102 This prediction was based on a steady narrowing by the Supreme Court of the capacity of federal judges to reverse capital verdicts during the 23-year study period. See generally Coyne & Entzeroth, supra note 15; David R. Dow, How the Death Penalty Really Works, in Machinery of Death, supra note 16, at 11, 17–18, 26–34; Nina Rivkind & Steve F. Shatz, Cases and Materials on the Death Penalty 120–66 (2001).
Gelman et al.
253
Figure 9: Counties with at least one death sentence in 1973–1995 (dark shading) and counties in death-penalty states with no death sentences (light shading).
our hypothesis that states—and not, for example, federal judicial circuits or counties—are the crucial unit of analysis in understanding death-penalty patterns. Consistent with this hypothesis, our analyses of data at the county level revealed little beyond our state-level regressions. After controlling for states, there was little evidence of varying rates of reversing death sentences and no evidence of varying death-sentencing rates per homicide among counties. When we fit hierarchical models including county variables, we obtained an estimate of zero for the unexplained variance at the county level. Among these models was one in which we derived predicted values for reversal rates for states and years, then used those predicted values as independent variables in a study of county reversal rates. The predicted values soaked up all of the unexplained variance, and no other predictors (in these particular county models) were significant. That said, two county-level conditions were significantly related to county capital-error rates, even after controlling for state-level factors, in some of our county analyses. Both effects also appeared in a regression study of capital-error rates in Florida counties.103 The two significant factors are 103
Florida is the only state in our study with enough capital verdicts in enough different counties and years to permit a single-state comparison of county capital-error rates.
254
Death Sentence Reversals in the United States
the number of death sentences imposed in the county per 1,000 homicides104 and the county’s population size and density (also positively correlated with the probability of error, when errors found at all three review stages are examined). When measured at the state level, both factors were also predictive of state-level reversal rates. Simple comparisons of similar counties—with about the same number of homicides—consistently reveal a tendency among like-sized counties with higher capital-sentencing rates to have substantially higher reversal rates than counties with low death-sentencing rates. Individuals condemned to die by high death-sentencing counties also tend to be exonerated thereafter (i.e., found to be not guilty, as defined by the Death Penalty Information Center)105 at much higher rates than individuals condemned to die by low death-sentencing counties.
VII. POLICY OPTIONS Various policies have been suggested to reform the current system in which death sentences typically take longer than 10 years to be reviewed, with more than two-thirds ultimately found to be in error. The suggestions fall into three main categories: (1) identifying practices under which death sentences can be made more reliable;106 (2) streamlining the appeals process;107 and (3) reducing the use of the death penalty.108 We discuss each in turn.
104
The higher a county’s death-sentencing rate, the higher the probability that any death verdict it imposes will be reversed because of error. 105 See Death Penalty Information Center, Innocence and the Death Penalty, available at (last visited Mar. 17, 2004) (citing year of exoneration as year released from death row). 106 See generally Shari Seidman Diamond & Judith N. Levi, Improving Decisions on Death by Revising and Testing Jury Instructions, 79 Judicature 224 (1996); Liebman et al., Broken System II, supra note 3; Barry Scheck et al., Actual Innocence: Five Days to Execution, and Other Dispatches from the Wrongly Convicted (2000); Symposium, Addressing Capital Punishment Through Statutory Reform, supra note 7. 107 See generally Aarons, supra note 6; Hoffmann, Substance, supra note 22; Latzer & Cauthen, supra note 10. 108
See generally Blecker, supra note 10; Blume & Eisenberg, supra note 68; Liebman et al., Broken System II, supra note 3; Liebman, Overproduction, supra note 21.
Gelman et al.
255
A. Operating the Death Penalty More Reliably Our analysis suggests some specific reforms that would be expected to reduce error rates somewhat. Many reversals occur in cases of weak evidence, in which the prosecutors are under political pressure to come up with a death verdict.109 Thus, we suspect that some beneficial effect would be achieved by rules at the trial stage requiring that all police and prosecution evidence bearing on guilt versus innocence, and aggravation versus mitigation, be available for presentation at trial. The failure of police and prosecutors to disclose evidence of innocence and mitigation before and during trial is a common reason for the overturning of capital verdicts. Another reform that might reduce the rate of reversal is to have better-funded defense lawyers, because more experienced and better-prepared defenders can head off the errors at the trial stage that are currently taking up the time of our appellate courts to discover.110 Changing the method of selecting judges from election to appointment also might reduce error rates, given the association of higher error rates and the capacity of voters to discipline unpopular judges by voting them out of office.111 The effects of this last reform may be limited, however, given evidence from our study of case-level factors affecting reversals at the federal habeas stage of review that political influences on appointed judges (indicated by the party of the president who appoints federal judges) also may affect reversal rates.
109 Gross, supra note 9, at 487–92 (arguing that prosecutors’ strong desire to win convictions in homicide cases may alter their response to weak evidence in the pretrial period); Liebman, Overproduction, supra note 21, at 2032, 2068–69, 2082–98. 110 Vivian Berger, The Chiropractor as Brain Surgeon: Defense Lawyering in Capital Cases, 18 N.Y.U. Rev. L. & Soc. Change 245, 249–50 (1990–1991); Ruth E. Friedman & Bryan A. Stevenson, Solving Alabama’s Capital Defense Problems: It’s a Dollars and Sense Thing, 44 Ala. L. Rev. 1, 3–6, 40–60 (1992) (detailing problems faced in Alabama capital cases, and considering necessary reforms to compensation, training, and public defender institutions); Lefstein, supra note 40, at 505–12, 532–33 (summarizing effects of reform in Indiana to better fund and regulate capital defense lawyers); Note, Tinkering with the Machinery of Death: An Examination and Analysis of State Indigent Defense Systems and Their Application to Death-Eligible Defendants, 37 Wm. & Mary L. Rev. 1617, 1657–58 (1996) (encouraging states to establish capital defense trial units and qualification standards); Douglas W. Vick, Poorhouse Justice: Underfunded Indigent Defense Services and Arbitrary Death Sentences, 13 Buff. L. Rev. 329, 455–58 (1995) (advocating steps to assure that indigent defendants are not executed as a result of underfunded, inexperienced representation). 111
Bright & Keenan, supra note 30, at 817–22.
256
Death Sentence Reversals in the United States
Overall, our study does not lend much hope that error rates may be reduced by a large amount through these reforms if the total deathsentencing rate remains at the current level. The error rates have been high in almost all states,112 and our regression analyses found that factors such as political pressure on judges and increased death-sentencing rates were predictive of higher error rates. Error rates at the three review stages combined did not markedly decrease over the 23 years of administration of the death penalty that we studied, which suggests that experience is not enough to ensure strong verdicts. B. Streamlining the Appeals Process A direct way to reduce the reversal rate would be to change the rules so that appeals could be processed faster and with fewer grounds for reversal. Supreme Court Justice Rehnquist made a proposal of just this sort in 1981,113 and our case-specific analyses provide evidence that the Supreme Court’s subsequent narrowing and expediting of federal habeas review—particularly after Rehnquist became the Chief Justice—had the effect of reducing federal habeas reversal rates over time. After our study period, Congress limited federal habeas review even further through the Antiterrorism and Effective Death Penalty Act of 1996,114 and some states have recently adopted similar limitations on state court review of death verdicts. A slightly less direct, but effective, approach to the same goal is to withdraw public funding for lawyers who represent capital prisoners at the second (state postconviction) and third (federal habeas corpus) review stages, where no constitutional right to a lawyer applies. The federal statute took this step in 1996, as had Texas in 1995; Florida is considering a proposal to do the same starting in 2003. Our case-level study of factors associated with reversals at the federal habeas stage of review shows that the probability that reviewing courts will find serious error affecting capital verdicts and reverse those verdicts decreases when capital prisoners are represented by less skilled and less adequately funded lawyers.
112
See Figure 4.
113
See Coleman v. Balkcom, 451 U.S. 949, 956–64 (1981) (Rehnquist, J., dissenting) (decrying the system of endless capital appeals). 114
Pub. L. No. 104–132, 110 Stat. 1214 (codified in scattered sections of 28 U.S.C.).
Gelman et al.
257
The positive impact of such policies is questionable, however. Our study revealed evidence that lower rates of reversals by federal courts simply displaced more of the burden of reversing seriously flawed verdicts onto state courts, whose reversal rates thereafter rose. The change thus appears to have had little effect on the overall reversal rate and provides no evidence of declining rates of serious error. More generally, there is no reason to expect that making inspections less frequent and thorough would by itself diminish rates of error. Indeed, the opposite effect might be expected, as the declining deterrent influence of reversals leaves trial actors with more latitude to commit errors. Almost inevitably, therefore, the main result of such reforms will be the upholding of death verdicts with serious errors and the execution of persons who were not reliably found to be guilty or did not reliably satisfy the conditions required by law for a death sentence to be imposed.115 Recall that, under the current rules, death sentences often cannot be reversed unless there is judged to be a reasonable probability that the outcome of the case could have differed had the error not occurred. Even at the third stage of review, 40 percent of cases were found to have reversible errors. C. Reducing the Use of the Death Penalty Our habeas study suggests that it is in close cases—those in which a small amount of evidence might tip the outcome in a different direction—that the risk of serious error is the greatest. In addition, the overall deathsentencing rate is a strong predictor of reversal rate. These factors suggest that applying the death penalty more sparingly—to the “worst of the worst” offenders—would reduce the rate of error, as well as reducing the total burden on appellate courts and the absolute number of errors. Reducing the number of death sentences imposed may seem to be politically difficult. As recently as March 2003, for example, a Gallup poll found that 47 percent of Americans surveyed believe that the death penalty is applied “not often enough” (compared to 22 percent who believe it is applied “too often”).116 Although most Americans doubt that the death
115 Amsterdam, supra note 6, at 152–58 (arguing that fast-paced review, passing of responsibility, and rage-filled opinions vacating stays lead error to go unnoticed). 116
Gallup Poll, May 6–9, 2002, Public Opinion Online, available at LEXIS, News Library (detailing results from Question 11, accession #0404091).
258
Death Sentence Reversals in the United States
penalty deters crime, those who do believe the penalty is a deterrent may fear that imposing it less often would reduce its deterrent effect. There is evidence, however, that lower death-sentencing rates are not beyond reach. Support for the death penalty remained high from the early 1980s into the 1990s, with the proportion of respondents giving an affirmative answer to the question, “Are you in favor of the death penalty for a person convicted of murder?”, in the 75–85 percent range.117 Starting in 1995, however, support for the death penalty began dropping, to 71 percent in 2001.118 In all these calculations, we exclude those expressing no opinion. Death-penalty polls appear to be sensitive to precise wording. The Gallup poll, which asks “Are you in favor of the death penalty for a person convicted of murder?” consistently registers a few percentage points more support for the death penalty than the ABC/Washington Post poll, which asks, “Do you favor or oppose the death penalty for persons convicted of murder?” The drop in support for the death penalty has coincided with increasing concern about the risk of mistakes, with most survey respondents believing that between 3 and 10 percent of persons sentenced to death are innocent, and only 53 percent believing the death penalty “is applied fairly in this country today.”119 When the question is whether respondents prefer the death penalty to life without possibility of parole (the actual alternative to a death verdict in nearly all death-sentencing states), support for the death penalty drops to 52 percent, with 43 percent favoring life without parole and the
117
See Figure 10.
118
The extent of changes in support for the death penalty since the events of September 11, 2001, is unclear. On the Gallup poll, support for the death penalty (among those respondents who express an opinion) rose to 74 percent in May 2002 and 75 percent a year later, but declined to 66 percent as of October 2003. On the similarly worded ABC/Washington Post poll, support for the death penalty remained in the 69–71 percent range in six soundings from January 2000, to December 2003. On the Fox News/Opinion Dynamics poll, which measures opinions on the death penalty for “premeditated murder” (the other polls refer to “murder”), the figures for June 2001 and June 2003 were 76 percent and 75 percent. See Death Penalty, available at (last visited Mar. 23, 2004); Dalia Sussman, Poll: Most Oppose Clearing Death Row, ABCNews, Jan. 24, 2003, available at . 119
Samuel R. Gross & Phoebe C. Ellsworth, Second Thoughts: Americans’ Views on the Death Penalty at the Turn of the Century, in Beyond Repair?, supra note 1, at 7, 36; Jeffrey M. Jones, Plurality of Americans Believe Death Penalty Not Imposed Often Enough, Gallup Poll News Service, Mar. 12, 2003.
Gelman et al.
259
Percentage support for the death penalty 50 60 70 80
Figure 10: The proportion of adults surveyed who answered yes in the Gallup poll to the question, “Are you in favor of the death penalty for a person convicted of murder?”, among those who expressed an opinion on the question.
1940
1950
1960
1970 Year
1980
1990
2000
rest undecided.120 Depending on how the question is phrased, anywhere from 42 to 53 percent of the public now support a pause in executions while reforms are considered to make the death penalty more reliable.121 Even more important than attitudes are behaviors, which also have changed recently as doubts about the reliability of death verdicts have increased. From 1982—by which point most states that were going to reinstate the death penalty had done so—to 1999, the number of death sentences imposed in the United States each year remained between 250 and 320. In 1996, 319 capital verdicts were imposed; in 1998 and 1999, the number was 303 and 282, respectively. However, in 2000—the year Governor Ryan imposed a moratorium on executions after a spate of death-row exonerations there122—the number of new death verdicts dropped to 229.
120
Gross & Ellsworth, supra note 119, at 35, 48–50; Jones, supra note 119.
121
Gross & Ellsworth, supra note 119, at 46–48; Jones, supra note 119.
122 Jeffrey L. Kirchmeier, Another Place Beyond Here: The Death Penalty Moratorium Movement in the United States, 73 U. Colo. L. Rev. 1, 44–45 (2002) (crediting Governor Ryan’s denunciation of systemic problems in death sentencing as “the most important event in the
260
Death Sentence Reversals in the United States
In 2001 (the last year in which data are available), the number was 155— the lowest in 22 years.123 The recent trend has been for decreased capital sentencing and declining capital-error rates.
CONCLUSIONS When a state court gives a death sentence, there is a 68 percent chance that it will be overturned by a state or federal court because of serious error. We have also found that where the death penalty is applied more heavily, reversal rates are higher. These findings, along with many specific examples of death-sentencing mistakes, have led many leading figures to question the death penalty as it is currently implemented in the United States. For example, governor George Ryan declared a moratorium on executions in Illinois in 2000, and three years later he granted clemency to all 167 deathrow inmates in the state based on doubts about the reliability of its deathsentencing procedures. Similarly, Supreme Court Justice Sandra Day O’Connor—a death-penalty supporter throughout her career as an Arizona legislator and judge and then a U.S. Supreme Court Justice—said recently that “if statistics are any indication, the system may well be allowing some innocent defendants to be executed.”124 Other death-penalty supporters find no cause for alarm in high rates of court reversal in capital cases. The death-penalty advocates have two main arguments, which, interestingly, go in opposite directions. On one hand, they argue that appellate judges are politically biased or are reversing based on technicalities. On the other, they claim that the high reversal rates are evidence that the system works, because the courts are scrutinizing death verdicts carefully and finding errors. Our data suggest a more realistic view, in which appellate judges are neither anti-death-penalty zealots nor perfect error-detectors. Rather, they
Moratorium Movement”); Michael L. Radelet & Marian J. Borg, The Changing Nature of Death Penalty Debates, 26 Ann. Rev. Soc. 43, 56 (2000) (noting the moratorium imposed by the Illinois governor in response to exoneration of 12 death-row prisoners). 123
Snell & Maruschak, supra note 4, at 9.
124 See Editorial, O’Connor Questions Death Penalty, N.Y. Times, July 4, 2001, at A9; Maria Elena Baca, Justice O’Connor Critical of the Death Penalty, Star Trib. (Minneapolis), July 3, 2001, at A1.
Gelman et al.
261
are busy people (subject to some political pressure but less than that for trial judges) with dockets overflowing with death-sentence cases—and, it turns out that most of these cases are seriously flawed. As a byproduct, cases typically take a decade or more to get through the system, and the states that push through higher rates of death verdicts have higher rates of flawed cases. Death-penalty advocates sometimes dismiss the high reversal rate by claiming that appellate judges are politically biased or are reversing based on technicalities. In fact, just under 90 percent of the capital reversals were by elected state judges, and of the death penalties overturned by appointed judges, 54 percent were appointed by Republican presidents. Reversals are a national phenomenon, not concentrated in any particular circuit courts or regions of the country. It is hard to believe that all these elected judges, and appointed judges of both parties, are reversing thousands of cases based on technicalities. Actually, reversals occur when the correct outcome of the trial is in doubt. Eighty percent of state postconviction review reversals and over 70 percent of federal court reversals occur because of egregiously incompetent lawyering, prosecutorial misconduct or suppression of evidence, misinstruction of jurors, or judge or juror bias. It might seem desirable to “streamline” the appeals process, but this would do nothing toward solving the problems listed above, which occur at the original trial. Supporters of the death penalty also take the opposite tack, arguing that the high reversal rate indicates that the system works and that death sentences are scrutinized carefully. But this claim puts a large burden on appellate judges: now, instead of them being technicality-finding impediments to justice, they must become perfect at detecting lower court errors. Even if this were so, it cannot be an effective system to propel thousands of cases—most of which are flawed—at appellate courts. What is the purpose of the original trial courts in such a system? For whatever reason, they are pushing through a lot of weak cases and overloading the courts at the next level. The modern death penalty has been around for 30 years in this country, long enough to have established a pattern of long delays and extremely high error rates. But decades of experience in dozens of states and hundreds of counties also shows that places where the death penalty is used less often and reserved for the worst of the worst cases have lower error rates and put fewer innocent people on death row.