Journal of
Mechanical Science and Technology Journal of Mechanical Science and Technology 21 (2007) 896~902
A Built-in Active Sensing System-Based Structural Health Monitoring Technique Using Statistical Pattern Recognition Seunghee Parka,*, Jong-Jae Leea, Chung-Bang Yuna, Daniel J. Inmanb a
Smart Infra-Structures Technology, Korea Adv. Institute of Sci. and Tech., Daejeon, 305-701, Korea Center for Intelligent Material Systems and Structures, Virginia Tech, Blacksburg, VA, 24061, USA
b
(Manuscript Received November 16, 2006; Revised January 8, 2007) --------------------------------------------------------------------------------------------------------------------------------------------------------------------------------------------------------------------------------------------------------
Abstract A piezoelectric sensor-based health monitoring technique using a two-step support vector machine (SVM) classifier is developed for railroad track damage identification. A built-in active sensing system composed of two PZT patches was investigated in conjunction with both impedance and guided wave propagation methods to detect two kinds of damage in a railroad track (hole-damage 0.5cm in diameter at the web section and transverse cut damage 7.5cm in length and 0.5cm in depth at the head section). Two damage-sensitive features were separately extracted from each method: a) feature I: root mean square deviations (RMSD) of impedance signatures, and b) feature II: sum of square of wavelet coefficients for maximum energy mode of guided waves. By defining damage indices from these two damagesensitive features, a two-dimensional damage feature (2-D DF) space was made. In order to enhance the damage identification capability of the current active sensing system, a two-step SVM classifier was applied to the 2-D DF space. As a result, optimal separable hyper-planes (OSH) were successfully established by the two-step SVM classifier: Damage detection was accomplished by the first step-SVM, and damage classification was carried out by the second step-SVM. Finally, the applicability of the proposed two-step SVM classifier has been verified by thirty test patterns prepared in advance from the intact state and two damage states. Keywords: Structural health moniboring; Support vector machine classifier; Rail road track damage identification --------------------------------------------------------------------------------------------------------------------------------------------------------------------------------------------------------------------------------------------------------
1. Introduction Recently, a smart health monitoring system including low-cost but high-effect smart sensors such as piezoelectric sensors, optical fiber sensors, MEMS sensors, and wireless sensors, has emerged as a new structural health monitoring (SHM) strategy. In particular, a built-in SHM system using piezoelectric lead zirconate titanate (PZT) material has been prevalently investigated based on two kinds of significant damage detection methods: (a) impedancebased damage detection (Giurgiutiu and Rogers,
1997 ; Tseng et al., 2000 ; Park, G. et al., 2003 ; Park, S. et al., 2005) and (b) guided wave propagationbased damage detection (Giurgiutiu et al., 2003 ; Staszewski et al., 2004 ; Park, S. et al., 2006b). In this context, the present study introduces a built-in active sensing system in conjunction with both impedance and guided wave propagation methods to detect damage incurred in the section of a railroad track. And, a two-step SVM classifier is combined with the active sensing system for damage identification.
2. Pezoelectric sensor-based SHM techniques 2.1 Impedance-based damage detection technique
*
Corresponding author. Tel.: +82 42 869 3652, Fax.: +82 42 869 8290 E-mail address:
[email protected]
The coupling effect of the electro-mechanical
Seunghee Park et al. / Journal of Mechanical Science and Technology, 21(2007) 896~902
897
the impedance-based damage detection technique, root mean square deviation (RMSD) of the impedance signatures given by RMSD(%) = Fig. 1. Electro-mechanical system between PZT and host structure (Giurgiutiu and Rogers 1997).
∑
i=N i =1
(Re( Z (ωi )) − Re( Z 0 (ωi ))) 2
∑
i= N i =1
(Re( Z 0 (ωi ))) 2
×100
(2) where Z (ωi ) is the post-damage impedance signature at the i-th measurement point and Z 0 (ωi ) is the predamage value at the i-th measurement point, is used. Recently, an outlier analysis to obtain an optimal threshold value for damage detection was successfully applied to the impedance methods by Park, S. et al. 2006a. 2.2 Guided wave propagation-based damage detection technique
Fig. 2. Experimental setup for impedance-based damage detection.
impedance of a system with PZT and a host structure can be conceptually investigated as shown in Fig. 1 (Giurgiutiu and Rogers, 1997). The mechanical aspects of the PZT are described by its short-circuited mechanical impedance. The host structure is represented by its driving point mechanical impedance, which includes the effects of mass, stiffness, damping, and boundary conditions. The apparent electro-mechanical impedance of the PZT, as coupled to the host structure, is given by
Z total (ω ) = [iωC (1 − κ 312
Z s (ω ) )]−1 Z A (ω ) + Z s (ω )
(1)
where C is the zero-load capacitance of the PZT and κ 31 is the electromechanical coupling coefficient of the PZT (Giurgiutiu and Rogers, 1997). Changes of the mechanical properties of the host structure may be detected by monitoring the variations of the electro-mechanical impedance functions shown in Eq. (1). The experimental setup for the impedance-based damage detection techniques consists of an impedance analyzer (HP4194A), a personal computer that can control Matlab programs for data acquisition, signal processing and damage diagnosis, and a built-in PZT patch structural system, as illustrated in Fig. 2. For damage quantification of
Guided waves have been extensively utilized for damage detection of various kinds of structures due to their propagation properties that are highly sensitive to any discontinuities in materials (Staszewski et al., 2004). In particular, Lamb waves are the most widely used guided waves for damage detection techniques. Lamb waves are dispersive plate waves that indicate elastic perturbations propagating in a solid medium with doubly free boundaries, for which displacements occur both in parallel and perpendicular to the direction of wave propagation (Viktorov et al., 1967). If a set of transmitting and receiving PZT patches are placed on a structure, the received wave signal contains information about the integrity of the structure between two PZT patches. Unfortunately, however, the guided Lamb wave testing gets complicated by the dispersive nature and the multiple modes of the Lamb waves. Therefore, an attempt to find out a specific mode from the guided Lamb waves in the host structure should be made as shown in Fig. 3. In the present study, a specific mode that has maximum energy is considered. The experimental setup for the guided wave propagation-based damage detection techniques consists of a function generator with an amplifier, a digital oscilloscope, a personal computer that can control Matlab programs for data acquisition, signal processing and damage diagnosis, and a builtin PZT patch structural system, as shown in Fig. 4. Wavelet analysis can be implemented for a joint timefrequency analysis of the guided waves (Jeong et al., 2000). Using a selected mother wavelet function,
898
Seunghee Park et al. / Journal of Mechanical Science and Technology, 21(2007) 896~902
ψ (t ) , the continuous wavelet transform (CWT) of a
damage step’ and ‘before a corresponding damage
Fig. 5. Non-linear support vector machine (SVM) (Vapnik et al.1995)
step’, respectively, and l is the number of data points.
Fig. 3. Lamb waves dispersion curves.
Digital Oscilloscope
Pulser and/or Receiver
PZT
Data acquisition system PC controller
Lamb waves
4. Damage identification using support vector
Damage Diagnostic
machines
PZT
Damage Structure
Fig. 4. Experimental setup for guided wave propagationdamage detection techniques.
signal x(t ) is defined as
1 * t −b (3) ) dt ψ ( a a where the continuous variables a and b are the scale and translation parameters, respectively. In the present study, a “Morlet wavelet” is employed as a mother wavelet function (Sohn et al., 2003). (Wf )(b, a ) = ∫
+∞
−∞
x (t )
3. Damage index approach In this study, two kinds of damage-sensitive features are utilized: a) feature I: root mean square deviations (RMSD) of impedance signatures, and b) feature II: sum of square of wavelet coefficients for maximum energy mode of the guided waves. From these features, appropriate damage indices, which should reflect changes in the received data due to damage, are proposed as follows:
DFX =
Rd − R0 l
DFY =
(4)
R0
∑ (C i =1
l
) − ∑ (Ci0 ) 2
d 2 i
i =1
l
∑ (C
(5)
0 2 i
)
i =1
where R denotes RMSD, Ci refers to wavelet coefficients of the corresponding wave mode, the superscripts d and 0 are ‘after a corresponding
The Support Vector Machine (SVM) is an automated learning system that uses a hypothesis space of linear functions in a high dimensional feature space (Vapnik et al., 1995). The simplest model is called a linear SVM, and it works for data that are linearly separable in the original feature space only. In the early 1990s, nonlinear classification using the same procedure as the linear SVM became possible by the introduction of nonlinear functions called kernel functions without being conscious of actual mapping space (Vapnik et al., 1995). This extended technique of nonlinear feature spaces is called nonlinear SVM and is illustrated in Fig. 5. Assume a training sample S consisting of vectors xi ∈ R n with i = 1,..., N , and each vector xi belongs to either of two classes and thus is given a label yi ∈{−1,1} . The pair of ( w , b) defines a separating hyper-plane given by the following equation:
S = ((x1 , y1 ),..., (x N , yN ))
(6)
( w ⋅ x) + b = 0
(7)
where w and b are arbitrary constants. However, Eq. (7) can possibly separate any part of the feature space, therefore one needs to establish an optimal separating hyper-plane (OSH) that divides S leaving all the points of the same class on the same side, while maximizing the margin which is the distance of the closest point of S . The closest vector xi is called support vector and the OSH ( w ',b ') can be determined by solving an optimization problem. The resulting SVM is called as the maximal margin SVM. In order to relax the situation, the maximal margin SVM is generalized by introducing non-negative slack variables ξ = (ξ1 , ξ 2 ,..., ξ N ) as follows:
899
Seunghee Park et al. / Journal of Mechanical Science and Technology, 21(2007) 896~902
subject to
1 ( w '⋅ w ') + C ∑ ξi , 2 yi ( ( w '⋅ xi ) + b ' ) ≥ 1 − ξi ,
d ( w ') =
i = 1, 2, ...,N , ξ ≥ 0.
(8)
The purpose of the extra term C ∑ ξi , where i = 1,..., N , is to maintain control of the number of misclassified vectors. The parameter C can be regarded as a regularization parameter. The OSH tends to maximize the minimum distance of 1 w with a small C , and minimize the number of misclassified vectors with a large C . To solve the case of nonlinear decision surfaces, the OSH is carried out by nonlinearly transforming a set of original feature vectors xi into a high-dimensional feature space by mapping Φ : x i a z i and then performing the linear separation. However, it requires an enormous computation of inner products (Φ(x) ⋅ Φ(x i )) in the high-dimensional feature space. A kernel function that satisfies the Mercer’s theorem given in Eq. (9) significantly reduces this process (Vapnik et al., 1995). The most widely utilized kernel function machines with convolution function are given in Eq. (10) (Duda et al., 2000). The appropriate kernel function machine and its parameters can be selected based on the criteria to maximize the minimum distance of 1 w in Eq. (8) and to minimize the number of the support vectors (Mita et al. 2004). (Φ ( x ) ⋅ Φ ( x i )) = K ( x , xi ) ⎧ K (x, xi ) = (x ⋅ xi + 1)d ⎪ 2 x − xi ⎪ ⎪ K (x, xi ) = exp(− 2σ 2 ) ⎪ ⎨ 2 ⎪ x − xi ) ⎪ K (x, xi ) = exp(− 2 2σ ⎪ ⎩⎪ K (x, xi ) = tanh(α (x ⋅ xi ) + β )
(9)
polynomial kernel function radial basis kernel function exponentail radial basis kernel function sigmoid kernel function
(10) where d , σ , α , and β are parameters.
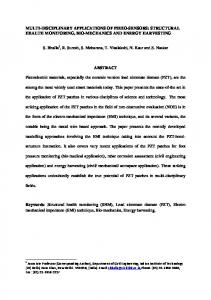
5. Validation of the proposed approach An experimental study was carried out to validate the applicability of the proposed approach for health monitoring of a railroad track. A railroad track section with a length of 140 cm was used as a test specimen, as shown in Fig. 6. Two PZT patches of 2.5cm x 2.5cm were surface mounted with a distance of 900mm on the sidewall of the web of the specimen. Two kinds of damage (hole-damage 0.5cm in diameter at the web section and transverse cut
Fig. 6. Test specimen and a built-in PZT patch. Impedance Measurement at 40-50 kHz 13 Baseline intact1 intact2 intact3 hole1 hole2 hole3 cut1 cut2 cut3
12 11 10
Re(Z)
Minimize
9 8 7 6 5 4
4.1
4.2
4.3
4.4
4.5
4.6
Frequency (HZ)
4.7
4.8
4.9
5 4
x 10
Fig. 7. Impedance signatures at PZT #1.
damage 7.5cm in length and 0.5cm in depth at the head section) were artificially inflicted sequentially, as illustrated in Fig. 6. First, the baseline signals were recorded in conjunction with both impedance and guided waves. Impedance measurement was carried out over a frequency range of 40 kHz to 50 kHz at PZT #1. Concurrently, a single pair of pitch-catch guided wave propagation data with an input signal of 3-cycle 50 kHz sine function in a magnitude of 10V at PZT #1 was recorded at PZT #2, and mode selection was performed through a wavelet analysis. Measurement under a different sensor configuration wherein PZT #1 and PZT #2 (PZT #1 ↔ PZT #2) are switched each other was also performed for both methods with the purpose to be used as test patterns to verify the effectiveness of the proposed SVM classifier. The same procedures were repeated ten times by considering temperature varying application for all damage cases. Ten training patterns for each case were generated from repeating heating and cooling using hair dryer at a range of 10˚C to 60˚C. The typical results are displayed in Figs. 7 and 8, respectively. The damage-sensitive features explained previously were extracted, as shown in Fig. 9. As shown in Fig. 9(a), it was clearly observed from the several time repeated measurements that feature I could not detect the hole damage, even though it could detect the cut damage. In addition, Fig. 9(b) presents that feature II did not show any visible changes due to either damage. In order to overcome
900
Seunghee Park et al. / Journal of Mechanical Science and Technology, 21(2007) 896~902 -3
1
x 10
Amplitude(V)
Original signal
0.5 0 -0.5 -1 0
1
2
3 4 Time(sec)
5
6 -4
x 10
Original signal (non-filtered) at PZT #2 -3
x 10
Wavelet response signal Magnitude
2
0
-2 0
50 100 150 200 250 300 No. of Data Points from Zero (time step)
(b) Wavelet response signal (non-scale) at PZT #2 Fig. 8. Guided waves (PZT #1 → PZT #2) and wavelet response signal.
(a) Feature I: RMSD from impedance signatures
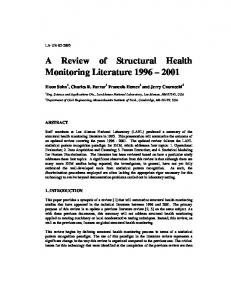
these deficiencies, the damage indices defined in Eqs. (4) and (5) were calculated, and plotted on a twodimensional damage feature (2-D DF) space. As shown in Figure 10, it is observed that two kinds of damage were discriminated from the intact state on the 2-D DF space. Moreover, the optimal separable hyper-planes (OSH) were successfully established by using the previously described two-step SVM classifier. Specifically, damage detection was performed by the first step-SVM [Fig. 10(a)], and damage classification was carried out by the second step-SVM (Fig. 10(b)). Finally, thirty test patterns prepared in advance were investigated to verify the effectiveness of the proposed SVM classifiers. The obtained results indicate that SVM classifier yields excellent damage identification performance, as shown in Fig. 11. Every output except one test pattern gave the same values as the own original target values (damage estimation rate of 96.67 %).
6. Conclusions A built-in active sensing system using a two-step support vector machine (SVM) classifier was develo ped for railroad track damage identification. The current system composed of two PZT patches was investigated in conjunction with both impedance and guided wave-based damage detection methods to detect real damage of the railroad. A two-step SVM classifier was successfully combined with the system: damage detection was performed by the first stepSVM and damage classification was carried out by the second step-SVM. Finally, the applicability of the proposed SVM classifier has been verified though experiments where a damage estimation rate of 96.67% was obtained. The results reported here
(b) Feature II: Sum of square of wavelet coefficients for maximum energy mode of guided waves Fig. 9. Damage-sensitive feature extractions.
Seunghee Park et al. / Journal of Mechanical Science and Technology, 21(2007) 896~902
Intact Damage 1 Damage 2
0.025
DF
Y
0.02 0.015 0.01 0.005 0 -0.005
0
1
2
DF
901
provide motivation to apply the current active sensing system to in-service railroad track by implying the automated on-line health monitoring technique. Significant safety enhancement and cost savings are expected through the wide implementation of these novel methods for health monitoring of real-world railroads.
3
X
2-D Damage Feature Space
Acknowledgements The work was jointly supported by the Smart InfraStructure Technology Center (SISTeC) at KAIST, by the Korea Science and Engineering Foundation and the Infra-Structure Assessment Research Center (ISARC), the Ministry of Construction and Transportation, Korea, and the Railway Tech Laboratories of The United States. This financial support is greatly appreciated.
(a) 1st SVM: Damage Detection
(b) 2nd SVM: Damage Classification Fig. 10. Optimal separable hyper-planes (OSH) by two-step SVM classifier.
(Original target values)
References Duda, Richard O., Hart, Peter E. and Stork, David G., 2000, Pattern Classification (2nd Edition), WileyInterscience. Giurgiutiu, V., 2003, “Lamb Wave Generation with Piezoelectric Wafer Active Sensors for Structural Health Monitoring,” Proc. of the SPIE Conf. on Smart Str. and Mat., San Diego, CA, 5056, 111~122. Giurgiutiu, V. and Rogers, C. A., 1997, “ElectroMechanical (E/M) Impedance Method for Structural Health Monitoring and Nondestructive Evaluation,” International Workshop on Structural Health Monitoring, 433~444, Stanford University, September 18~20, CA. Jeong, H. and Jang, Y., 2000, “Wavelet Analysis of
(SVM-based estimation values)
Fig. 11. Damage identification on two-dimensional damage feature space. (Damage estimation rate of 96.67%)
902
Seunghee Park et al. / Journal of Mechanical Science and Technology, 21(2007) 896~902
Plate Wave Propagation in Composite Laminates,” Composite Structures, 49, pp. 443~450. Mita, A. and Taniguchi, R., 2004, “Active Damage Detection Method Using Support Vector Machine and Amplitude Modulation,” Proceedings of 11th International SPIE Symposium on Smart Structures and Materials, San Diego, CA, 5391, pp. 21~29. Park, G., Sohn, H., Farrar, C. R. and Inman, D. J., 2003, “Overview of Piezoelectric Impedance-Based Health Monitoring and Path Forward,” The Shock and Vibration Digest, 35(6), pp. 451~463. Park, S. Inman, D. J., Yun, C.-B., Park, G., 2006a, “An Outlier Analysis for Damage Detection of Railroad Tracks Using MFC Impedance-Based Wireless SHM System,” The 3rd International Workshop on advanced smart materials and smart structure technology, Lake Tahoe, CA, in press. Park, S., Yun, C.-B., Roh, Y. and Inman, D. J., 2006b, “Active Sensing Network System for Crack Detection on Welded Zone of Steel Truss Member,” Proceedings of the SPIE Conference on Smart Structures and Material, San Diego, CA, 6174, pp. 384~394.
Park, S., Yun, C. B., Roh, Y. and Lee, J. J., 2005, “Health Monitoring of Steel Structures Using Impedance of Thickness Modes at PZT patches,” Smart Structures and Systems, 1(4), pp. 339~353. Sohn, H., Park, G., Wait, J. R., Limback, N. P. and Farrar, C.R., 2003, “Wavelet-Based Active Sensing for Delamination Detection in Composite Structure,” Smart Materials and Structures, 13, pp. 153~160. Staszewski, W. J., 2004, “Structural Health Monitoring Using Guided Ultrasonic Waves” In Advances in Smart Technologies in Structural Engineering, J. Holnicki-szulc and C. A. Mota Soares, eds., Berlin: Springer, pp. 117~162. Tseng, K. K., Soh, C. K., Gupta, A. and Bhalla, S., 2000, “Health Monitoring of Civil Infrastructures Using Smart Piezoceramic Transducers,” 2nd Int. Conf. on Comp. Meth. For Smart Str. And Mat., pp. 153~162. Vapnik, V. N., 1995, The Nature of Statistical Learning Theory, Springer. Viktorov, I. A., 1967, Rayleigh and Lamb WavesPhysical Theory and Applications, New York Pendulum.