performs almost as well as a dedicated cache of the same capacity. Based on these .... All Oracle processes, server as well as background processes, share a large memory ... non-critical writes of the redo log buffers. Our tuned version of ODB ...
A Case for Shared Instruction Cache on Chip Multi-processors Running OLTP Partha Kundu, Murali Annavaram, Trung Diep, John Shen Microprocessor Research, Intel Labs (MRL)
Abstract With increasing number of transistors available on a single die, chip multiprocessors are rapidly gaining favor among processor architects; these chip multiprocessors (CMP) are characterized by relatively simple processor cores that emphasize thread-level parallelism (TLP) over instruction-level-parallelism (ILP). Important commercial applications, such as on-line transaction processing (OLTP), have notoriously meager ILP and are instead heavily bottlenecked by memory stalls. These applications, however, exhibit abundant TLP and are eminently suitable for execution on a CMP. This paper analyzes the behavior of an OLTP workload, called the Oracle Database Benchmark (ODB), on CMPs. In particular, it focuses on an important, although less studied, facet of OLTP workloads: the instruction stream. Our results show that due to the large code footprint, OLTP suffers from high I-cache miss rates when using typical first level I-cache sizes seen on contemporary microprocessors. Although, the overall code footprint of ODB is large, multiple ODB threads running concurrently on multiple processors tend to access common code segments frequently, thus exhibiting significant constructive sharing. In fact, in a CMP system, a shared cache of a given size performs almost as well as a dedicated cache of the same capacity. Based on these observations, this paper makes a case for a shared I-cache organization in a CMP, instead of the traditional approach of using a dedicated I-cache per processor. Furthermore, this paper shows that OLTP code stream exhibits good spatial locality. Adding a simple dedicated Line Buffer per processor can exploit this spatial locality effectively, to reduce latency and bandwidth requirements on the shared cache. The proposed shared I-cache organization results in an improvement of at least 5X in miss rate over a dedicated cache organization for the same total capacity.
1
Introduction
Until recently processor designers chose to push the limits of instruction level parallelism (ILP) and speculation to improve performance. There is evidence however, that products seeking to push the envelope on ILP using traditional micro-architectural techniques, are impeded by increasing design and product development cost which may in time make such approaches to processor design, un-sustainable [4]. The increasing design complexity argues for a processor architecture that invests the transistor budget on exploiting the parallelism that is expressed more explicitly in the form of threads, thread level parallelism (TLP), than in extracting implicit ILP such as that done in contemporary super-scalar processors.
Page 1 of 22
Submitted to PACT ‘03
On the application front, the increasing need to store and query large volumes of data has made On Line Transaction Processing (OLTP) a commercially lucrative market for large shared memory parallel systems. Some recent studies suggest that OLTP exhibits radically different behavior compared to commonly used benchmarks in architectural studies (e.g. SPEC)[6]. They have meager ILP and are heavily bottlenecked by memory stalls caused by their larger instruction and data footprints. OLTP applications however, exhibit abundant TLP, which arises from concurrent independent queries initiated by different clients. Thus, there is to an extent, a natural disconnect between micro-architectures that focus on exploiting ILP and the demands of OLTP workloads that exhibit TLP. With silicon technologies on the threshold of a billion transistors, the era of Chip Multiprocessor (CMP) has already arrived [18][1][3][2]. Current CMPs allow a modest number of processors (28 processor cores) to be integrated along with a relatively large cache memory on a single silicon die. Barroso et al. [2] proposed Piranha, a research prototype CMP that integrates eight simple Alpha processor cores along with a two- level cache hierarchy onto a single chip. Piranha was able to outperform its next- generation processors by up to 5 times on OLTP, essentially by allowing 8 thread contexts to execute concurrently. [2] however, primarily focused on improving the D-cache performance and did not analyze design alternatives for I-cache. Several other recent studies analyzed memory system behavior of databases running on Alpha processors [5][8][10][11]. Ranganathan et al. [11] used trace-driven simulations to show that an ideal instruction supply would yield 30% better performance, over all other improvements on the core, e.g. perfect branch predictor, very large instruction window and infinite functional units. Ailamaki et al. [7] analyzed three commercial DBMSs on a Xeon processor and showed that TPC-D queries spend about 20% of their execution time on L1 instruction cache miss stalls. Given the significant performance degradation due to instruction supply bottleneck, we believe that improving instruction cache behavior of OLTP is an important first step toward designing an efficient CMP for OLTP in the future.
Page 2 of 22
Submitted to PACT ‘03
Previous research [24] has shown improvement of about 55% reduction in I- cache miss rate through static code placement. This paper builds upon efficient code placement in software to build a better cache system, specifically in the context of a CMP. This paper makes three main contributions. First, it characterizes the instruction stream of one of the most commonly deployed enterprise class databases in the industry - the Oracle database configured to run an OLTP workload. Second, it shows that although the I-cache footprint of ODB is large, multiple ODB threads tend to access common functions frequently, thus exhibiting significant constructive behavior. Third, the paper proposes a prototype I-cache organization that departs from the traditional approach of using first- level caches in a CMP; exploiting the spatial locality found in ODB to pre- fetch aggressively, the paper proposes using a Line Buffer at the first- level, backed by a larger shared cache using a high-bandwidth data interconnect. The rest of the paper is organized as follows: Section 2 explains our workload tuning and system level simulation methodology. Section 3 presents the baseline cache organization, against which improvements in the paper are compared. Section 4, presents a capacity characterization of the OLTP workload. In section 0, we examine the effects of multi-processing on a shared instruction cache. In sections 6, we characterize the effect of placing a small buffer (called a Line Buffer) close to a processor core. Section 7, describes the new cache organization and presents the gains achieved from the proposed organization. 2 2.1
Workload and Simulation Environment Setup Benchmark Description
In this study, we used an Oracle 8.1.6 based OLTP workload, which we call the Oracle Database Benchmark (ODB) [15]. ODB simulates an order-entry business system, where terminal operators (or clients) execute transactions against a database. The database is made up of a number of warehouses. Each warehouse supplies items to ten sales districts, and each district serves three thousand customers. Typical transactions include entering and delivering customer orders, recording payments received from customer, checking status of a previously placed order, and query the system to check inventory levels at a warehouse. When ODB starts execution, it spawns three types of processes: user processes, server processes and background processes. A user process executes client’s application code, such as parsing a
Page 3 of 22
Submitted to PACT ‘03
query, and submits an appropriate data access request to a server process. A server process accesses database on behalf of a user and provides user requested data. More than 90% of ODB execution time is spent in server processes. Background processes perform database maintenance tasks such as log management, committing modified data to disk, and managing locks amongst competing server processes. All Oracle processes, server as well as background processes, share a large memory segment called the System Global Area (SGA). A large portion of SGA is devoted to the database buffer cache, which holds the working set of a database in memory. The database buffer cache tracks the usage of the database blocks to keep the most recently and frequently used blocks in memory, significantly reducing the need for disk I/O. 2.2
Setup and Validation of ODB
Several previous stud ies ([5][6][7][9]) analyzed OLTP workloads based on monitoring existing systems using performance counters. Monitoring studies can quickly analyze large-scale production systems and can identify critical performance bottlenecks. These studies are, however, limited to studying existing processor and system configurations and have limited capability to explore new design choices. Nevertheless, monitoring existing systems is an important tool for quickly tuning and scaling complex OLTP workloads. In our study, we used this approach to tune ODB on native hardware before starting simulations. Commercial workloads, such as ODB, need careful tuning to reduce I/O wait time. A production ODB run typically uses hundreds of warehouses and requires hundreds of gigabytes of disk space and tens of gigabytes of physical memory. Such a setup is typically not amenable for detailed system level simulation studies. Hence, in this study we use an in- memory ODB setup, where the working set fits in memory with negligible amount of disk I/O. To achieve the goal of running ODB completely in- memory we tune the setup parameters; increasing the SGA size, reducing the number of warehouses to reduce the working set size, and using enough clients for optimal concurrency. Tuning requires repeated execution of user transactions after modifying each setup parameter and even building database from scratch multiple times. Since these operations are very time consuming, we first develop and test ODB on a native machine before running on a simulator. We use a Pentium III system with 2 GB main memory and 70 GB disk space. Initially we use a 50-warehouse ODB workload. Our measurements from the native machine execution show that Page 4 of 22
Submitted to PACT ‘03
the idle loop overhead due to I/O stalls is nearly 50%. By trial and error, we scale down the ODB workload to use 10 warehouses, which occupies 35 GB of disk space. We configured the Oracle server to use 1.5 GB of memory for SGA, which is sufficient to cache frequently accessed database tables and metadata in main memory. Nevertheless, some disk I/O does occur; mostly non-critical writes of the redo log buffers. Our tuned version of ODB has less than 2% idle loop overhead. After tuning ODB, we build a complete and exact disk image of the ODB workload that can then be executed by the Simics [13] simulator. 2.3
Tracing Using Full System Simulator
We use Simics, a full system simulator, to simulate the tuned ODB workload identical to that ran on the native hardware. Figure 1 graphically depicts the various steps involved in our tuning and simulation process. Simics is a complete system- level simulator that is capable of booting several unmodified commercial operating systems and running unmodified application binaries. Since we tuned ODB on a Pentium III running Linux Red Hat 7.2, we configured Simics to model a Pentium III processor running Red Hat Linux 7.1. We built a disk image of the tuned ODB for loading into Simics. We simulate ODB on Simics for sufficiently long time to warm up the main memory buffer cache in the simulator. We use Simics checkpoint capability to store a snapshot of the memory and disk state after warming up the database. Checkpointing allows us to start the simulation from exactly the same state each time we ran our simulation.
We use these
checkpoints for collecting traces used in this study. BUILD DB
RUN QUERIES
NATIVE EXECUTION OS BOOTUP
DISK MOUNT
MONITOR RUN
TUNED ODB
DISK IMAGE
ADJUST SETUP
ODB SETUP
SIMICS SIMULATION
ODB WARMUP
ODB MEASURE
CHECK POINT
TRACES
Figure 1 Tuning and Simulation Methodology
Simics provides a default trace module that is capable of generating instruction and data traces. We modified the trace module to generate information such as virtual and physical addresses of instruction and data, instruction type (e.g. branch instruction, memory instruction), instruction length, instruction assembly, and process ID of the process that generated a trace record. We run Page 5 of 22
Submitted to PACT ‘03
all benchmarks for one billion instructions from the checkpoint and collect instruction and data traces that were then analyzed using our internal cache analysis tools.
3
Description of Baseline Architecture
CPU0
L1D
Proc
Proc
0
0
………
L1I
L2 Bank0
CPU 7
L1D
………
L1I
L2 Bank7
Figure 2 B aseline Cache Organization
Figure 2 shows the on-chip cache organization as described in [2]. The memory controller and packet router are not shown. There are eight processors (CPU0-7) on the chip. Each CPU has its own dedicated I- and D-cache. The first- level caches are connected to each other and to the second- level larger unified cache through a high bandwidth, intra-chip switch. The first- level caches are each 64KB, 2 way set associative. This design will be referred to as the baseline throughout the course of this paper.
4
ODB Instruction Cache Characteristics
In the first part of this section, we present some profile data of a typical ODB run-time trace. In the second part, we present characterization data for a range of I-cache parameters. The data presented in this section is for a uni-processor system.
Page 6 of 22
Submitted to PACT ‘03
4.1
ODB Code Footprint Profile
In order to obtain an execution profile of the ODB code stream, we blocked the ODB code
18828
17721
16614
15507
14400
13292
12185
11078
99712
88640
77568
66496
55424
44352
33280
22208
11136
100 90 80 70 60 50 40 30 20 10 0 64
% of all references
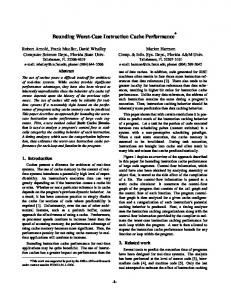
references into unique chunks of 64 bytes each. We then collected statistics on the execution
Cache Size needed (bytes)
Figure 3 ODB Execution Profile
frequency of these chunks. The unique chunk addresses are then sorted in descending order of execution frequency. Figure 3 shows the cumulative fraction of instructions that a given footprint covers. The data shows that the footprint grows exponentially, relative to the fraction of code executed. For instance, the graph shows that less than 27 KB of space is needed to capture 50% of the dynamic instruction reference stream while more than 330 KB of space is needed to capture 95% of the reference stream. Figure 4 captures the average number of instructions executed in between repeated references to
the same code chunk. This chart provides an indication of the temporal locality that exists for the various fractions of the footprint. The data show that 50% of the code chunks are re-executed within 2000 instructions. Therefore, we conclude that although ODB code footprint is significantly large, more than 50% of the references can fit within a modest 32 KB cache if there are no capacity or conflict misses inflicted by the remaining code chunks. Furthermore, ODB does have a good temporal locality due to code reuse.
Page 7 of 22
Submitted to PACT ‘03
20000
Distance in Instructions
18000 16000 14000 12000 10000 8000 6000 4000 2000 0 10% Refs.
20% Refs.
50% Refs.
95% Refs.
Figure 4 Avg. Distance Before a Repeat Access to a Chunk
4.2
Impact of I-cache Size
In this section, we look at cache behavior when running the ODB code. Figure 5 shows the miss rates (misses per 1000 instructions) for a range of cache capacities. As shown, miss rates decrease steadily, until about 512 KB, which represents the 99-percentile point of the full ODB dynamic trace. These results show that the overall code footprint of ODB is significantly larger than the typical I-cache sizes seen in current processors. 4.3
Impact of I-cache Associativity
Figure 5
plots the effect of associativity on the miss rate, for 3 sets of data. At the range of
capacities typically used in the first- level I-cache, we see that increasing the associativity of the cache has little or no effect on miss rates. Capacity misses dominate the overall miss rate, thus making the conflict misses a negligible fraction of the total misses. However, when using larger cache sizes, miss rates drop by nearly 50% as the associativity is increased from 2 to 8. These results are consistent with those reported by Barroso et al [10].
Page 8 of 22
Submitted to PACT ‘03
Miss rate per 1000 instr.
60 50 40 2 ways 30
4 ways 8 ways
20 10 0 8K
16K
32K
64K 128K 256K 512K 1M
2M
Figure 5 Effect of I-cache Size on Miss Rate
4.4
Impact of Line Size
Figure 6 shows the effect of increasing line size on miss rates. Increasing the line size in essence implies pre-fetching the next, few cache blocks, before there is a demand for them.
Miss rate per 1000 inst.
60 50 40 64 bytes 30
128 bytes 256 bytes
20 10 0 8K
16K 32K
64K 128K 256K 512K 1M
2M
Figure 6 Effect of Line Size on Miss Rate
At lower capacities, the effect of such pre- fetching is very pronounced, much more than at much larger capacities. For the relatively small cache capacity, employed at the first- level I-cache, we see that miss rates may be reduced quite significantly by increasing the line size.
Page 9 of 22
Submitted to PACT ‘03
Later in Section 6 we exploit this feature in ODB code to pre- fetch instruction bytes in advance and thereby hide the longer latency of the proposed Shared Cache. 5
Shared Cache for CMP
As mentioned in section 1, a chip multiprocessor (CMP) is particularly attractive for OLTP workloads. In previously proposed CMP designs, however, the first- level I- (and D-) caches are replicated for each CPU thereby distributing the allocated cache budget amongst several processors. For instance, on an 8-way CMP, even when the net I-cache capacity is 512 KB, each processor only sees the benefits of its own 64 KB cache. In this section, we study the I-cache performance of ODB on a CMP. In particular, motivated by the observation that ODB has a large code footprint, we explore the effects of combining the dedicated caches of each CPU to form a larger Shared Cache. We examine two multiprocessor configurations - 2P and 4P - with an I-cache shared between the multiple CPUs. For all the CMP studies, we chose a single instruction trace collected from ODB running on a simulated 4-way SMP system. To simulate a 2P configuration we arbitrarily choose the instruction trace records from two of the four processors in the trace (P0 and P1). Using a single trace to model two different CMP configurations reduces the variability that often results from examining different MP setups [20]. Furthermore, simulating on the same trace, allows all configurations to operate on an ident ically loaded system. Figure 7 shows the effects of consolidating dedicated I-caches per CPUto form a larger Shared
Cache for various cache sizes. The x-axis represents the cache capacity allocated per CPUin a CMP. The 2P curve shows the improvement in miss rate, when the capacity is doubled and the doubled capacity shared between two processors. The 2X curve shows the performance advantage if a single processor used the capacity-doubled cache. The 2X curve consistently lies above the 2P curve, effectively showing that a Shared Cache in this case, never beats a Dedicated Cache at the same capacity. The divergence between the two curves represents the performance lost due to sharing on a same sized cache. Similarly, the 4X/4P curves represent the effects of combining four dedicated caches to form a single shared case.
Page 10 of 22
Submitted to PACT ‘03
Improvement of increase
120.00% 100.00% 80.00%
2X 2P
60.00%
4X 4P
40.00% 20.00% 0.00% 8K
16K 32K
64K 128K 256K 512K 1M
2M
Figure 7 Miss rate of Shared Cache
In Figure 7, we see that for a 4P system, starting with a dedicated cache of 64KB per CPU to obtain a Shared Cache of 256KB, we realize a gain of almost 65% (4S curve corresponding to 64KB). For comparison, we note that if the entire 256KB is used by only one processor (4X curve), then the miss rate of the Shared Cache comes to within about 4% of the miss rate of a Dedicated Cache. 5.1
Constructive vs. Destructive effects in a Shared Cache
In order to understand the beneficial effects of a shared cache, we focus on two effects: 1. Capacity Increase: When cache blocks are shared between two or more processors, then in effect on a Shared Cache, we save the cache space that would otherwise be replicated in each Dedicated Cache. This implies that there is more room in the cache (for blocks being used exclusively by a single processor). The capacity seen by a processor is thus seen to have increased over and above that of a dedicated cache organization. 2. Pre-fetching: When a block that is demand fetched by one processor also ends up being used by another processor, then the first processor may be said to have pre-fetched the block for the second processor. The effect of capacity increase is measured by counting the fraction of blocks in the cache that are shared by two or more processors. In Table 1 we report the average number of such occurrences (% blocks shared) over the duration of the simulation run, for each of the 2P and 4P cases.
Page 11 of 22
Submitted to PACT ‘03
The effect of pre-fetching of blocks by one processor for other processor(s), is measured by counting the number of instances when a processor finds a block in the cache that is in use by one or many processors except itself. As such, these references are likely to be certain misses in the Dedicated Cache of this processor. If the program phases of the processors were to line up exactly, one processor will always fetch for another processor. The total number of misses will therefore be amortized over the combined accesses of the two processors (in a 2P system). In the ideal situation, this can lead to halving (in a 2P) of the original miss rate as seen by a single processor. Table 1 shows the number of such blocks as a fraction of the total number of references (Blocks pre-fetched). To counter-act the above beneficial effects of a shared cache, references from multiple processors may conflict on the cache index and thus replace blocks that are being used by another processor. We term these as destructive misses. We measure destructive misses by counting the average number of blocks that are replaced by a processor not using the block, before being brought back into the cache by one of the processors that was using the block prior to the replacement. Table 1 shows the number of such blocks as a fraction of the total number of references (Destructive Misses).
% blocks shared
Blocks pre-fetched
Destructive Misses
(per 1000 instructions)
(per 1000 instructions)
2P
4P
2P
4P
2P
4P
42.12%
54.33%
2.37
5.39
10.17
10.78
Table 1 Constructive & Destructive Effects of a 256KB Shared Cache
In Table 1 we present the data for a 256KB cache shared between 2 processors (2P) and 4 processors (4P). The first column (% blocks shared) presents the measure of capacity increase as described above. Similarly, the column (Blocks pre-fetched) shows the effect of pre-fetching by one processor for another. As mentioned above, these misses would likely be certain misses in a Dedicated Cache. Finally, the last column shows the effect of destructive interference by one processor on other(s). The destructive misses constitute 99% of all misses on a Shared Cache system. Later in Section 7.1 we will see a dramatic improvement in the miss rate as these destructive misses are reduced.
Page 12 of 22
Submitted to PACT ‘03
Not only do the destructive misses decrease the fraction of conflict misses, but by reducing them, we enhance the effects of capacity increase and pre-fetching on the Shared Cache.
5.2
Clustering of functions in ODB
In this section, we will attempt to develop an intuition into the way different threads in ODB share their code stream. We refer back to Figure 4, which classified functions as being the top 10%, 20% and 50% of the execution profile. This classification is merely for illustration purposes. We see that these classes of functions are called on an average, every 100, 700 and 2000 instructions, respectively. Thus, the functions in the top 10% ha ve better temporal locality than the functions in the top 20% and so on. MP
Avg. Cycles before Functions Re-executed
configuration
(in instructions) 10%
20%
50%
1P
262
528
1702
2P
284
544
1749
4P
320
701
2569
Table 2 Periodi city of ODB Functions
Multiple Oracle server threads operating concurrently have a profile similar to a single thread running alone as shown in Table 2. Therefore, we see that although the code footprint of ODB is very large, multiple threads spend a good deal of time executing some common functions. These functions are well served by a shared cache. Conversely, when threads execute paths that do not intersect in time with other threads, then these references tend to conflict and create misses that we term destructive. 6
A Line Buffer to replace the dedicated I-cache
Section 0 shows the benefits of a shared instruction cache over a dedicated cache scheme for ODB. There are, however, a number of engineering obstacles to designing a shared I-cache. A single Shared Cache servicing multiple CPUs would be expected to deliver a much higher bandwidth than a Dedicated Cache serving a single CPU. Furthermore, if the larger Shared
Page 13 of 22
Submitted to PACT ‘03
Cache has longer access latency than a smaller Dedicated Cache, the increased latency can potentially stall the processor pipeline, thereby negating the effects of a lower miss rate. For instance, replacing four dedicated caches with one large shared cache would necessitate a fourfold increase in request traffic to the shared cache. Similarly, increasing the cache size four- fold from 64KB to 256KB would increase the latency of the cache by almost 50% [17]. In order to alleviate the bandwidth and latency constraints, we propose adding a per processor Line Buffer to the Shared Cache. In this Section, we show that by aggressively pre-fetching 4-8 blocks in advance and storing these fetched blocks in a Line Buffer, we achieve a miss rate equal to that of the baseline I-cache. By achieving a miss rate equal to that of the baseline, the request bandwidth to the shared cache is drastically reduced – so that for a cluster of four processors, the net request bandwidth to the Shared Cache is no worse than that of a Dedicated Cache. Wilson, et al. [17] proposed a Line Buffer to augment the data cache of super-scalar processors. The Line Buffer proposed in [17], was a simple cache-block wide structure that held the last cache block accessed. They found that a Line Buffer improved the overall performance of a data cache due to 2 factors: it reduced port pressure on the data cache and allowed a fair fraction of data cache accesses to be completed in a single processor cycle. While Wilson et al. augmented the data cache with a Line Buffer, we propose the Line Buffer as a replacement to the dedicated I-cache. The Line Buffer in our case is the initial access point for all instruction stream references. A miss in the Line Buffer, fills out of the Shared cache and allocates based on a simple LRU scheme. 6.1
Capacity vs. Bandwidth
We see in Section 4.4 that the miss rate of the ODB code stream decreases steadily as the line size of the cache is increased (at the lower capacities). An alternative to increasing the line size in cache is to pre- fetch next sequential cache blocks and hold them before demand use in a Streaming buffer[16]. It has been shown that using Streaming Buffers instead of larger line size improves the miss rate by avoiding pollution of the cache, [23] because of the fact that some fraction of these pre- fetched blocks are not used. Next line pre- fetching or streaming, however, comes at a price – it costs more in terms of data bandwidth to transfer the additional bytes from the shared cache to the processor. As shown in
Page 14 of 22
Submitted to PACT ‘03
number of inst hit/byte
0.14 0.12 0.1 0.08 0.06 0.04 0.02 0 64 bytes
128 bytes
256 bytes
512 bytes
1024 bytes
2048 bytes
4096 bytes
line size
Figure 8 Instruction Yield per extra byte pre-fetched
Figure 8, the number of instructions executed per extra byte fetched, decreases as a square function of line size, illustrating the decreasing benefit of line size increases. Nevertheless, across the spectrum of line sizes studied, the number of valid instructions found keep increasing as the line size is increased. Figure 9 provides a relative comparison of the miss rates of a few different Line Buffer configurations. We see that an 8 entry Line Buffer that fetches 256 bytes at a time (2KB) and a 2 entry Line Buffer that fetches 512 bytes at a time (1KB), both have miss rates very similar to the baseline Icache. However, the 1KB Line Buffer uses twice as much data bandwidth as the 2KB, which in turn, uses four times as much bandwidth as the baseline cache of 64KB.
We therefore note that for the ODB workload, bandwidth may be traded off against cache capacity for a specific miss rate. Compared to system- level SMPs, bandwidth on a chip can be obtained more easily by increasing the toggle rate on wires. While SMPs (at the component level) can employ multi- megabyte caches, a chip is more constrained by on-chip cache sizes. Therefore, it seems prudent to invest the allocated cache transistors to increase the size of the shared cache by minimizing the number of transistors to serve in the first- level I-cache. In the process though, we are obliged to create a high-bandwidth interconnect between the shared cache and the Line Buffer, at each PE.
Page 15 of 22
Submitted to PACT ‘03
140.0%
1KB (256 bytes, 4 entries)
120.0%
1KB (512 bytes, 2 entries)
100.0% 80.0%
2KB (512 bytes, 4 entries)
60.0%
2KB (256 bytes, 8 entries)
40.0%
4KB (256 bytes, 16 entries)
20.0%
4KB (512 bytes, 8 entries)
0.0%
baseline (64KB, 2 ways) Miss Rate (normalized to baseline)
Figure 9 Miss Rates of various Line Buffer configurations normalized to Baseline
Thus, we show that while the Line Buffer consumes a mere 2% of the area of the baseline Icache, it achieves the same miss rate as the baseline. The area saved, by replacing the L1 I-cache with a simple 4-8 entry Line Buffer, can be better utilized by designing a larger Shared Cache. By keeping the Line Buffer miss rates the same as the baseline I-cache, we maintain almost the same request bandwidth as a single dedicated I-cache. 7
Proposed Cache Organization
In section 4 we show that the capacity requirements of ODB code far outstrips the typical 64 KB (or less) first- level cache used in several modern microprocessors. In Section 0, we show that a cache shared between 2- to 4 processors in a chip- multi-processor effectively increases the capacity as seen by each CPU for the same total cache budget. In Section 6, we showed that by using a Line Buffer to intercept fetch accesses to the Shared cache, we can keep the request bandwidth into the Shared Cache to a level no worse than a dedicated I-cache, while spending the minimum transistors out of the total cache budget. By using a small Line Buffer, we do not impact the processor’s cycle time. We propose a shared I-cache for a 4-processor CMP as shown in Figure 10. Each processor first accesses the Line Buffer (LB) to retrieve instruction bytes. If the Line Buffer misses, the access is sent to the Shared Cache. Accesses from the four processors arbitrate for the Shared Cache. Page 16 of 22
Submitted to PACT ‘03
The Shared Cache returns a cache block of 256 bytes to the requesting processor over a bus that is shared by a cluster of 4 processors. In the event of a miss in the shared cache, the request is sent to the large L2 cache. The rest of the memory hierarchy remains similar to a traditional CMP design.
………
CPU0
Proc Line Buffer
0
CPU3
Proc 0
Shared L1I
Line Buffer
L1D
L1D
………
L2 Bank0
L2 Bank3
Figure 10 Proposed Cache Organization
In the following section we present results on the Line Buffer-Shared Cache combination. In Section 7.1. we see how the Line Buffer impacts the behavior of the Shared Cache. In Section 7.2 we will see the effect on the net miss rate. 7.1
Effect of Line Buffer on Shared Cache
Table 3 presents the metrics (capacity increase, pre-fetching and destructive misses) that we defined in Section 5.1, for a 256KB shared cache. We see that the presence of the Line Buffer decreases the number of destructive misses in each MP case, over that shown in Table 1.
% blocks shared
Blocks pre-fetched
Destructive Misses
(per 1K instructions)
(per 1K instructions)
2P
4P
2P
4P
2P
4P
73.18%
82.53%
21.59
49.51
2.88
3.10
Table 3 Effect of Line Buffer on a 256KB Shared Cache
Page 17 of 22
Submitted to PACT ‘03
We note a significant improvement in the fraction of the cache that is shared, implying that each processor sees a greater fraction of the net capacity. There is an equally dramatic increase in the fraction of blocks that are pre-fetched by one processor and used by another. As less of the blocks, fetched in a given time, are replaced by conflicting accesses from other processors, they live in the cache long enough, to allow other processors, executing a similar path, to use them. As explained in section 5.1, misses to such blocks are amortized over all the other processors which subsequently use these blocks. The net result is that the absolute number of misses that occur in the cache system, starts to approach the total number of misses incurred when only one processor is using the cache; thus as a fraction of the total number of accesses that occur due to the multiple processors, the relative miss rate goes down.
7.2
Miss Rate of Proposed Cache
Miss Rate per 1000 instructions
35.00 30.00
2P
25.00
4P
20.00
baseline w/256K
15.00 baseline w/256 byte line size
10.00
baseline 5.00 0.00
Figure 11 Miss Rate Comparison
In section 0, we saw that the miss rate of the Shared Cache was similar to that of a Dedicated Cache of the same capacity. Figure 9 compares the improvement in the effective miss rates for each of the 2P and 4P configurations when used with a Line Buffer and Shared Cache (as shown in Figure 10). With a Line Buffer interfacing to the Shared Cache, we achieve a 30% improvement in miss rate over a Dedicated Cache of the same size (baseline w/256KB). The miss rate improvement over the baseline (of 64KB, 64 byte lines) is over 8-fold while compared to a baseline (64KB) with a line size of 256 bytes, we see an improvement of 5X.
Page 18 of 22
Submitted to PACT ‘03
Thus, not only have we improved the miss rate significantly over the baseline, we have beaten the shared cache described in section 0. 8
Related Work
In the domain of chip multi-processing, the first several papers were from Stanford. These papers have advocated CMP in the context of SPEC [19]. IBM’s Power 4 [1] integrates two processor cores on the same die. Each processor core is an out-of-order RISC engine executing PowerPC instructions. Each processor core has a dedicated I-cache with 128KB and a D-cache with 64KB. These connect over a bus to a large (1.5MB) L2. Of late, there have been a large number of studies on database applications due to the increasing importance of these workloads [5][8][10][11]. Ranganathan et al [5] study user-level traces of database workloads in the context of wide- issue out -of-order processors. They show that performance gains due to out-of-order implementations is limited for OLTP – this, they show is due to the large component of instruction and data related stalls. A number of studies address issues related to the effectiveness of different memory system architectures for OLTP workloads. Barroso et al [10] sho w the need for large direct- mapped off-chip caches (8MB). Lo et al [21] show that a large off-chip cache (16MB) is not adversely affected by cache interference caused by fine- grain multithreading. Subsequently there have a number of papers that showed that smaller, though more associative on-chip caches outperformed direct mapped, larger off-chip cache [22]. Finally, Barroso et al [22] showed that greater integration of the memory system, coherence and network modules on a single chip could provide large gains for OLTP workloads. [2] first proposed the idea of using a CMP for the express purpose of multiplying OLTP performance on a single chip. To the best of our knowledge, there has been no other reported work to improve over the gains reported in [2]. Simultaneous multithreading (SMT) is an alternative to CMP for exploiting the thread- level parallelism in commercial workloads. In fact, Lo et al [21] have shown that SMT can provide a substantial gain for OLTP workloads. An SMT processor adds extra functionality and resources (e.g. larger register file) to an out-of-order core to support multiple simultaneous threads. As such, SMT increases the implementation and verification complexity that comes with such designs. Furthermore, intelligent software resource management is sometimes necessary in SMT
Page 19 of 22
Submitted to PACT ‘03
to avoid negative performance effects due to the simultaneous sharing of critical resources such as the physical register file and TLBs. Uhlig et al [23] proposed the IBS benchmark suite to stress the instruction cache performance. The rationale provided was the ‘bloat’ factor associated with modern software systems due to increased demands on software functionality, portability and maintainability. While confining themselves to single-threaded runs, they observed that an on-chip second- level cache would greatly augment a ‘budget’ first-level cache; more so than a bigger off-chip L2. Finally, Ramirez et al offer code layout optimizations to improve instruction cache performance on OLTP. They report about 50% improvement through basic block chaining, fine-grain procedure splitting and procedure ordering. The greatest gains reported were through basic -block chaining. We find that these techniques to improve miss rates for a single processor system interact favorably in the context of a Shared Cache proposal presented in this paper. For instance, procedure ordering and basic -block chaining both improve spatial locality. Furthermore, procedure-ordering helps to cluster procedures in the cache, to avoid conflict misses. In the context of the Shared Cache, avoiding conflicts on frequently accessed blocks becomes even more important, than in uni-processor systems.
9
Discussion and Concluding Remarks
As application path- lengths increase due to software complexity and increased functionality, the I-cache is likely to play a greater role in determining processor performance, than it has in the past. At the same time, software modularity and increased interactions with the OS, expose large dynamic sections of the code that are in fact common to multiple application contexts or threads. Commercial workloads, such as OLTP, are classically notorious for long path- lengths and frequent interactions with the OS. On the architectural front, there are a couple of discernable trends. First, multi- threading is likely to supplant fine-grained parallelism as the primary technique to improve processor performance. Second, the abundance of transistors on a single silicon die is already making small to medium scale multiprocessors feasible. Therefore, applications such as commercial workloads, which in the past were the primary market for SMPs, will benefit significantly from the integration of multiple processor cores on a single die. Indeed, studies have demonstrated significant speedups in OLTP performance over traditional ILP processors. The unique characteristics of chip multiprocessing viz. unprecedented levels of bandwidth and low latencies between processors and the on-chip cache, have allowed applications to scale quite well.
Page 20 of 22
Submitted to PACT ‘03
In spite of this synergy between OLTP and chip multiprocessors, there remain several bottlenecks. This paper deals with one such bottleneck: the instruction code footprint. Examining the Oracle database benchmark, the paper observes that it would take 4-8X the size of a typical Icache to capture 95% of the footprint. There are obvious impediments to providing this level of I-cache: processors, despite having a larger and larger transistor budget, can never approach the cache capacity of off-chip caches. Furthermore, a CMP with several processors cores can quickly deplete the transistor budget, if they are each given a large cache to feed their processing needs.
This paper makes the case to divide future CMPs into small clusters (of 4). Each cluster of 4 processors, to have a common instruction cache. The paper shows that the constructive and destructive interactions of the 4 ODB threads running concurrently on this shared cache, mostly balance out. So, that in the net, each processor virtually sees the benefit of the full larger cache. In addition, by pre- fetching aggressively and adding a very small structure - the Line Buffer - to buffer the last few contiguous cache blocks, the paper shows a multiplying effect on the hit rate of the overall cache. The paper establishes that the Line Buffer drastically reduces destructive interference at the shared cache and provides an almost 5X improvement in overall miss rate, for the same total cache capacity. 10 Acknowledgments We would like to thank Brian Hirano for many insightful comments during the course of this work.
11 REFERENCES [1] J. Kahle. Power4: A Dual-CPU Processor Chip. Microprocessor Forum '99, October 1999. [2] L.A. Barroso, K. Gharachorloo, R. McNamara, A. Nowatzyk, S. Qadeer, B. Sano, S. Smith, R. Stets, and B. Verghese. Piranha: A Scalable Architecture Based on Single-Chip Multiprocessing. In Proceedings of the 27th International Symposium on Computer Architecture, pages 282-293, June 2000.
[3] K. Olukotun, B.A. Nayfeh, L. Hammond, K. Wilson and K. Chang. The Case for a Single-Chip Multiprocessor. In Proceedings of the 7th International Symposium on Architectural Support for Parallel Languages and Operating Systems, pages 2-11, Oct 1996.
[4] J. Hennessy. The Future of Systems Research. In IEEE Computer, Vol. 32, No. 8, pages 27-33, August 1999. [5] Z. Cvetanovic and D. Bhandarkar. Characterization of Alpha-Axp Performance using TP and SPEC Workloads. In Proceedings of the 21st International Symposium on Computer Architecture, pages 60–70, April 1994.
[6] M. Franklin, W.P. Alexander, R. Jauhari, A.M.G. Maynard, B.R. Olszewski. Commercial Workload Performance in the IBM Power2 Risc System/6000 Processor. IBM J. of Research and Development, 38(5): 555–561, 1994.
[7] A. Ailamaki, D. DeWitt, M. Hill, and D. Wood. DBMSs on a Modern Processor: Where Does Time Go? In Proceedings of the 25th International Conference on Very Large Data Bases, pages 266–277, September 1999.
Page 21 of 22
Submitted to PACT ‘03
[8] A. Maynard, C. Donnelly, and B.R. Olszewski. Contrasting Characteristics and Cache Performance of Technical and Multiuser Commercial Workloads. In Proceedings of the 6th International Conference on Architectural Support for Programming Languages and Operating Systems, pages 145–156, October 1994.
[9] K. Keeton, D.A. Patterson, Y.Q. He, R.C. Raphael, and W.E. Baker. Performance Characterization of a Quad Pentium Pro SMP Using OLTP Workloads. In Proceedings of the 25th International Symposium on Computer Architecture, pages 15–26, June 1998.
[10] L.A Barroso, K. Gharachorloo, and E. Bugnion. Memory System Characterization of Commercial Workloads. In Proceedings of the 25th International Symposium on Computer Architecture, pages 3–14, June 1998.
[11] P. Ranganathan and K. Gharachorloo and S.V. Adve and L.A. Barroso. Performance of Database Workloads on SharedMemory Systems with Out -of-Order Processors. In Proceedings of the 8th International Conference on Architectural Support for Programming Languages and Operating Systems, pages 307–318, October 1998.
[12] M. Rosenblum, E. Bugnion, S. Herrod, E. Witchel, and A. Gupta. The Impact of Architectural Trends on Operating System Performance. In Proceedings of the 15th Symposium on Operating Systems Principles, pages 285–298, December 1995.
[13] P.S. Magnusson, F. Dahlgren, H. Grahn, M. Karlsson, F. Larsson, F. Lundholm, A. Moestedt, J. Nilsson, P. Stenström, and B. Werner. SimICS/sun4m: A Virtual Workstation. In Proceedings of the Usenix Annual Technical Conference, June 1998.
[14] A.R. Alameldeen, C.J. Mauer, M. Xu, P.J. Harper, M.M.K. Martin, D.J. Sorin, M.D. Hill and D.A. Wood. Evaluating Nondeterministic Multi-threaded Commercial Workloads. In Proceedings of the 5th Workshop on Computer Architecture Evaluation using Commercial Workloads, February 2002.
[15] M. Annavaram, T. Diep and J.P. Shen. Branch Behavior of a Commercial OLTP Workload on Intel IA32 Processors. In Proceedings of the International Conference on Computer Design, pages 242-248, January 2001.
[16] N.P. Jouppi. Improving Direct-Mapped Cache Performance by the Addition of a Small Fully-Associative Cache and Prefetch Buffers. In Proceedings of the 17th International Symposium on Computer Architecture, pages 364-373, May 1990.
[17] K.M. Wilson and K. Olukotun. Designing High-Bandwidth On-Chip Caches. In Proceedings of the 24th International Symposium on Computer Architecture, pages 121-132, June 1997.
[18] L. Hammond, B. Hubbert, M. Siu, M. Prabhu, M. Willey, M. Chen, M. Kozyrczak, and K. Olukotun. The Stanford Hydra CMP. Presented at Hot Chips 11, August 1999.
[19] Standard Performance Council. The SPEC95 CPU Benchmark Suite. http://www.spec.org/cpu2000 [20] Alaa R. Alameldeen and David A. Wood, "Variability in Architectural Simulations of Multi-threaded Workloads," 9th Annual International Symposium on High Performance Computer Architecture (HPCA-9), Anaheim, CA, February 2003
[21] J. Lo, L. A. Barroso, S. Eggers, K. Gharachorloo, H. Levy, and S. Parekh. An Analysis of Database Workload Performance on Simulta-neous Multithreaded Processors. In 25th Annual International Symposium on Computer Architecture, June 1998.
[22] L.A. Barroso, K. Gharachorloo, A. Nowatzyk, and B. Verghese. Impact of Chip-Level Integration on Performance of OLTP Workloads. In 6th International Symposium on High-Performance Computer Architecture, pages 3-14, January 2000
[23] Richard Uhlig , David Nagle , Trevor Mudge , Stuart Sechrest , Joel Emer, Instruction fetching: coping with code bloat, Proceedings of the 22nd annual international symposium on Computer architecture, p.345-356, June 22-24, 1995, S. Margherita Ligure, Italy
[24] A. Ramirez, L. A. Barroso, K. A. Gharachorloo, R. Cohn, J. Larriba-Pey, P. G. Lowney, M. Valero. Code Layout Optimizations for Transaction Processing Workloads. Proceedings of the 28 th Intl. Symposium on Computer Architecture, pp. 155-164, June 2001
Page 22 of 22
Submitted to PACT ‘03