for big and medium power generating plants or combined ... Keywords: Power plant, computer integration, ... the Polish electric and thermal power industry in the.
Jozef B. Lewoc, Antoni Izworski, Sławomir Skowronski, Antonina Kieleczawa, Tadeusz Czachórski, Georgi M. Dimirovski, Vesna Ojleska / International Journal of Engineering Research and Applications (IJERA) ISSN: 2248-9622 www.ijera.com Vol. 2, Issue 4, July-August 2012, pp.566-573
A Case Study: Performance Evaluation For A Computer Integrated Power Plant Network Jozef B. Lewoc1, Antoni Izworski2, Sławomir Skowronski3, Antonina Kieleczawa4, Tadeusz Czachórski5, Georgi M. Dimirovski6, Vesna Ojleska7 1
Research, Design and Translation Agency Leader (Leading Designer), Wroclaw, Poland 2 Electronic Faculty, Wrocław University of Technology, Wrocław, Poland 3 Informatics and Management Faculty, Wrocław University of Technology Wrocław, Poland 4 Institute for Power System Automation, Wroclaw, Poland, 5 IITS PAN, Gliwice, Poland, 6 Computer Engineering, Dogus University, Istanbul, Turkey 7 Cyril and Methodius University of Skopje, Skopje, Macedonia
Abstract The paper presents a solution designed for big and medium power generating plants or combined heat and power generating plants in Poland many years ago. The basic components of the solution, the operator’s control systems, have been implemented successfully in numerous power (and heat-and-power) facilities in the country and presently, it seems that the time has come to implement the full, computer integrated manufacturing and management solution enabling adequate operation of the power plant manufacturing (generation) and management. This needs development of local area networks and/or metropolitan networks of the wireless type, in dependence on the power plant size. The paper is devoted to performance evaluation/prediction for such case-study network. Keywords: Power plant, computer integration, computer network, wireless network, performance evaluation, performance prediction.
1
Introduction
The Institute for Power System Automation (IASE), Wroclaw, Poland, have been a definite leader in design, development and implementation of Polish pioneering monitoring and control systems for the power industry from early fifties [1]. Since the seventies, they have educated a numerous experienced staff for design of the system functionality, selection of the hardware and software structures, design and development of specialized hardware and software modules (including singleboard microcomputers), design, development and implementation of complete systems, training, etc. Due to the reasons described in [1], the power industry suffered severe financial problems and most of the experienced staff left the Institute during the very low economy period in Poland in early nineties.
However, the rest of them, who stayed with the industry, could undertake the challenge released by the Polish electric and thermal power industry in the late nineties, and design and develop the most severely needed systems. It should be emphasized that after the political transformation of 1989 and after the earlier Polish down economy period, the demand for electric power decreased considerably in Poland instead of pre-planned continuous increase. Therefore, the biggest organization in Poland developing computer systems for the power industry, had to look for a market for themselves in the thermal and electric power industry. The paper will describe the basic future product for the application range, the Badel (from Polish Baza danych dla elektrowni = Data base for power plants), based on the earlier design product, the KSWDB (from Polish Komputerowy System Wspomagania Dyspozytora Bloku = Power Generating Unit Control Engineer Computer Aiding System). For the proposed case-study solution of Badel, being a wireless LAN or Metropolitan network, in dependence on the power facility under automation, an approach to performance evaluation/prediction worked out during development and investigations of the first Polish successful, heterogeneous network MSK (from Polish Miedzyuczelniana Siec Komputerowa = Interuniversity Computer Network). The hardware architecture planned for Badel is shown in Fig. 1, described hereinafter.
2
The Badel Network
2.1 General A basic problem needing solution in combined heat and power generating stations (HPGS) is connected with monitoring and control of the Heat and Power Generating Units (HPGU) operation. Due to the huge number of analogue and digital variables (both primary and secondary
566 | P a g e
Jozef B. Lewoc, Antoni Izworski, Sławomir Skowronski, Antonina Kieleczawa, Tadeusz Czachórski, Georgi M. Dimirovski, Vesna Ojleska / International Journal of Engineering Research and Applications (IJERA) ISSN: 2248-9622 www.ijera.com Vol. 2, Issue 4, July-August 2012, pp.566-573 (calculated variables)), this requires application of advanced computer systems/networks. The first solution (Badel) intended specifically for monitoring of HPGU’s and for management of the complete (heat and) power generating plants was designed and tested on the turn of the eight decade of the last century. The schematic diagram of the system which was improved in compliance with the technology change process in Poland is shown in Fig, 1. 2.2 The Process Level Any of the n Process Levels (PLs) is constituted of the Intel-based microprocessors (designed and developed, and called the cells), the analogue and two-state Input/Output modules (CP 1n), the communication module (SC1,1-n.1(n) , being a redundant version of CSMA-CD (Ethernet) LAN) and the power supply circuits required (grouped in so called automation hubs DAC1,1-n,K(n)+). The LAN Net interconnects the process stations with PLs, and the Plant Operator’s Level (OL). The PL functionality, realized under control of the software platform (home-made operating system) and of the applications software written under the specialized, object-oriented programming language REGIN-H, and with use of another home-made program, the graphic editor, covers the following basic tasks: the user algorithm executed in a cell,
transmissions between the cells, exchange of data with OL, buffering of event messages at the level of the cell and hub. 2.3 The Plant Operator’s Level The hardware basis of the Plant Operator’s Level (POL) consists of the Power Plant Database (PPDb), Power Plant Control Processor (PPCP) and the Power Plant Console inter-working with the Processing/Graphic Station (PGS) PC’s (preferably in the industrial version), co-operating with colour visual displays (including so called graphic walls [3]), printers, standard and/or specialized keyboards and manipulators. The PC’s are synchronized with the satellite Global Positioning System (GPS) and interconnected one to another and with so homemade gateways. The complete structure operates on the QNX platform, under control with the home-made middleware and software. The middleware controls the basic system functionality covering communications, processing, archiving, presentation and man-machine dialogue. The application software covers a set of customization parameters (process variable catalogues, definitions of screens, reports, calculating algorithms for secondary variables, etc.), prepared in the Configuring / Diagnostic Stations (CDS) and controlling the
567 | P a g e
Jozef B. Lewoc, Antoni Izworski, Sławomir Skowronski, Antonina Kieleczawa, Tadeusz Czachórski, Georgi M. Dimirovski, Vesna Ojleska / International Journal of Engineering Research and Applications (IJERA) ISSN: 2248-9622 www.ijera.com Vol. 2, Issue 4, July-August 2012, pp.566-573
LOCAL PROCESSING POINT i{1,…,S}
ARCNET LAN
POWER PLANT DATABASE
2
1
CP1
SC1,1
…
POWER PLANT CONTROL PROCESSOR
POWER PLANT CONSOLE
1 PGU 1 CONSOLE
PP1
DAC1,1
SC1,K(1)
…
DAC1,K(1)
… PGU1
…
2
CP n, PP n , CONSOLE n
… SCn,1(n)
… DAC1,1(n)
SCn,K(n)
PGUn
DACn,K(n)
…
Fig. 1. Hardware architecture of Badel
568 | P a g e
Jozef B. Lewoc, Antoni Izworski, Sławomir Skowronski, Antonina Kieleczawa, Tadeusz Czachórski, Georgi M. Dimirovski, Vesna Ojleska / International Journal of Engineering Research and Applications (IJERA) ISSN: 2248-9622 www.ijera.com Vol. 2, Issue 4, July-August 2012, pp.566-573 computational and presentation tasks on the POL. The OL functionality covers, among other things: Communication with PL (standards available: Ethernet, RS-232, RS-485), Automatic archiving of all variables defined in the system, Event archival (normally, ca. one million events), Secondary variable processing (performed with use of more than 30 standard computational functional modules), Visualisation, automatic and direct control, realised with specialised screens (Scheme, Events, Alarms, Catalogue, Plot) and windows: Automatic Control, Direct Control, dialogue and information boxes, Data-logging and reporting (many report templates and home-made report writer, uninterrupted logging on magneto-optic compact disks, colour screen hard copies, etc.), Operator-machine dialogue (via standard and/or specialised keyboards, visual displays (including the Graphic Walls) and manipulators). A typical plant scheme is shown in Fig. 2.
Fig. 2. Scheme screen 2.4 Engineering subsystems The Engineering Subsystems (ES) enable to develop Badel software on the basis of customization, thus facilitating the task and avoiding many possible programming errors. The customizing functionality is realized by the following editors of ES: - Catalogue editor (used to create the sets (called catalogues) of the field variables, secondary variables, operator’s variables, automatic control systems and direct control systems), - Secondary (functional) processing editor (more than 30 standard algebraic and logical functions, expandable of special functions developed on the Customer’s demand), - Screen editor (to create screens with plant synoptic schemes, bar-graphs, plots, colours under control, tables, digital values, logic data, etc.), - Report writer to create report templates for the field and secondary variable data,
- Field signal and automatic and digital control structure processing editor (to create the algorithms with a graphic environment. 2.5 Supervision and Management Level It is planned that the Power Plant Database and Control Level (SML) will enable to develop the Computer Integrated Manufacturing and Management (CIMM) systems considered (by the engineering and managerial staff of heat and power generating plants and other works) as the necessary component for optimum operation of the total plant. For this purpose, the processes in the gateways may transfer data to the WWW servers (basically) and to the other SML level subsystems. In addition, it is being investigated if it is feasible to employ at SML some specialized expert systems intended for improvement of the working media production profitability.
3
Exemplary Problem Solution
An exemplary solution of the monitoring and supervision problem will be described hereinafter for the case of a combined thermal and electric power generating plant, supplying a several hundred thousand inhabitant town in Poland. The plant under control consists of two Heat and Power Generating Units (HPGU’s) (100 MW each) and two old water boilers which are in operation in order to enable fast changeovers of the working HPGU’s. In total, the plant under monitoring and supervision is described by several thousand two-state and analogue variables (primary or secondary ones). The process stations (automation hubs) intercommunicate with the OL computers via the LANs at the levels under discussion (and relevant gateways). At the Operator’s Level, there are two computers per a HPGU (one for the boiler operator and the other for the turbine operator). In additions, there have been provided two computers for the water boilers and one for the overall plant Control Engineer. The graphic wall shared by the authorized operators/engineers enables large-scale graphical display of the data acquired and control of process actuating members. It is very useful for displaying of important plant schemes, especially in emergency conditions when the operators and control engineers should have at their disposal some scheme and other display forms of high readability, reliability and robustness. The problems of system robustness are of a particular interest for the system designers [2], [3]. It is comprehensible: in the 21-st Century, system reliability is the basic feature of any solution of major importance and the task of the designers is to maximize the resistance to disturbance, i.e. the robustness.
569 | P a g e
Jozef B. Lewoc, Antoni Izworski, Sławomir Skowronski, Antonina Kieleczawa, Tadeusz Czachórski, Georgi M. Dimirovski, Vesna Ojleska / International Journal of Engineering Research and Applications (IJERA) ISSN: 2248-9622 www.ijera.com Vol. 2, Issue 4, July-August 2012, pp.566-573 The OL computers intercommunicate with the Supervisory and Management Network (SMN) ones. However, it should be noticed here, that the staff operating at this level are not allowed to perform direct control on the plant (for such actions, only the Control Engineers and Operators are authorized); the customers at this level may only select the data they need for their work. The solution was implemented successfully in several Polish heat and power generating units. Usually, the benefits generated by similar monitoring and supervisory systems in the heat and power industry are assessed as some dozen or so percent of the thermal and electric energy sold by the plant. At this assumption, the system paid back many times during the first half year after being commissioned.
4
Performance Evaluation/Prediction
4.1 General Considering the fact that the networks of the Badel architecture and functionality are hardly implemented in actual power and/or combined heat-andpower plants, the design and implementation team operating on the rule of a volunteering one (in Poland, such teams are called, more reasonably: the teams working for the society), decided to verify if the network performance will be adequate for the application. Considering the fact, that the well-known methods of the mean-value analysis [4] fail in the case of Badel, since they are based on non-realistic assumptions on the traffic distribution, the stochastic network methods [5] are not applicable for actual engineering problems and the Petri Nets [6] are formal tools only and can not introduce anything really new to performance evaluation, the team decided to employ an analytical performance evaluation tool, the Closed-Route based approximate Analytical Method (CRAM) developed for the first Polish successful public-character computer network [7]. The method was verified and applied successfully in several applications later [8] – [11]. 4.2 Network Model In the present paper intended for the circles of communication network designers and operators, the case of actual wide-area networks is considered. An analogous way may be used for local-area networks, for metropolitan networks or for star networks (e.g. centralized computer control systems). However, to maintain the clarity of description, the latter cases will not be analyzed in the present paper. By an actual wide-area network (WAN) (ref. Fig. 3) with packet switching and end-to-end acknowledgement, the following quadruple is meant (1): (1) WAN = {DTE, DCE, IN, SUB} Where: DTE is the set of network subscribers, d1,…,du;
DCE is the set of communication network switches (nodes, routes, gateways, etc.), w1,…,wc; IN is the set of communication network input links; SUB is the set of links (hops) within the communication network. Note: CRAM is based on the assumption (fulfilled by any reasonably designed communication networks) that no computer network component is allowed to transmit an arbitrary number of entities (packets) into any link but it has to obey some flow control rule and defer from transmitting more entities (packets) than the credit allowed, informed of by the last acknowledgement received. This assumption is true for all communication and computer networks known to the authors. On IN and SUB, there is stretched a set of closed routes (2). n (2) LOOP i , i , ..., i .
1, s
2, s
ks ,s
s 1
An illustrative diagram of the network is shown in Fig. 1 and the 1-st route is depicted in Fig. 2. When the expectances of the random variables presented in Figs. 3 and 4 are denoted by corresponding lower case letters, the obvious balance equations for each s=1,…,n may be described by the formula (3): (3) (t m ( y e ));
sS
s
s
iI s
i ,s
i ,s
where S is the set of all closed routes, S v; and Is is the set of links through which the s-the route passes. In (3), the known values are ms and es. It is needed to find yi,s and ts values. To summarise, an actual network is described as a superposition of the closed routes (calls, connections, virtual calls, etc.) passing via the set of links available in IN and SUB. In accordance with real practice, the links passed by individual closed routes are predefined (at least, in normal operating conditions), where S is the set of all closed routes and Is is the set of links through which the s-the route passes. In (3), the known values are ms and es. It is needed to find yi,s and ts values. To summarise, an actual network is described as a superposition of the closed routes (calls, connections, virtual calls, etc.) passing via the set of links available in IN and SUB. In accordance with real practice, the links passed by individual closed routes are predefined (at least, in normal operating conditions). The approximate analytical method of a heuristic character was to be validated rather extensively. At the very beginning, the method was tuned on the basis of available results for cyclic closed networks. The latter networks are rather accurate approximations for star-topology networks. Therefore, a considerable effort was done to compare the results given by CRAM and those found in available bibliography (this is not cited here, since the sources are as old as thirty or more years).
570 | P a g e
Jozef B. Lewoc, Antoni Izworski, Sławomir Skowronski, Antonina Kieleczawa, Tadeusz Czachórski, Georgi M. Dimirovski, Vesna Ojleska / International Journal of Engineering Research and Applications (IJERA) ISSN: 2248-9622 www.ijera.com Vol. 2, Issue 4, July-August 2012, pp.566-573
DTE s=1 Ai={1,2} Bi={3,4} Ci={} {si}={1,2,3,4} i=2
i=4
Y2,1 i=1
E2,1 Y4,1 i=3
Ai={} Bi={1,2,3,4} Ci={1,2} {si}={1,2,5,6}
DCE or SUB
E4,1
E1,1 Y1,1 E3,1 Y3,1
i=2(k1-1)
i=2(k1-1)
Y2k1-2,1 E2k1-2,1 i=2k1-3
Y2k1 E2k1,1 i=2k1-3
E2k1-3,1
E2k1-1, Y2k1-1,1
Y2k1-3,1
Fig. 3. Illustrative diagram of WAN A2, B2, C2
A4, B4, C4
Y2,s E2,s
Y4,s
A2(k-1), B2(k-1), C2(k-1)
A2k, B2k, C2k
Y2(k-1),s E2(k-1),s
Y2k,s E2k,s
E4,s
S(s)=0
1 Ts Ds
Rs
E1,s Y1,s
E3,s Y3,s
E2k-3,s Y2k-3,s
E2k-1,s Y2k-1,s
A1= A2 B1= B2 C1= C2
A3= A4 B3= B4 C3= C4
A2k-3= A2(k-1) B2k-3= B2(k-1) C2k-3= C2(k-1)
A2k-1= A2k B2k-1= B2k C2k-1= C2k
Fig. 4. Exemplary route for s=1
Finally, after many dozen comparison runs and several adjustments to CRAM, the relative error did not exceed 2%. At that stage, it was considered that the CRAM approximations are good enough to be employed for wide-area networks and local-area networks. This needed some generalization of the approximating formulae and led to formulae (3) and (16) for WANs. Secondly, the simulation model of WANs was used for validation of CRAM. Most of the simulation runs were performed for the current (at that time) and planned future configurations of the MSK network but, where some detailed data on
performance of foreign networks, was available, specific comparisons were carried out. Even presently, network simulators are developed individually; therefore, a well proven simulator developed earlier for investigation of real-time computer control systems and intended for running on computers of rather low computing power (therefore, a highly efficient simulator) was adopted to network performance evaluation tasks. More than five hundred comparison runs were carried out. The results exceeded the expectation: validation with simulation showed no relative error exceeding 3.5%. In addition, the approximations
571 | P a g e
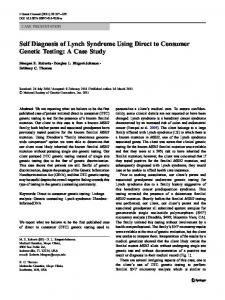
Jozef B. Lewoc, Antoni Izworski, Sławomir Skowronski, Antonina Kieleczawa, Tadeusz Czachórski, Georgi M. Dimirovski, Vesna Ojleska / International Journal of Engineering Research and Applications (IJERA) ISSN: 2248-9622 www.ijera.com Vol. 2, Issue 4, July-August 2012, pp.566-573 tended to the accurate ones for the numbers of lines and closed routes tending to 0 or tending to infinity, and the relative error took some maximum values at some intermediate numbers. This may be an evidence for that the CRAM method may be tuned further on, but it was not done. Simulation models for performance evaluation of specific WANs usually use some simplifications. For instance, in validation of CRAN, the problem of the link pass-band needed for flow control packets and frames was neglected. To validate the simulation model itself, especially the possible impact of omitting the flow control entities in simulation, an internal measuring tool Sitwa [8] was developed. The test runs of Sitwa (more than a hundred of test runs) proved that the simulation results did not differ from the measurements of more than 2 %. The results are more than good for actual network designers and operators. Therefore, validation and tuning of the method were finished at that stage and the method was successfully applied for investigation (performance evaluation) of many configurations of various actual networks. 4.3 Exemplary Results The set of equations (3) was solved iteratively. The basic user characteristics, rs (the round-trip delay) and ds (the throughput available in the s-th closed route) for the exemplary closed routes, one (s1 of a heavy load, passing via two links of an intensive packet traffic), the other (s2) of a medium load, passing via one link of intensive packet traffic), are depicted in Figs. 5 ÷ 8. The closed route s1 passes via the most severely loaded links in the Badel network. This results in that the round trip delay reaches more than 4 s at the mean thinking time close to 0 (ref. Fig. 5). If it is assumed that an annoying value (i.e. the value that can not be accepted by the Enterprise employees) of rs is that higher than 2 s, then the ms values below some 0.5 s should be avoided.
The reason is that the s2-th closed route does not pass via any link under heavy traffic. Therefore, even when the mean thinking time is decreased towards zero, no saturation (congestion) occurs in the links passed by the s2-th closed route. d s1 [103b/s]
m s1 [s]
Fig. 6. ds1 versus ms1
r s2 [s]
m s2 [s] Fig. 7. rs2 versus ms2
r s1 [s]
m s1 [s] Fig. 5. rs1 versus ms1
572 | P a g e
Jozef B. Lewoc, Antoni Izworski, Sławomir Skowronski, Antonina Kieleczawa, Tadeusz Czachórski, Georgi M. Dimirovski, Vesna Ojleska / International Journal of Engineering Research and Applications (IJERA) ISSN: 2248-9622 www.ijera.com Vol. 2, Issue 4, July-August 2012, pp.566-573 d s2
[10]
packets s
d279[s]
[11]
J.B. Lewoc, A. Izworski, S. Skowronski . Performance Modelling of a Computer Integrated Manufacturing and Management System. Eurosim Congress, Ljubljana, 2007. J. B. Lewoc, A. Izworski, S. Skowronski, G. M. Dimirovski and V. Ojleska, An Approximate Actual Network Performance Evaluation Method. ISMS2010 (Eurosim, IEEE CS), Liverpool, 2010.
Presenting Author’s biography
m s2 [s]
Fig. 8. ds2 versus ms2
5
References [1]
[2]
[3]
[4]
[5] [6]
[7]
[8]
[9]
J.B. Lewoc, M. Rozent and I. Saczuk, “The computing power and the computer systems for the power industry in Poland”, MICC (IFAC), Prague, 1992. A. Izworski and J.B. Lewoc, “Robustness Comparison of Enterprise Energy Distributions Systems of Various Topologies”, Robust Control Systems (IFAC), Milan, 2003. A. Izworski, J.B. Lewoc and S. Skowronski, “Robust Performance Case Study: Topology of System Media”, Control Applications of Automation (IFAC), Visegrad, 2003. T.G. Robertazzi, Computer Networks and Systems. Queueing Theory and Performance Evaluation, Springer-Verlag, 2000. R. Surfozo, Introduction to Stochastic Networks, Springer-Verlag, 1999. R. German, Performance Analysis of Communication Systems: Modeling with Non-Markovian Stochastic Petri Nets, Wiley, 2000. J.B. Lewoc, Performance Evaluation Problems for Actual Computer Networks, AMSE Monographs, Tassin, 1990. Izworski A. and Lewoc J.B., Approximate Analytical Performance Modelling of a Computer Integrated Manufacturing and Management System, In 4th IMACS Symposium on Mathematical Modelling, (IMACS), Vienna, 2003. Lewoc J.B, Izworski A. And Skowronski S. An Internal Internet Traffic Modelling / Performance Measuring Tool. In: Mathematical Modelling (IMACS). Vienna, 2006.
Jozef Bohdan Lewoc. He graduated in Electronic from the Wroclaw University of Technology and in Mathematic (with high honour) from the University of Wroclaw. He applied analytical and event-driven simulation methods to investigate performance of the systems he designed. Though the computer tools available to him were obsolete of 5-10 years with respect to those available in the West, there never were any problems with performance of the systems he designed. Presently, he designs novel computer solutions needed by prospective users and performs the scientific investigations of the solutions.
573 | P a g e