pose a new generic model based on a client/server collaborative fil- tering algorithm and a behavior ... Cedex, France, email: {sylvain.castagnos, anne.boyer}@loria.fr ... The next section is dedicated to a short state-of-the-art about collaborative .... Nevertheless, in an industrial context, there can be marketing reasons.
A Client/Server User-Based Collaborative Filtering Algorithm: Model and Implementation CASTAGNOS Sylvain and BOYER Anne1 Abstract. This paper describes a new way of implementing an intelligent web caching service, based on an analysis of usage. Since the cache size in software is limited, and the search for new information is time-consuming, it becomes interesting to automate the process of selecting the most relevant items for each user. We propose a new generic model based on a client/server collaborative filtering algorithm and a behavior modeling process. In order to highlight the benefits of our solution, we collaborated with a company called ASTRA which is specialized in satellite website broadcasting. ASTRA has finalized a system sponsored by advertisement and supplying to users a high bandwidth access to hundreds of websites for free. Our work has been implemented within its software architecture and, in particular, within its recommender system in order to improve the satisfaction of users. Our solution is particularly designed to address the issues of data sparsity, privacy and scalability. Because of the industrial context, we consider the situation where the set of users is relatively stable, whereas the set of items may vary considerably from an execution to another. In addition to the model and its implementation, we present a performance assessment of our technique in terms of computation time and prediction relevancy.
1
INTRODUCTION
With the development of information and communication technologies, the size of information systems all over the world has exponentially increased. This causes at least two problems. First, it becomes difficult for users to identify interesting items in a reasonable time, even if they use a powerful search engine. Secondly, the amount of available data is now much more important that the cache size of some industrial applications on client side. We can quote the examples of strategic awareness tools in big companies or the satellite data transfers. In this paper, we propose a generic collaborative filtering model to cope with these problems. Our approach is suitable for client/server architectures. We designed it to address three main difficulties inherent in an industrial context: the recommender system scalability, the user privacy and the data sparsity. We implemented our work in the context of satellite website broadcasting. Thus, we run our model in the architecture of Casablanca, which is a product of the ASTRA company2 . ASTRA conceived a service of satellite website broadcasting service called Sat@once. This service is sponsorised by advertisement so that it is free for users, provided that they use a DVB receiver. The satellite bouquet holds 150 websites which are sent to about 120.000 persons through a high-bandwidth and one-way transmission. More1 2
LORIA - Universit´e Nancy 2, B.P.239, 54506 Vandoeuvre-l`es-Nancy Cedex, France, email: {sylvain.castagnos, anne.boyer}@loria.fr http://www.ses-astra.com/
over, users can inform the server about their preferences by using a standard internet connection. Initially, they only could send the nonnumerical votes which appear as a list of favorite websites. Once a week, the preferences of all users are used to make up the bouquet with the most popular websites. Because of this industrial context, we consider the situation where users are relatively stable, whereas the set of items may vary considerably from an execution to another. In addition to the research constraints, we also had to be compliant with the Casablanca architecture and the ASTRA business model. The next section is dedicated to a short state-of-the-art about collaborative filtering techniques. Afterwards, we will present our model and its implementation in a satellite website broadcasting software. The fourth part offers an evaluation of our algorithm, both in terms of computation time and relevancy recommendations. At last, we will highlight the benefits of this decentralized architecture.
2 RELATED WORK B REESE et al [3] have identified, among existing techniques, two major classes of algorithms to solve this problem : the memory-based and the model-based algorithms. The memory-based algorithms maintain a database containing votes of all users. A similarity score (R ESNICK [9], M AES [11] or B REESE [3]) is determined between active user and each of the others members. Then, each prediction leads to a computation on all of this source of data. The influence of a person is all the stronger in it since his/her degree of similarity with the active user is great. These memory-based techniques offer the advantage to be very reactive, by integrating immediately modifications of users profiles into the system. However, B REESE et al [3] are unanimous in thinking that their scalability is problematic: even if these methods work well with small-sized example, it is difficult to change to situations characterized by a great number of documents or users. Indeed, time and space complexities of algorithms are much too important for big databases. The model-based algorithms constitute an alternative to the problem of combinatorial complexity. In this approach, collaborative filtering can be seen as the computation of the expected value of a vote, according to preferences of active user. These algorithms create descriptive models correlating persons, resources and associated votes via a learning process. Then, predictions are infered from these models. The item-item algorithm [10] belongs, among others, to this family. U NGAR and F OSTER [12] have also imagined the possibility to classify users and resources in groups. So, for each category of users, we must estimate the probability that a resource could be chosen. According to P ENNOCK et al [8], model-based algorithms minimize the problem of algorithmic time complexity. Furthermore, they
perceive in these models an added value beyond the only function of prediction: they highlight some correlations in data, proposing by that way an intuitive reasoning for recommendations or making simply the hypotheses more explicit. However, these methods are not enough dynamic and they react badly to insertion of new contents in database. Moreover, they require a learning phase at the same time penalizing for the user3 and expensive in computation time for large databases. Consequently, one of the main difficulty of collaborative filtering remains the scalability of systems. The model proposed in this article is an hybrid approach, combining advantages of memory-based and model-based methods to distribute the computations between the server and the clients.
3
ARCHITECTURE
The architecture of our information filtering system is shown on figure 1. This model associates a behavior modeling method based on the Chan formula [5] and a new version of the hierarchical clustering algorithm [6]. This new version – called FRAC in the rest of this article – has the advantages to be distributed, to be optimized in computation time and to converge systematically.
Figure 1. Architecture of the information filtering module.
In order to distribute the system, the server side part is separated from the client side. The function of user modeling determines numerical votes for items according to user actions. Then, numerical votes are sent to the server, like the non-numerical ones4 . Thus, the server uses, as input parameters, the matrix of user votes and the database including sites and descriptors. In this way, the server has no information about the population, except anonymous votes. User preferences are stored in the profile on clients. Thus, the confidentiality criterion is duly fulfilled. The FRAC algorithm aims at reducing quantity of data that must be processed. The offline computations of FRAC allow to build typical user profiles. It is no longer necessary to consider the whole vote matrix, but only votes of persons belonging to the group of the active user. This reduces the number of considered people, but also 3 4
The recommendations system won’t be able to provide relevant documents as soon as it receives the first queries. The list of favorites are given explicitly by users, while numerical votes are estimated in a transparent way. This is the reason why we use the nonnumerical votes to determine the content of the bouquet.
the number of items: it is pointless to keep documents that none of the group members has read. In this way, we avoid the problem of bottleneck of collaborative filtering on client side: the active user is identified to one of the typical users groups in a very short time.
3.1
Behavior modeling
In the Casablanca interface, users have the possibility to define a list of favorites, that is to say some sites they are interested in among those contained in the bouquet. However, we can’t describe these non-numerical votes as boolean. We can’t differentiate items in which the active user is not interested (negative votes) from those he/she doesn’t know or has omitted. This kind of votes is not sufficient to do relevant predictions with collaborative filtering methods. In an ideal recommender system, users can explicitly rate each item. Ratings are integers in accordance with an arbitrary graduation. Nevertheless, in an industrial context, there can be marketing reasons which require to proceed differently. The ASTRA satellite bouquet is partially fulfilled with websites paid by advertisers. In this case, the risk that most users negatively and explicitly rate an advertisement can’t be taken. For this reason, we have chosen to determine numerical marks in a transparent way for users. Another advantage of this method is to deal with the problem of sparsity by increasing the number of votes in the matrix. Users generally rate the websites with whom they are familiar. It only represents a small part of the available items. The behavior modeling process is based on implicit criteria. A function estimates ratings that the active user is likely to give to different websites. It relies on several parameters, such as the percentage of visited links, the time or the reading frequency. In this way, the system can collect much more information than when using explicit ratings of users. Casablanca generates log files on client side. These files are very similar to those of an Apache server. Each time a page is loaded in the portal, pieces of data are stored including time, path of the page and information about the website it belongs to. We consequently deduce the user preferences from an analysis of usage. To do so, we developped a user modeling function based on the formula of Philip C HAN [5]. We adapted this formula in such a way that it is applicable to items (cf. infra, formula 1, p. 3), while the original formula was designed for web pages. But, in the ASTRA context, items correspond to websites, that is to say indivisible sets of pages. The time spent on an item is, for example, calculated as the cumulative times spent on each of its pages. A consultation is the set of consecutive lines relating to a same website in the log files. The log files only stored the uploading time of a page. We consequently have to limit the duration beyond the last upload in a consultation, if there is no other consultation just after. We also modified coefficients in the original Chan formula, in order to optimize the results in accordance with log files of ASTRA. All pieces of information retrieved in the log files remain on client side, in order to preserve privacy. Only numerical votes which have been deduced from this process are sent anonymously to the server5 . We call them ”user profiles”. They are required for the use of FRAC clustering algorithm. These profiles are not persistent, that is to say stored for a limited duration. Moreover, the sending on server side is initiated by the active user. 5
There is no way to retrieve the user from a profile on the server [4].
Adapted Chan formula: Interest(item) = 1 + 2 . IsFavorite(item) + Recent(item) + 2 . Frequency(item) . Duration(item) + PercentVisitedLinks(item)) With: Recent(item) =
date(last visit) − date(log beginning) date(present) − date(log beginning)
And: Duration(item) = maxconsultations
³ time spent on pagesof item ´ size of the item
(1)
Interest(item) must be rounded up to the nearest integer. IsF avorite(item) equals 1 if the item has been voted by the user (non-numerical vote) and 0 otherwise. F requency(item) . Duration(item) must be normalized so that the maximum is 1. P ercentV isitedLinks(item) corresponds to the number of visited pages divided by the number of pages on the item.
3.2
Clustering algorithm
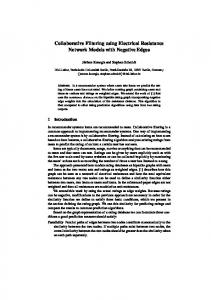
Once the profiles of users have been sent to the server, the system has to build virtual communities of interests. In our model, this step is carried out by a hierarchical clustering algorithm, called FRAC. This is an improved and decentralized version of the RecTree algorithm [6]. It attempts to split the set of users into cliques by recursively calling the nearest neighbors method [7] (K-Means), as illustrated on figure 2.
leaf of the tree share the same opinion concerning the assignment of a rating for a given item. The K-Means algorithm is very sensitive to initial starting conditions and may converge more or less quickly to different local minima6 . The usual way to proceed consists in choosing randomly k centers in the users/items representation space. Numerous studies have been made to improve K-Means by refining the selection of these initial points [2]. But it remains a difficult problem and some of these approaches don’t obtain better results than the method with a random initialization. In our case, the problem is much simpler since we only have two centers. Thus, we propose a new way to select the starting points, shown on figure 3.
Figure 2. Hierarchical organization of users.
In this section, we explain how to build typical user profiles on server side and how to identify the active user to a group. This second step takes place on client side. We made sure that the identification phase is done in a very short response time. In this way, the client part provides real-time predictions. Offline computation time on server side has also been improved to fit in with the update frequency of the ASTRA satellite bouquet. The FRAC algorithm is a model-based approach, described as a clustering method. However, it is managed as a memory-based approach because all the pieces of information are required for similarity computation. It allows, within the scope of our architecture, to limit the number of persons considered in the prediction computations. Thus, the results will be potentially more relevant, since observations will be based on a group closer to the active user [12]. In order to compute these groups of interests, the server extracts data from the profiles of users and aggregates the numerical votes in a global matrix. This matrix constitutes the root of the tree (cf. supra, fig. 2). The set of users is then divided into two sub-groups using the K-means method. In our case, the number k equals 2, since our overall strategy is to recursively divide the population into binary sub-sets. Once this first subdivision has been completed, it is repeatedly applied to the new subgroups, and this until the selected depth of the tree has been reached. This means, the more one goes down in the structure of the tree, the more the clusters become specific to a certain group of similar users. Consequently, people belonging to a
Figure 3. Initialization of 2-Means algorithm.
We work in a N-dimensional space, since the coordinates correspond to the votes of users for the N items. However, the example on the diagram 3 is in dimension 2 for more legibility. We start from the principle that the two most distant users are inevitably in different clusters. Consequently, they constitute the ideal candidates for the initial points. To identify them, we first search the most distant point from the middle M of the users/items representation space. This point is called A on figure 3. Then, we compute the point B, which is the most distant from A. A and B are subsequently the starting points of the 2-Means algorithm. This initialization phase is in o(2n), where n is the number of users. Metrics used to determine distances is the Pearson correlation coefficient [9]. Once groups of persons have been formed as previously mentioned, the position of the center is recalculated for each cluster (either by computing the isobarycenter, either by using the equation 2 according to the precision we want) and this operation is repeated from the beginning until we have obtained a stable state (where the 6
We want to minimize the distances between users of a same group and maximize them between users of different clusters.
centers no longer move after recalculation of their position). Our initialization allows to reach this state much more quickly. X
rct+1 ,l = α.
(ru,l .|w(ct , u)|)
(2)
Yct ,u
With:
rct+1 ,l the coordinate of the new center ct+1 for the item l; ru,l the vote of the user u for the item l; w(ct , u) the distance between the previous center and u; Yct ,u = {u|w(ct , u) 6= 0}; 1 α= P . |w(c ,u)| Yct ,u
t
The nearest neighbors algorithm complexity is in o(k2 n) for k clusters and n users. Moreover, the whole complexity of the construction of the tree yields o(n.log2 n). The final center of each leaf of the FRAC tree corresponds to a profile of typical users. It means that we consider these centers as virtual users synthesizing the preferences of each subset of users. The profiles of typical users are then sent on client side, using IP multicast addresses. Subsequently, the system uses the Pearson correlation coefficient to compute distances between the active user and the typical users. We consider that the active user belongs to the community whose center is the closest to him/her. At last, we can predict the interest of the active user for a resource rl with the equation 3. pua ,rl = max(rmin , min(rut ,l + (rua − rut ), rmax ) With:
(3)
ua the active user; ut the nearest typical user; pua ,rl the prediction of ua for rl ; ru the average of votes of u; rmin and rmax respectively the min and max bounds of the vote scale.
The identification phase of the active user to one of cliques is in o(2p) on client side, where p corresponds to depth of the tree. Even when the active user didn’t want to share his/her preferences, it is possible to do predictions since they are made on client side. The clusterization can be performed so that cliques hold about the same number of persons for a given depth of the tree. In this way, we introduce novelty in recommendations.
4
The results of these tests are shown in the table 1. The announced times include the writing of results in text files. The FRAC algorithm provides results in a quite short time. It is thus possible to apply it to large databases. For example, the system only needs about 6 or 7 minutes to compute typical behavior profiles with 10.000 users and 100 items. In the same case, the CorrCF algorithm requires several hours of computation (one of which is spent to compute the similarity matrix). The response time of CorrCF increases besides exponentially with the size of the database and is not in accordance with industrial constraints. We note that Item-Item gets results much more quickly than FRAC when there is a lot of users and only few items. Nevertheless, the tendency may be reversed when the number of items grows, even if the number of users is still much more important (cf. table 1 for 10.000 users and 1000 items). Moreover, the corpus we used is not the most appropriate for our algorithm, since the number of items is almost twice as big as the number of users. At last, we have tried to cluster huge populations. The FRAC algorithm was able to supply results in about 11 hours for 120.000 users and 150 items. This computation time is much smaller than the bouquet update period7 . Consequently, it is completely suitable for the Casablanca software.
4.2
Recommendations relevancy
In order to compute the prediction relevancy in our system, we used the GroupLens database8 . The latter is composed of 100.000 ratings of real users. Thus, we considered a matrix of 943 users and 1682 items. Moreover, each user has rated at least 20 items. The database has been divided into a training set (including 80% of all ratings) and a test set (20% of votes). We compare our algorithm with the three others by using the Mean Absolute Error (MAE). MAE is a widely used metric which shows the deviation between predictions and real user-specified values. Consequently, we computed the average error between the predictions and the N ratings of the test set as shown in formula 4. PN i=1 |pi − qi | M AE = (4) N The results are shown in the figure 4. The FRAC algorithm does predictions as good as the CorrCF – which is memory-based – and not so far from the Item-Item.
PERFORMANCE ANALYSIS
In this section, we compare our clustering algorithm with Item-item [10] and the Correlation-based Collaborative Filter CorrCF [9]. We have implemented all these methods in Java. The different tests have been done on a laptop computer equipped with a CPU 1.8 GHz and 1 Go of RAM. We evaluate these techniques in terms of computation time and relevancy of predictions.
4.1
Computation time
In order to compare the computation times of the aforementioned algorithms, we have generated matrices with different sizes. In this simulation, the votes of each user follow a Gaussian distribution centered on the middle of the representation space. We argue that this situation increases the number of iterations needed in the clustering algorithm, since the users are close to each other. Moreover, there is only 1% of missing data in the generated matrices. Consequently, we almost work in worse case for the computation time tests.
Figure 4. Comparison of prediction quality.
7 8
The bouquet is updated once a week. It means that the list of websites change. But the content of websites is updated every two hours. http://www.grouplens.org/
Items Users 200 400 600 800 1.000 1.400 10.000
FRAC 0”70 1”84 3”60 7”03 8”30 11”21 6’50”
100 CorrCF 2”60 6”09 11”78 19”98 30”22 1’00” 7h30’
Item-Item 2”14 3”87 5”59 7”23 8”56 11”50 1’22”
FRAC 1”35 2”09 4”10 7”34 9”45 12”81 9’12”
150 CorrCF 3”17 7”62 15”21 25”67 40”68 1’17” -
Item-Item 2”71 5”29 7”34 10”53 12”84 18”10 2’05”
FRAC 4”78 8”58 15”43 30”17 39”71 49”47 14’22”
1000 CorrCF 11”09 32”24 1’04” 1’52” 3’06” 6’04” -
Item-Item 52”74 1’22” 2’05” 2’33” 3’25” 4’29” 49’28”
Table 1. Computation times of different collaborative filtering algorithms.
5
CONCLUSION
The novelty of our model relies on the fact that we have mixed a distributed collaborative filtering method with a behaviour modeling technique. The main advantage of this combination is to take into account in an overall way the strong constraints due to an industrial context such as the time constraints, the privacy, the data sparsity and the scalability to real commercial applications. Our recommender system has been implemented in a satellite broadcasting software with about 120.000 users. We also dealt with the ASTRA business plan by getting individual preferences – only stored on client side – in a transparent way. Before our collaboration with ASTRA, Casablanca wasn’t able to classify websites in order of preference. Thus, the filtering module was accepting the voted packages which were broadcasted until the cache was full. Most of the time, the content of the cache wasn’t optimum and was even almost random. From now on, the system is able to anticipate the arrival of the packages and to decide if it is interesting to add them in the cache. The filtering module sorts out the websites and optimizes the suggestions according to the cache size defined by the active user. We are now evaluating the satisfaction of users as regards recommendations. ASTRA has recruited voluntary beta-testers to experiment the system in real conditions. We searched in the literature the different existing methodologies to measure the user satisfaction. We finally choose the approach in [1] because it is relying on an analysis of usage. While waiting for the results of this long-term study, the offline performance analysis highlights the fact that our algorithm gets rather quickly results on server side, even when the corpus is not very adequate. Moreover, the identification phase on client side is in o(2p). This part of computations has been optimized in order to supply users with recommendations in a very short response time. Another advantage of our algorithm is the stability of the model. Thanks to the new initialization phase, the results are reproducible when we launch the clustering process several times. Furthermore, contrary to some algorithms such as K-Means, the computations systematically end.
ACKNOWLEDGEMENTS We want to thank ASTRA and the CRPHT which have encouraged this work.
REFERENCES [1] Anne Boyer and Regis Lhoste, ‘Smart agent evaluation methodology (d4.1 addendum)’, in IST Elin Project N2000-30188, (November 2004).
[2] Paul S. Bradley and Usama M. Fayyad, ‘Refining initial points for kmeans clustering’, in Proceedings of the 15th International Conference on Machine Learning (ICML98), pp. 91–99, San Francisco, USA, (May 1998). Morgan Kaufmann. [3] John S. Breese, David Heckerman, and Carl Kadie, ‘Empirical analysis of predictive algorithms for collaborative filtering’, in Proceedings of the fourteenth Annual Conference on Uncertainty in Artificial Intelligence (UAI-98), pp. 43–52, San Francisco, CA, (July 1998). [4] Sylvain Castagnos and Anne Boyer, ‘From implicit to explicit data: A way to enhance privacy’, in Workshop on Privacy-Enhanced Personalization (CHI 2006), Montreal, Canada, (April 2006). [5] Philip Chan, ‘A non-invasive learning approach to building web user profiles’, in Workshop on Web usage analysis and user profiling, Fifth International Conference on Knowledge Discovery and Data Mining, (August 1999). [6] S. H. S. Chee, J. Han, and K. Wang, ‘Rectree : An efficient collaborative filtering method’, in Proceedings 2001 Int. Conf. on Data Warehouse and Knowledge Discovery (DaWaK’01), volume 2114, pp. 141– 151, Munich, Germany, (September 2001). Lecture Notes in Computer Science. [7] J. L. Herlocker, J. A. Konstan, A. Borchers, and J. Riedl, ‘An algorithmic framework for performing collaborative filtering’, in In Proceedings 1999 Conference of Research and Development in Information Retrieval, pp. 230–237, Berkeley, CA, (August 1999). [8] David M. Pennock, Eric Horvitz, Steve Lawrence, and C. Lee Giles, ‘Collaborative filtering by personality diagnosis: a hybrid memory- and model-based approach’, in Proceedings of the sixteenth Conference on Uncertainty in Artificial Intelligence (UAI-2000), pp. 473–480, San Francisco, USA, (2000). Morgan Kaufmann Publishers. [9] P. Resnick, N. Iacovou, M. Suchak, P. Bergstorm, and J. Riedl, ‘Grouplens: An open architecture for collaborative filtering of netnews’, in Proceedings of ACM 1994 Conference on Computer Supported Cooperative Work, pp. 175–186, Chapel Hill, North Carolina, (1994). ACM. [10] Badrul M. Sarwar, George Karypis, Joseph A. Konstan, and John Reidl, ‘Item-based collaborative filtering recommendation algorithms’, in World Wide Web, pp. 285–295, (2001). [11] Upendra Shardanand and Patti Maes, ‘Social information filtering: Algorithms for automating “word of mouth”’, in Proceedings of ACM CHI’95 Conference on Human Factors in Computing Systems, volume 1, pp. 210–217, (1995). [12] L. Ungar and D. Foster, ‘Clustering methods for collaborative filtering’, in Proceedings of the Workshop on Recommendation Systems, Menlo Park California, (1998). AAAI Press.